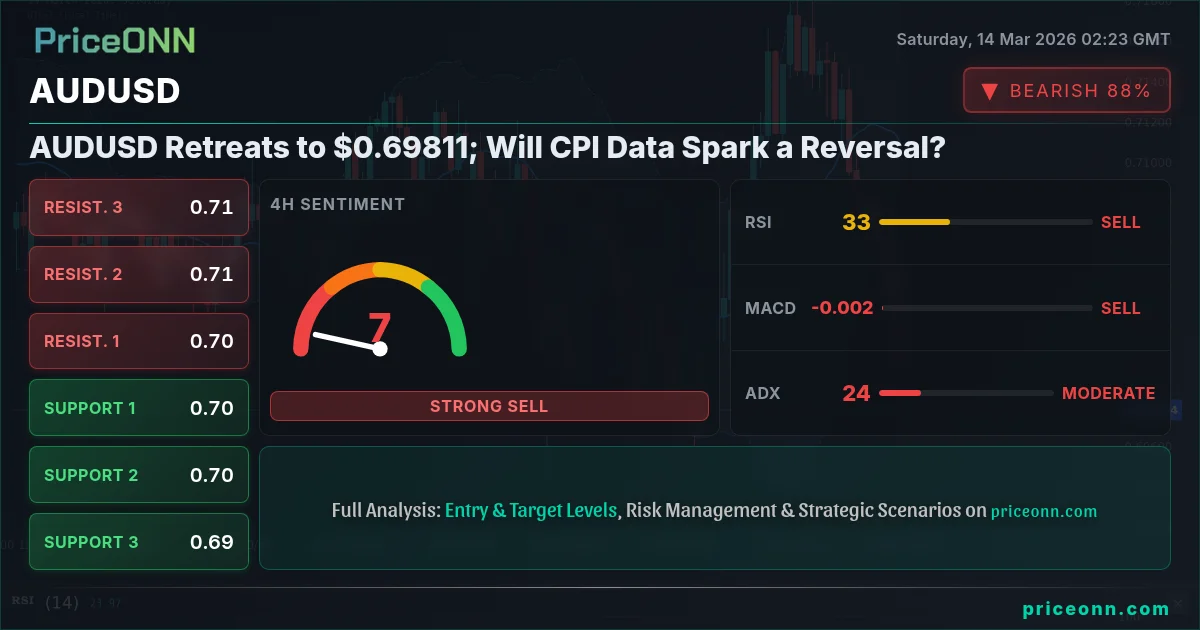
AUDUSD is currently trading at $0.69811, retreating from earlier highs as the U.S. Dollar Index (DXY) strengthens. The pair is defending key support levels, but the overall technical picture remains bearish. The market awaits next week's Consumer Price Index (CPI) data, which could provide the next major catalyst.
- RSI at 23.99 signals oversold pressure on the 1H chart, potentially hinting at a short-term bounce.
- Critical support sits at $0.69861, tested multiple times in the last few hours. A break below could trigger further downside.
- MACD histogram shows deepening negative momentum on the 1D chart, suggesting the downtrend has legs.
- Dollar strength, with DXY at 100.2, is a major headwind for AUDUSD, increasing pressure on the pair.
Last Week in Review: Dollar Dominance
Last week saw AUDUSD under pressure, largely due to the strengthening U.S. dollar. The DXY climbed to 100.2, fueled by geopolitical tensions in the Middle East and expectations of continued hawkish policy from the Federal Reserve. This dollar strength put downward pressure on several major pairs, including EURUSD and AUDUSD, as noted in PriceONN's recent market news. The pair's weekly high was $0.70912, but it couldn't sustain the momentum.
According to a recent PriceONN analysis, AUDUSD defended key support as bets for a Reserve Bank of Australia (RBA) rate hike increased. The market is pricing in a higher probability of a rate hike from the RBA in the coming months, but this hasn't been enough to offset the dollar's strength. Last Friday close was around $0.70, and the pair is struggling to hold onto those gains.
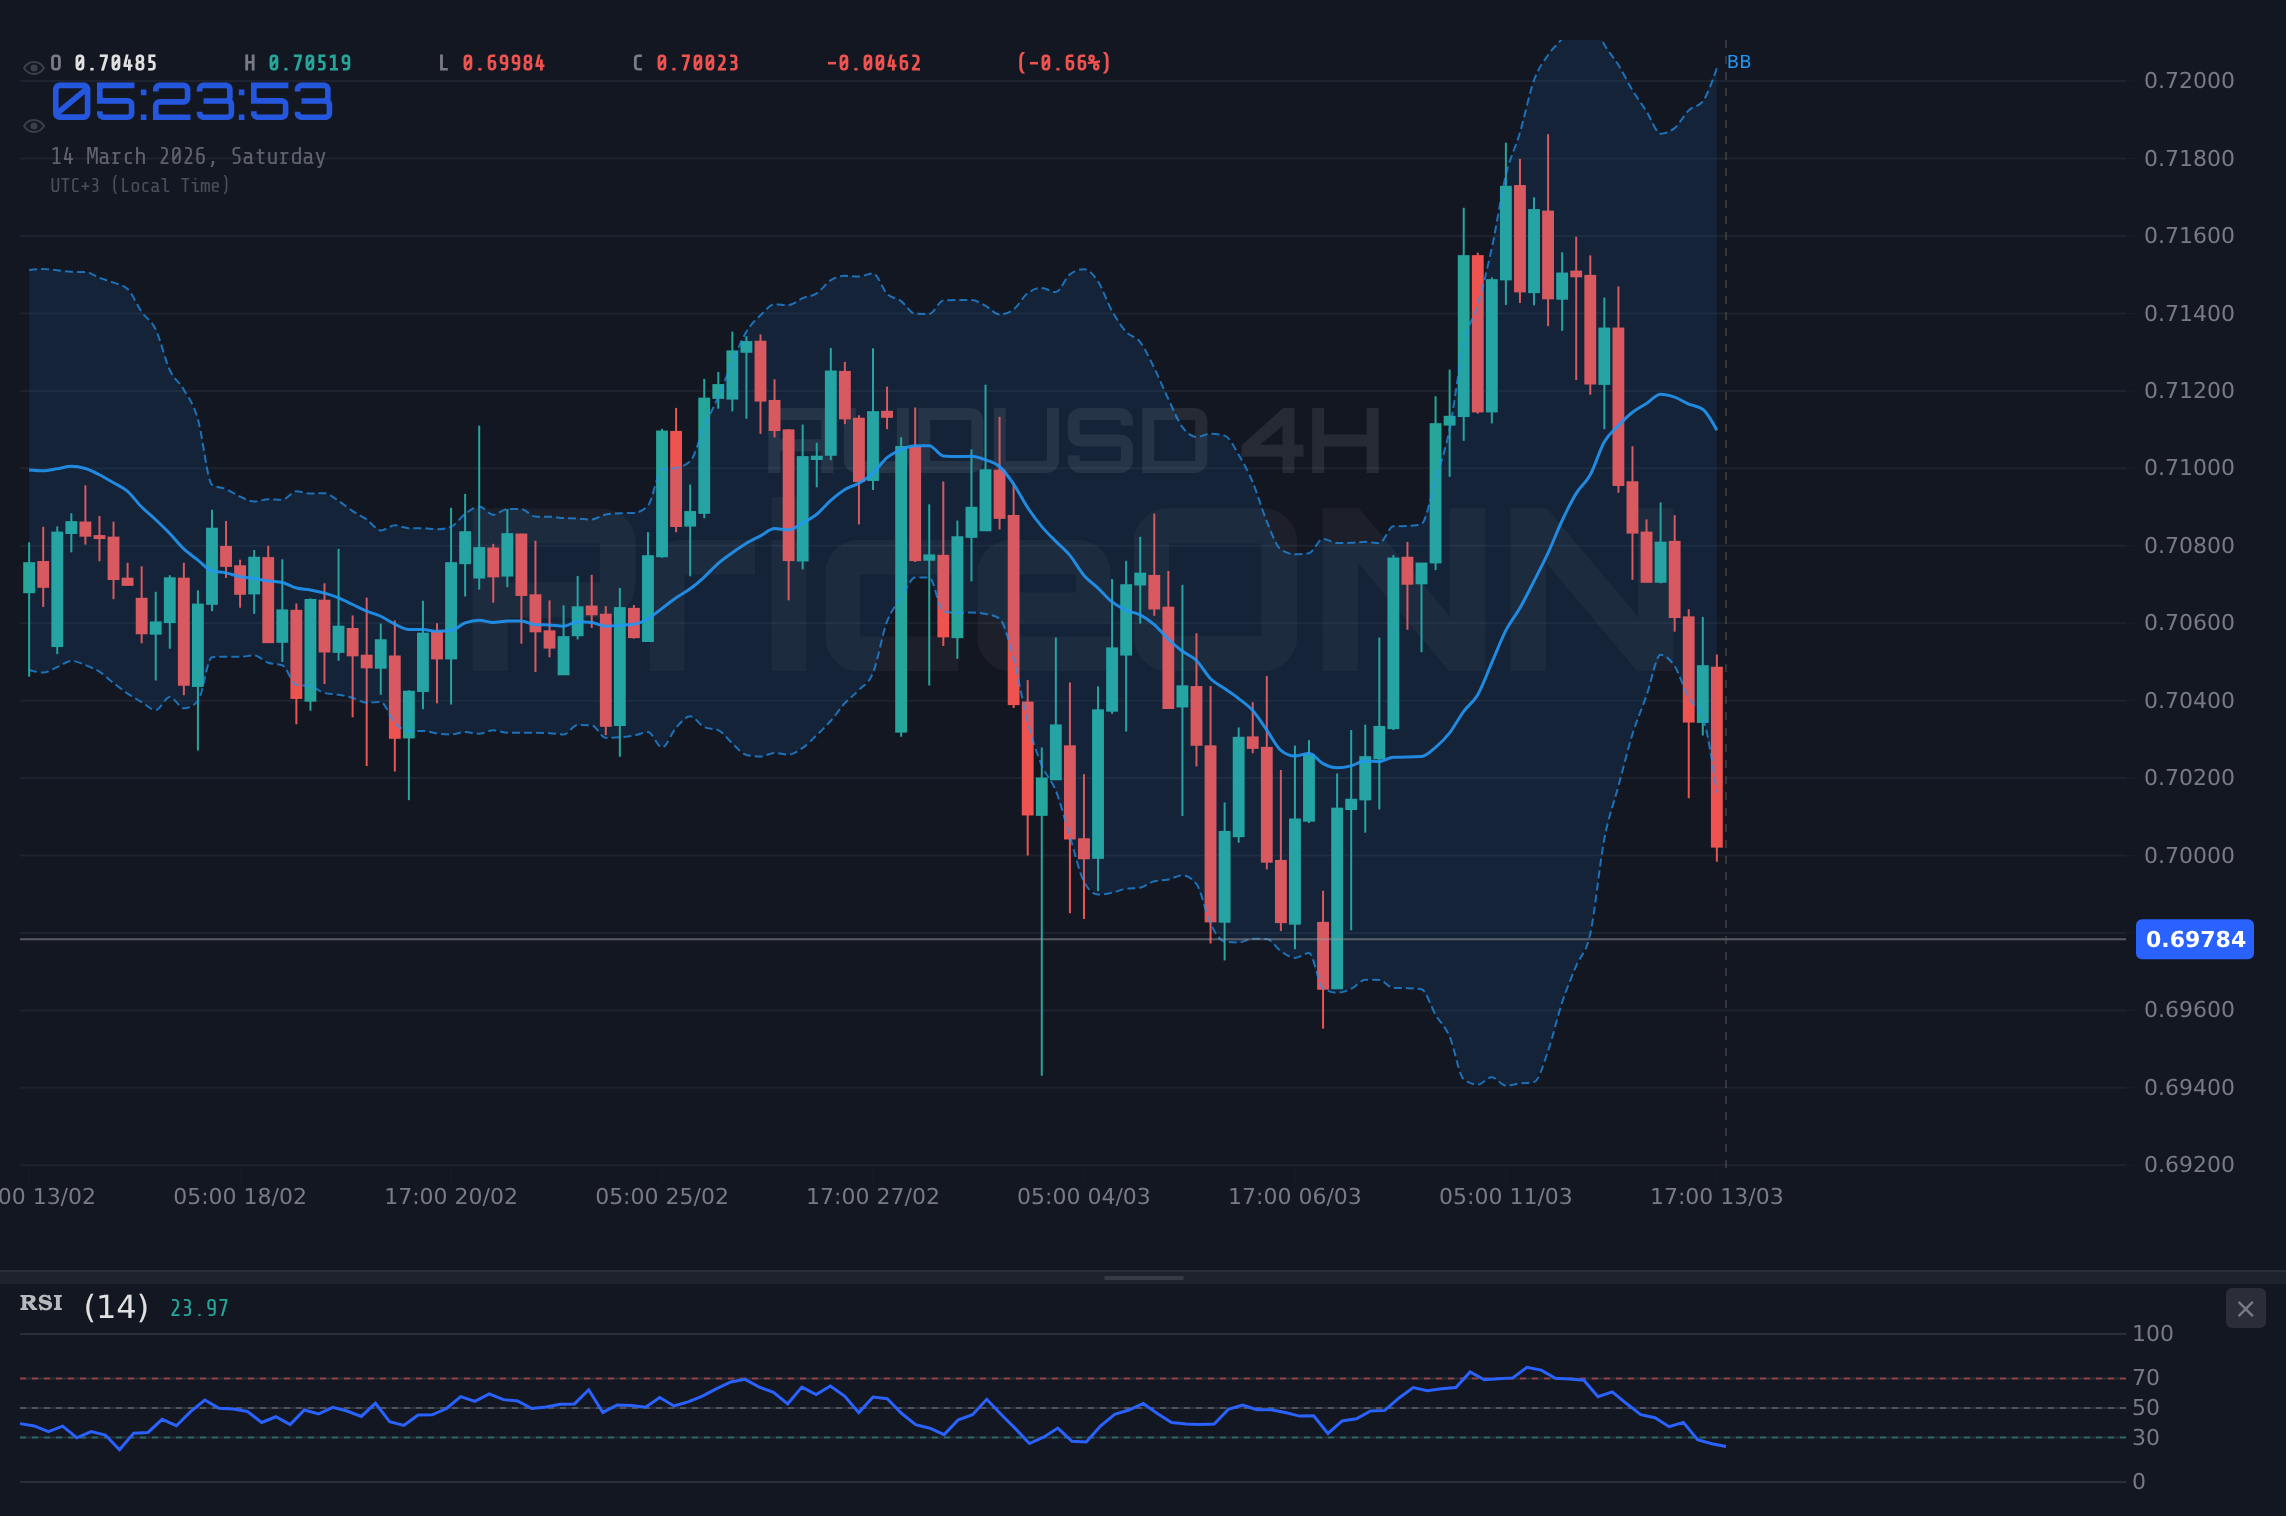
From a technical perspective, AUDUSD broke below the 0.7140 level mentioned in a previous PriceONN chart alert, signaling a new bearish impulsive move. This bearish breakout triggered stop losses and accelerated the decline. The pair now faces a test of its resolve around the $0.69861 support level.
The Bear's Path: Breakdown Below $0.69861
The bearish scenario hinges on a sustained break below the $0.69861 support level. The 1H chart shows strong downward momentum, with the ADX at 41.57 indicating a strong downtrend. If AUDUSD breaks decisively below $0.69861, the next target would be the $0.69516 support level on the daily chart, a move that could happen within the next week. This scenario is further supported by the negative momentum on the MACD, which is below the signal line on all timeframes.
The SP500 is also showing weakness, currently at 6625.3, down 0.81% on the day. This risk-off sentiment is contributing to the dollar's strength, as investors seek safe-haven assets. The dollar index is at 100.2, further pressuring AUDUSD. The bearish scenario gets an estimated probability of 40%.
A Bullish Reversal: Holding $0.69861 and Eyeing $0.70137
The bullish scenario depends on AUDUSD holding the $0.69861 support level and staging a reversal. The 1H RSI at 23.99 signals oversold conditions, suggesting a potential for a short-term bounce. If the pair can break above the $0.70137 resistance level on the 1H chart, it could trigger a move towards the $0.70409 resistance level on the daily chart. This scenario is less likely, given the overall bearish technical picture, but a weaker-than-expected CPI print next week could provide the catalyst. The stochastic oscillator is at 5.43, suggesting a possible reversal. A bullish move is estimated to have a 30% probability.
The Waiting Game: Stuck Between $0.69861 and $0.70137
The neutral scenario involves AUDUSD trading in a range between the $0.69861 support and the $0.70137 resistance. The ADX on the daily chart is only 26.01, indicating a relatively weak trend overall. If neither the bullish nor bearish triggers are met, the pair could remain range-bound for the next few days. Traders should watch for a breakout in either direction to signal the next move. This scenario has an estimated probability of 30%.
| Scenario | Trigger | Target | Probability |
|---|---|---|---|
| Bearish | Break below $0.69861 | $0.69516 | 40% |
| Bullish | Break above $0.70137 | $0.70409 | 30% |
| Neutral | Range-bound between $0.69861 and $0.70137 | N/A | 30% |
The most likely scenario is a bearish continuation, given the strong dollar and the negative technical indicators. However, the upcoming CPI data could change the picture dramatically. Traders should be prepared for all three scenarios and manage their risk accordingly.
Key Levels and Events to Watch This Week
This week, the key event to watch is the U.S. CPI data. A stronger-than-expected CPI print could fuel further dollar strength and pressure AUDUSD. On the other hand, a weaker-than-expected CPI could trigger a dollar sell-off and a bullish reversal for AUDUSD. Traders should also monitor geopolitical developments in the Middle East, as these could impact risk sentiment and the dollar's safe-haven appeal.
Specifically, the economic calendar shows several USD events scheduled for Wednesday, March 11, and Friday, March 13. The market's reaction to these events is uncertain, but the volatility could create opportunities for nimble traders. It's important to note that the previous values for these events were mixed, making it difficult to predict the outcome.
Technically, traders should watch the $0.69861 support level closely. A sustained break below could trigger a sharp sell-off. On the upside, a break above the $0.70137 resistance level could signal a bullish reversal.
IF price breaks above $0.70137 (1H resistance), THEN target $0.70409 (daily resistance) within the next week. Continuation possible to $0.70633 (4H resistance) on strong momentum.
IF price closes below $0.69861 (1H support), THEN target $0.69516 (daily support) within the next week. Breakdown possible to $0.69000 (psychological level) on strong momentum.
Trade Plan: AUDUSD Short
Given the overall bearish technical picture and the strong dollar, a short trade is recommended. The entry trigger is a break below the $0.69861 support level. The first target is $0.69516, and the second target is $0.69000. The stop loss should be placed above the $0.70137 resistance level to invalidate the trade. This setup has an estimated probability of 60%.
Technical Outlook Summary
| Indicator | Value | Signal |
|---|---|---|
| RSI (14) | 23.99 (1H) | Oversold (Possible Bounce) |
| MACD Histogram | Negative | Negative Momentum |
| Stochastic | 5.43 (1H) | Oversold |
| ADX | 41.57 (1H) | Strong Downtrend |
| Bollinger | Below Middle Band | Downtrend |
Key Levels
Support Levels
Resistance Levels
Frequently Asked Questions: AUDUSD Analysis
What happens if AUDUSD breaks below $0.69861?
If AUDUSD breaks below the $0.69861 support, it could trigger a sharp sell-off towards the $0.69516 level. The ADX at 41.57 indicates a strong downtrend, increasing the likelihood of this scenario.
Should I sell AUDUSD at current levels of $0.69811 given the RSI at 23.99?
While the RSI at 23.99 signals oversold conditions, it's not a reason to buy in isolation. The overall trend is bearish, so a short trade is recommended on a break below $0.69861, with a stop loss above $0.70137.
Is the MACD histogram being negative a bad sign for AUDUSD?
Yes, the negative MACD histogram indicates that the downtrend is likely to continue. The MACD is below the signal line on all timeframes, further supporting the bearish outlook.
How will the U.S. CPI data affect AUDUSD this week?
A stronger-than-expected CPI print could fuel further dollar strength and pressure AUDUSD, while a weaker-than-expected CPI could trigger a dollar sell-off and a bullish reversal for AUDUSD. The market is highly sensitive to inflation data right now.
Track markets in real-time
AI-powered analysis, technical indicators and real-time price data.
Join Our Telegram Channel
Breaking market news, AI analysis and trading signals instantly.
Join Channel