WTI Crude Oil Targets $100 as Last Friday Close at $99.18
WTI crude oil eyes $100, closing last Friday at $99.18. Middle East tensions and a Texas lithium discovery fuel bullish sentiment.
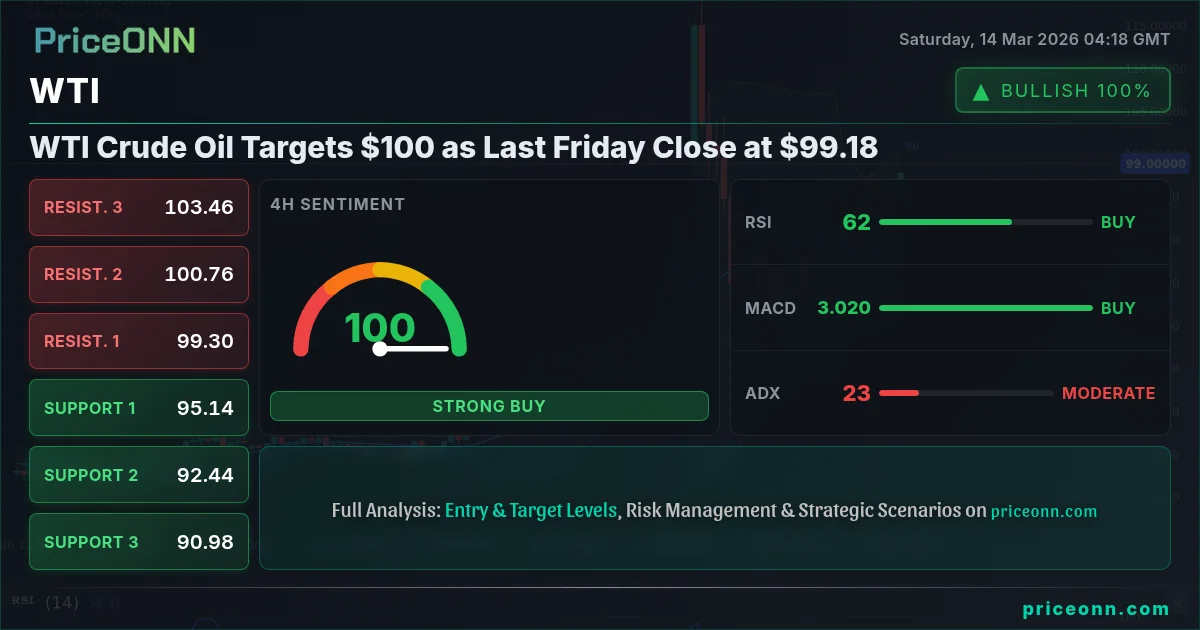
WTI crude oil closed last Friday at $99.18, continuing its bullish run amid escalating geopolitical tensions and shifting energy sector dynamics. The key question now is whether WTI can break through the psychological barrier of $100 per barrel. Several factors are at play, including Middle East tensions, a major lithium discovery in Texas, and the latest CPI data.
- WTI closed last Friday at $99.18, approaching the $100 mark amid bullish sentiment.
- RSI at 82.87 signals overbought conditions on the daily timeframe, suggesting caution.
- A break above the $99.25 resistance could target $102.3, but failure to hold $97.31 support could trigger a pullback.
- The latest geopolitical tensions in the Middle East and a Texas lithium discovery are key drivers.
Technical Overview
From a technical perspective, WTI’s daily chart reveals a strong uptrend, as confirmed by the ADX at 49.88. However, the RSI at 82.87 indicates that the market is currently in overbought territory, suggesting that the recent rally may be losing steam. The Stochastic oscillator, with %K at 51.72 and %D at 58.99, further supports this notion, signaling a potential pullback. Traders should watch for a possible retracement towards the $97.31 support level. On the hourly chart, the RSI is at 66.96, indicating a strong upward trend, but the stochastic oscillator shows an overbought condition with K=90.25 and D=72.38.
Analyzing the 4-hour timeframe, the RSI reads 61.89, confirming the ongoing bullish momentum. The MACD histogram remains positive, indicating sustained buying pressure. However, the Stochastic oscillator, with %K at 77.27 and %D at 80.8, suggests a potential short-term pullback. Key support levels to watch are $97.31, $92.95, and $90.72. Resistance levels lie at $99.25, $102.3, and $107.56.
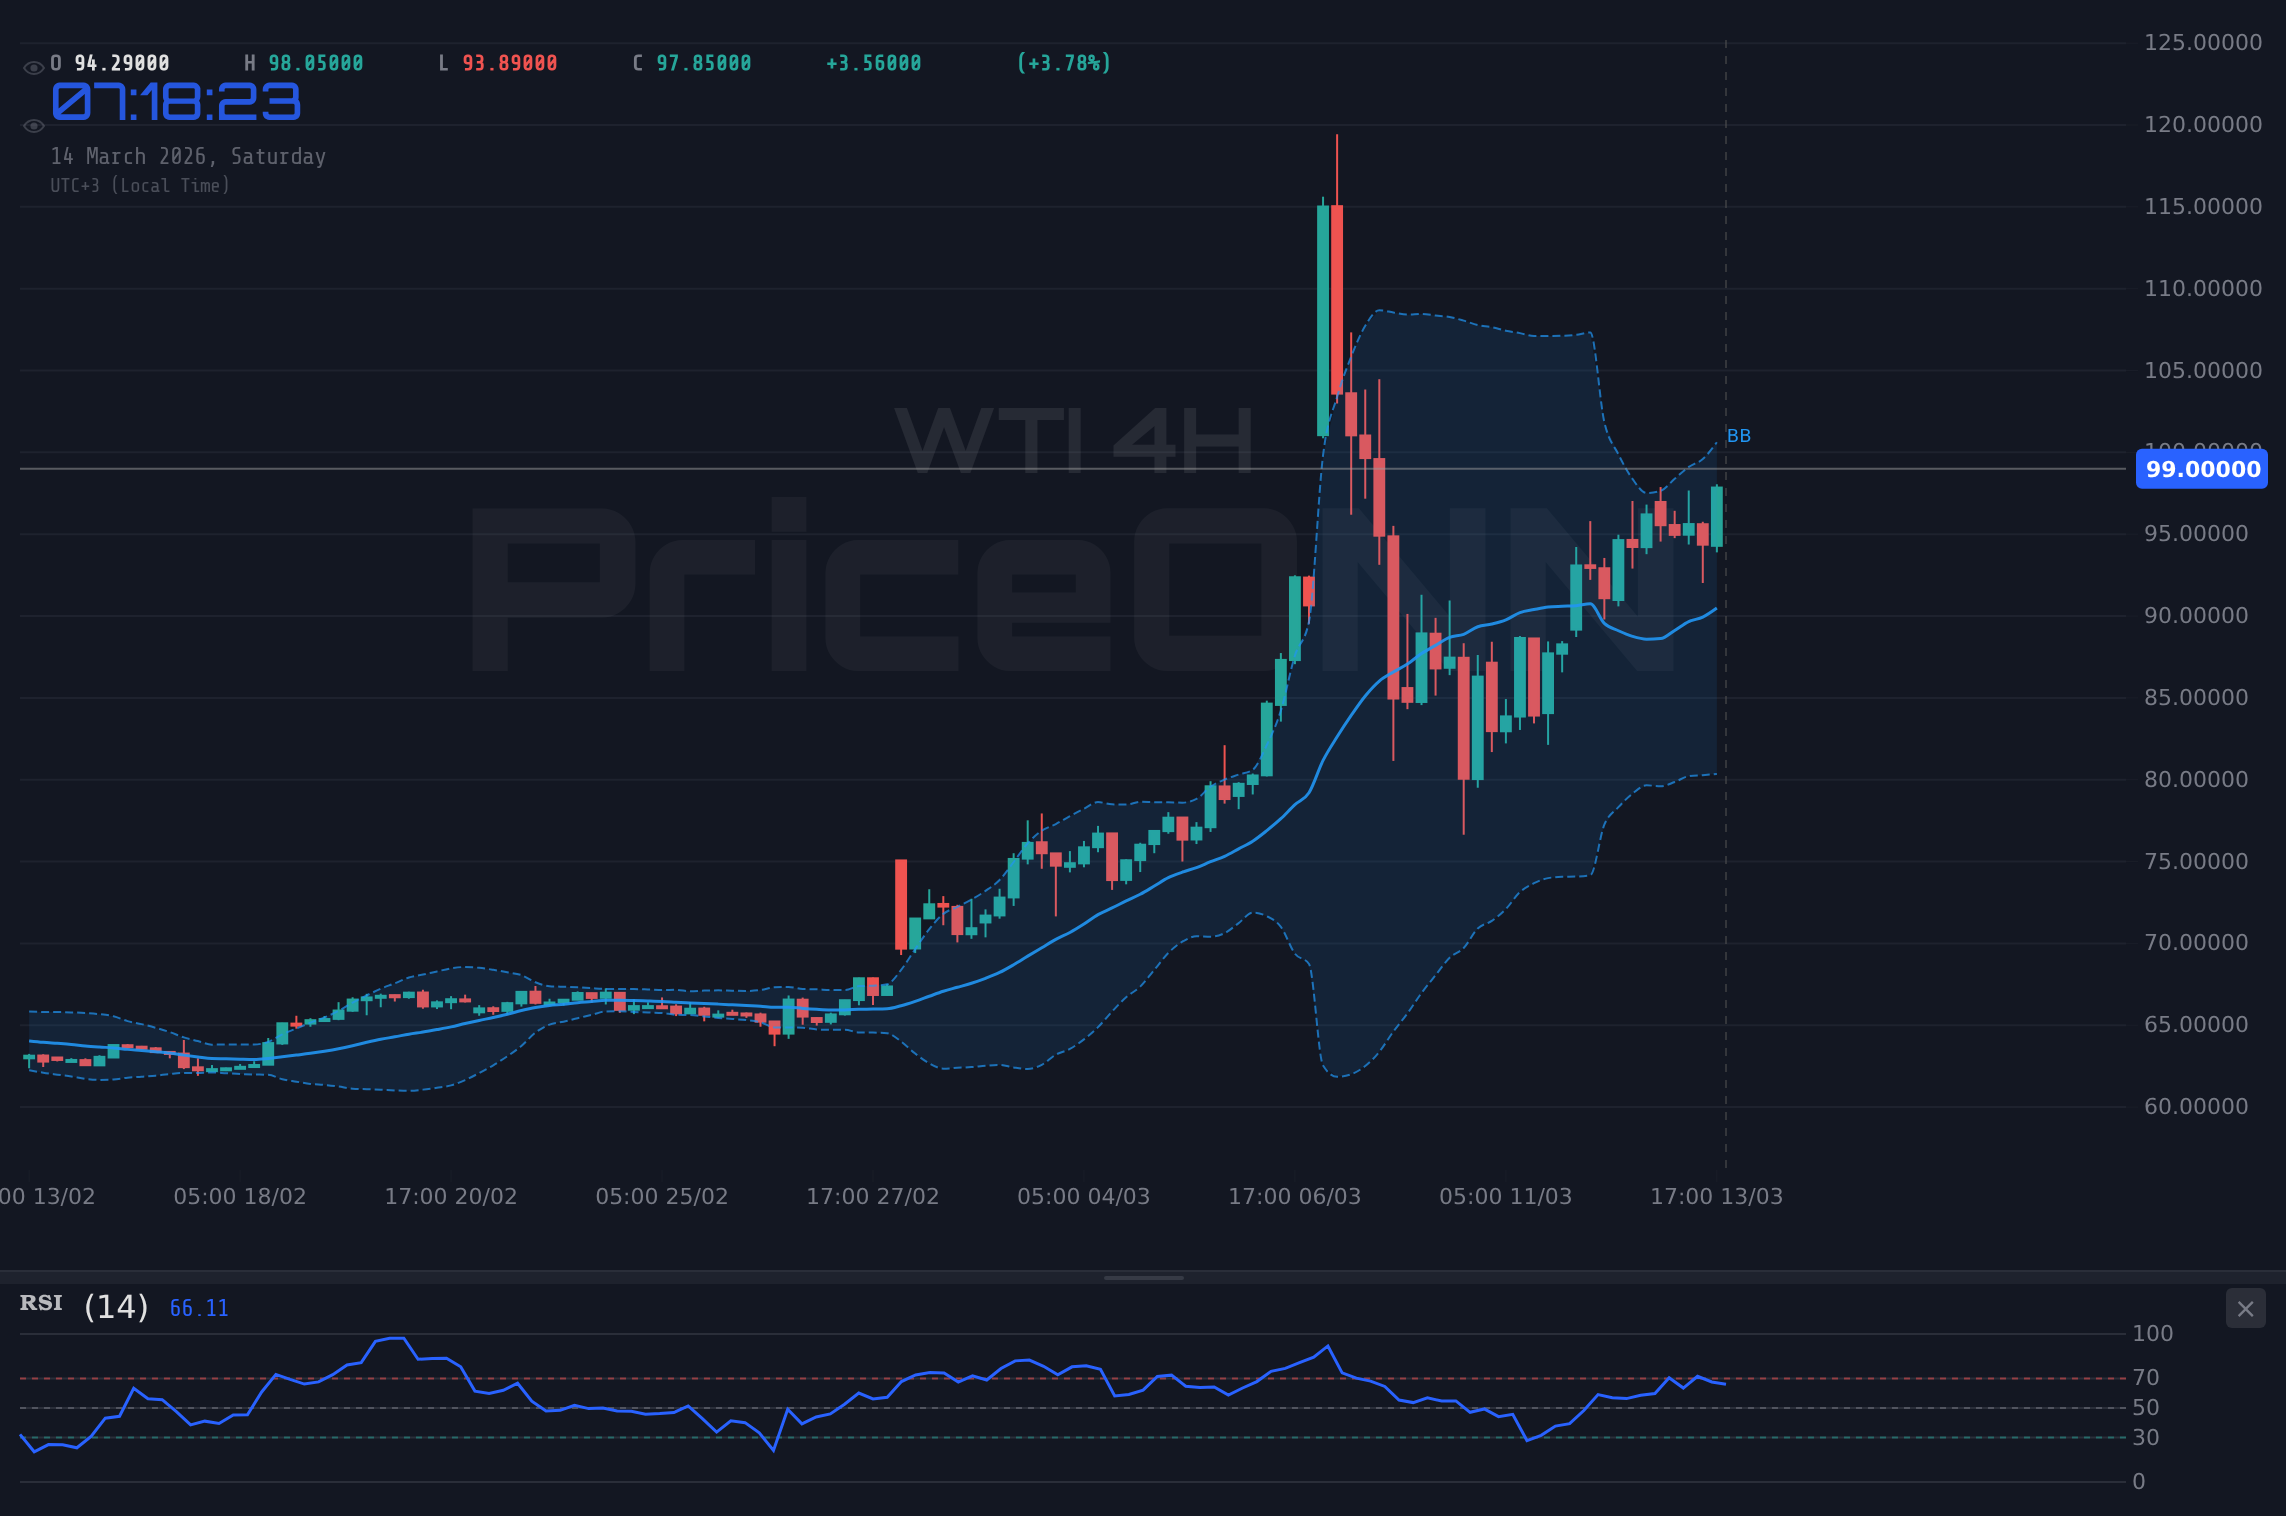
The 1-hour chart shows that WTI faces immediate resistance at $99.25. A successful break above this level could pave the way for further gains towards $102.3. However, a failure to overcome this resistance could lead to a pullback towards the $97.31 support. The current price action suggests that the market is testing the upper limits of its recent range. The 4-hour chart also reveals that WTI is trading above its 200-period moving average, which is currently acting as dynamic support.
The daily chart highlights the significance of the $99.25 resistance. A decisive break above this level could signal a continuation of the uptrend, with potential targets at $102.3 and $107.56. However, a failure to breach this resistance could lead to a deeper correction towards the $92.95 support. Given the overbought conditions indicated by the RSI, traders should exercise caution and await confirmation before initiating new long positions.
Upcoming Economic Data and Market Catalysts
The economic calendar features several key events that could impact WTI prices in the coming week. Of particular interest is the CPI data, which is expected to provide further insights into the current inflationary environment. Stronger-than-expected CPI data could fuel expectations of further monetary tightening by the Federal Reserve, potentially putting downward pressure on oil prices. Conversely, weaker-than-expected CPI data could support oil prices by easing concerns about demand destruction.
According to Reuters, Fed officials have emphasized the need for further evidence that inflation is cooling before considering a pause in interest rate hikes. This hawkish stance suggests that the Fed is likely to remain data-dependent, making the upcoming CPI data all the more crucial. In addition to the CPI data, traders should also monitor developments in the Middle East, as escalating tensions could disrupt global oil supply chains and drive prices higher. As reported by Bloomberg, geopolitical risks remain a significant factor in the oil market, with potential for sudden and sharp price swings.
On Wednesday, March 11, several high-impact economic events were scheduled, including [EUR] and [USD] events. However, the actual values are yet to be released, so their impact on the market remains uncertain. On Friday, March 13, [GBP] and multiple [USD] events were also scheduled, adding to the potential volatility in the market. Investors are keenly awaiting these data releases to gauge the future direction of the market.
Bullish Scenario
The bullish scenario hinges on WTI breaking above the $99.25 resistance level. Sustained trading above this level could trigger a rally towards $102.3, with further upside potential towards $107.56. This scenario is supported by the ongoing geopolitical tensions in the Middle East, as well as the potential for increased demand from China as its economy continues to recover. If WTI can maintain its bullish momentum, the $100 mark could soon be within reach. The 1-hour, 4-hour, and daily charts all point to a strong upward trend, suggesting that the path of least resistance is to the upside. However, traders should remain vigilant and monitor the RSI for signs of overbought conditions, which could signal a potential pullback.
Bearish Scenario
The bearish scenario would unfold if WTI fails to break above the $99.25 resistance and instead experiences a sustained pullback. A break below the $97.31 support level could trigger a deeper correction towards $92.95, with further downside potential towards $90.72. This scenario could be driven by weaker-than-expected economic data, a de-escalation of geopolitical tensions, or a surprise increase in oil production from OPEC+. If WTI loses its bullish momentum, the $90 mark could be tested. The daily chart reveals that a break below the $97.31 support would invalidate the current uptrend, potentially leading to a period of consolidation or even a reversal.
Trade Plan
Considering the technical picture and the prevailing market sentiment, a cautious approach is warranted. While the bullish momentum remains strong, the overbought conditions indicated by the RSI suggest that a pullback could be imminent. Therefore, traders should await confirmation before initiating new long positions. A break above the $99.25 resistance would provide a clear signal to enter long, with potential targets at $102.3 and $107.56. A stop-loss order should be placed below the $97.31 support to protect against potential downside risk.
A break above $99.25 targets $102.3, then $107.56. Sustained momentum and supportive news flow needed.
Failure to hold $97.31 support triggers pullback to $92.95, then $90.72. Watch for negative data.
Risk Warning
Traders should be aware of the upcoming CPI data release, which could trigger significant volatility in the oil market. It is essential to manage risk appropriately and use stop-loss orders to protect against potential losses. The market sentiment remains bullish, but the overbought conditions suggest that a pullback is possible. Therefore, caution is warranted.
Technical Summary
Technical Outlook Summary
| Indicator | Value | Signal |
|---|---|---|
| RSI (14) | 82.87 | Overbought |
| MACD Histogram | Positive | Bullish |
| Stochastic | 51.72/58.99 | Neutral |
| ADX | 49.88 | Strong Trend |
| Bollinger | Upper Band | Watch |
Key Levels
Support Levels
Resistance Levels
Frequently Asked Questions: WTI Analysis
What happens if WTI breaks above $99.25 resistance?
A break above the $99.25 resistance could signal a continuation of the uptrend, with potential targets at $102.3 and $107.56. Traders should watch for increased buying volume and sustained trading above this level to confirm the breakout.
Should I buy WTI at current levels of $99.18 given RSI at 82.87?
Given the overbought conditions indicated by the RSI at 82.87, caution is warranted before initiating new long positions. Traders should await a pullback or consolidation before entering long to avoid potential downside risk.
Is RSI at 82.87 a sell signal for WTI right now?
While an RSI of 82.87 indicates overbought conditions, it is not necessarily a sell signal on its own. Traders should look for additional confirmation, such as a break below a key support level or a bearish divergence on the MACD histogram, before initiating short positions.
How will the CPI data affect WTI this week?
Stronger-than-expected CPI data could fuel expectations of further monetary tightening by the Federal Reserve, potentially putting downward pressure on oil prices. Conversely, weaker-than-expected CPI data could support oil prices by easing concerns about demand destruction.
Track markets in real-time
AI-powered analysis, technical indicators and real-time price data.
Join Our Telegram Channel
Breaking market news, AI analysis and trading signals instantly.
Join Channel