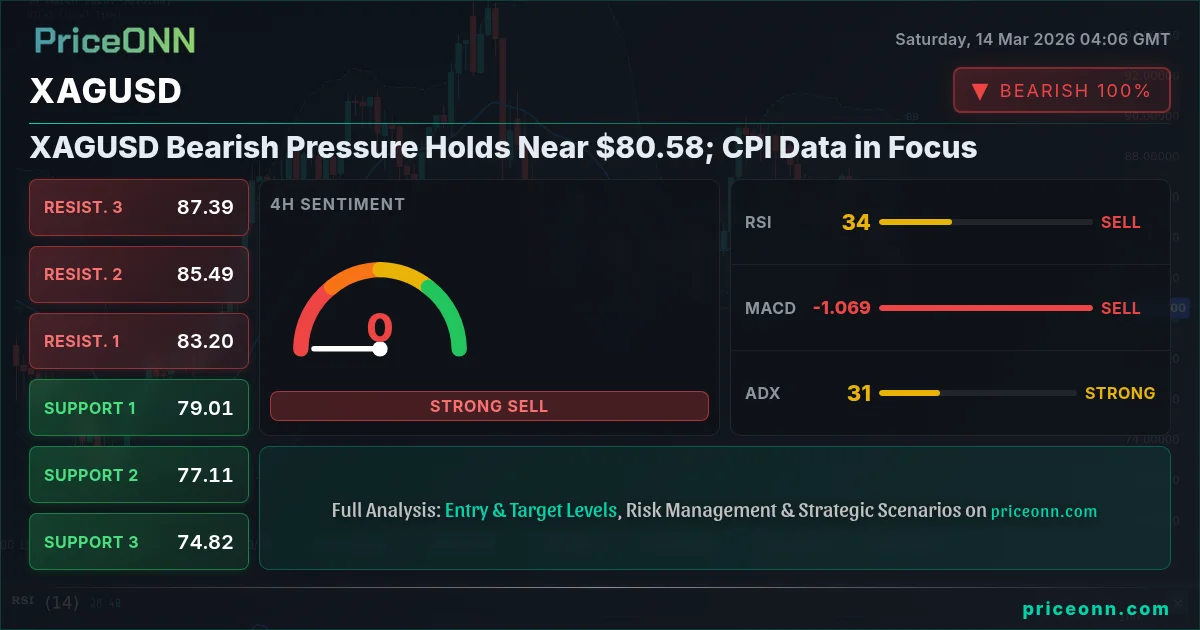
XAGUSD is currently navigating a bearish trend, hovering around $80.58, as the bears and bulls engage in a tug-of-war. Will the bears maintain their grip, or can the bulls stage a comeback? This week's CPI data will be a critical determinant.
- XAGUSD is under pressure near $80.58 due to a strengthening dollar index.
- Key support levels at $80.69 and $80.42 will be critical in the near term.
- Bearish momentum is confirmed by the MACD indicator on the 1H chart.
- Traders should watch the upcoming CPI data for potential shifts in market sentiment.
The recent price action in XAGUSD reflects a broader market sentiment influenced by a strengthening US Dollar Index (DXY), which currently stands at 100.2. As the DXY rises, it typically exerts downward pressure on precious metals like silver. The inverse correlation between the dollar and silver is a key factor traders are monitoring. The news regarding the dollar eyeing a 10-month high, trading above 100, fueled by escalating tensions in the Middle East, puts additional pressure on XAGUSD.
The Bull Case for XAGUSD
Despite the prevailing bearish trend, there are arguments to be made for a potential bullish reversal in XAGUSD. First, the Relative Strength Index (RSI) on the 1H timeframe sits at 33.11, edging towards oversold territory. An oversold RSI can often signal a potential buying opportunity as the asset may be undervalued. Furthermore, the Stochastic oscillator on the 1H chart shows a bullish signal, with %K at 28.08 and %D at 24.91, indicating a possible shift in momentum. This divergence suggests that while the overall trend is down, short-term buying interest might be emerging.
From a fundamental perspective, silver's industrial demand could provide a floor to the price. Silver is widely used in electronics, solar panels, and other industrial applications. Any positive developments in these sectors could boost demand for silver, providing support to XAGUSD. Moreover, geopolitical risks, while currently favoring the dollar, could eventually lead to safe-haven demand for silver if tensions escalate further. The support at $80.69 on the 1H chart is the immediate level to watch for any bullish resurgence.
The Bear Case for XAGUSD
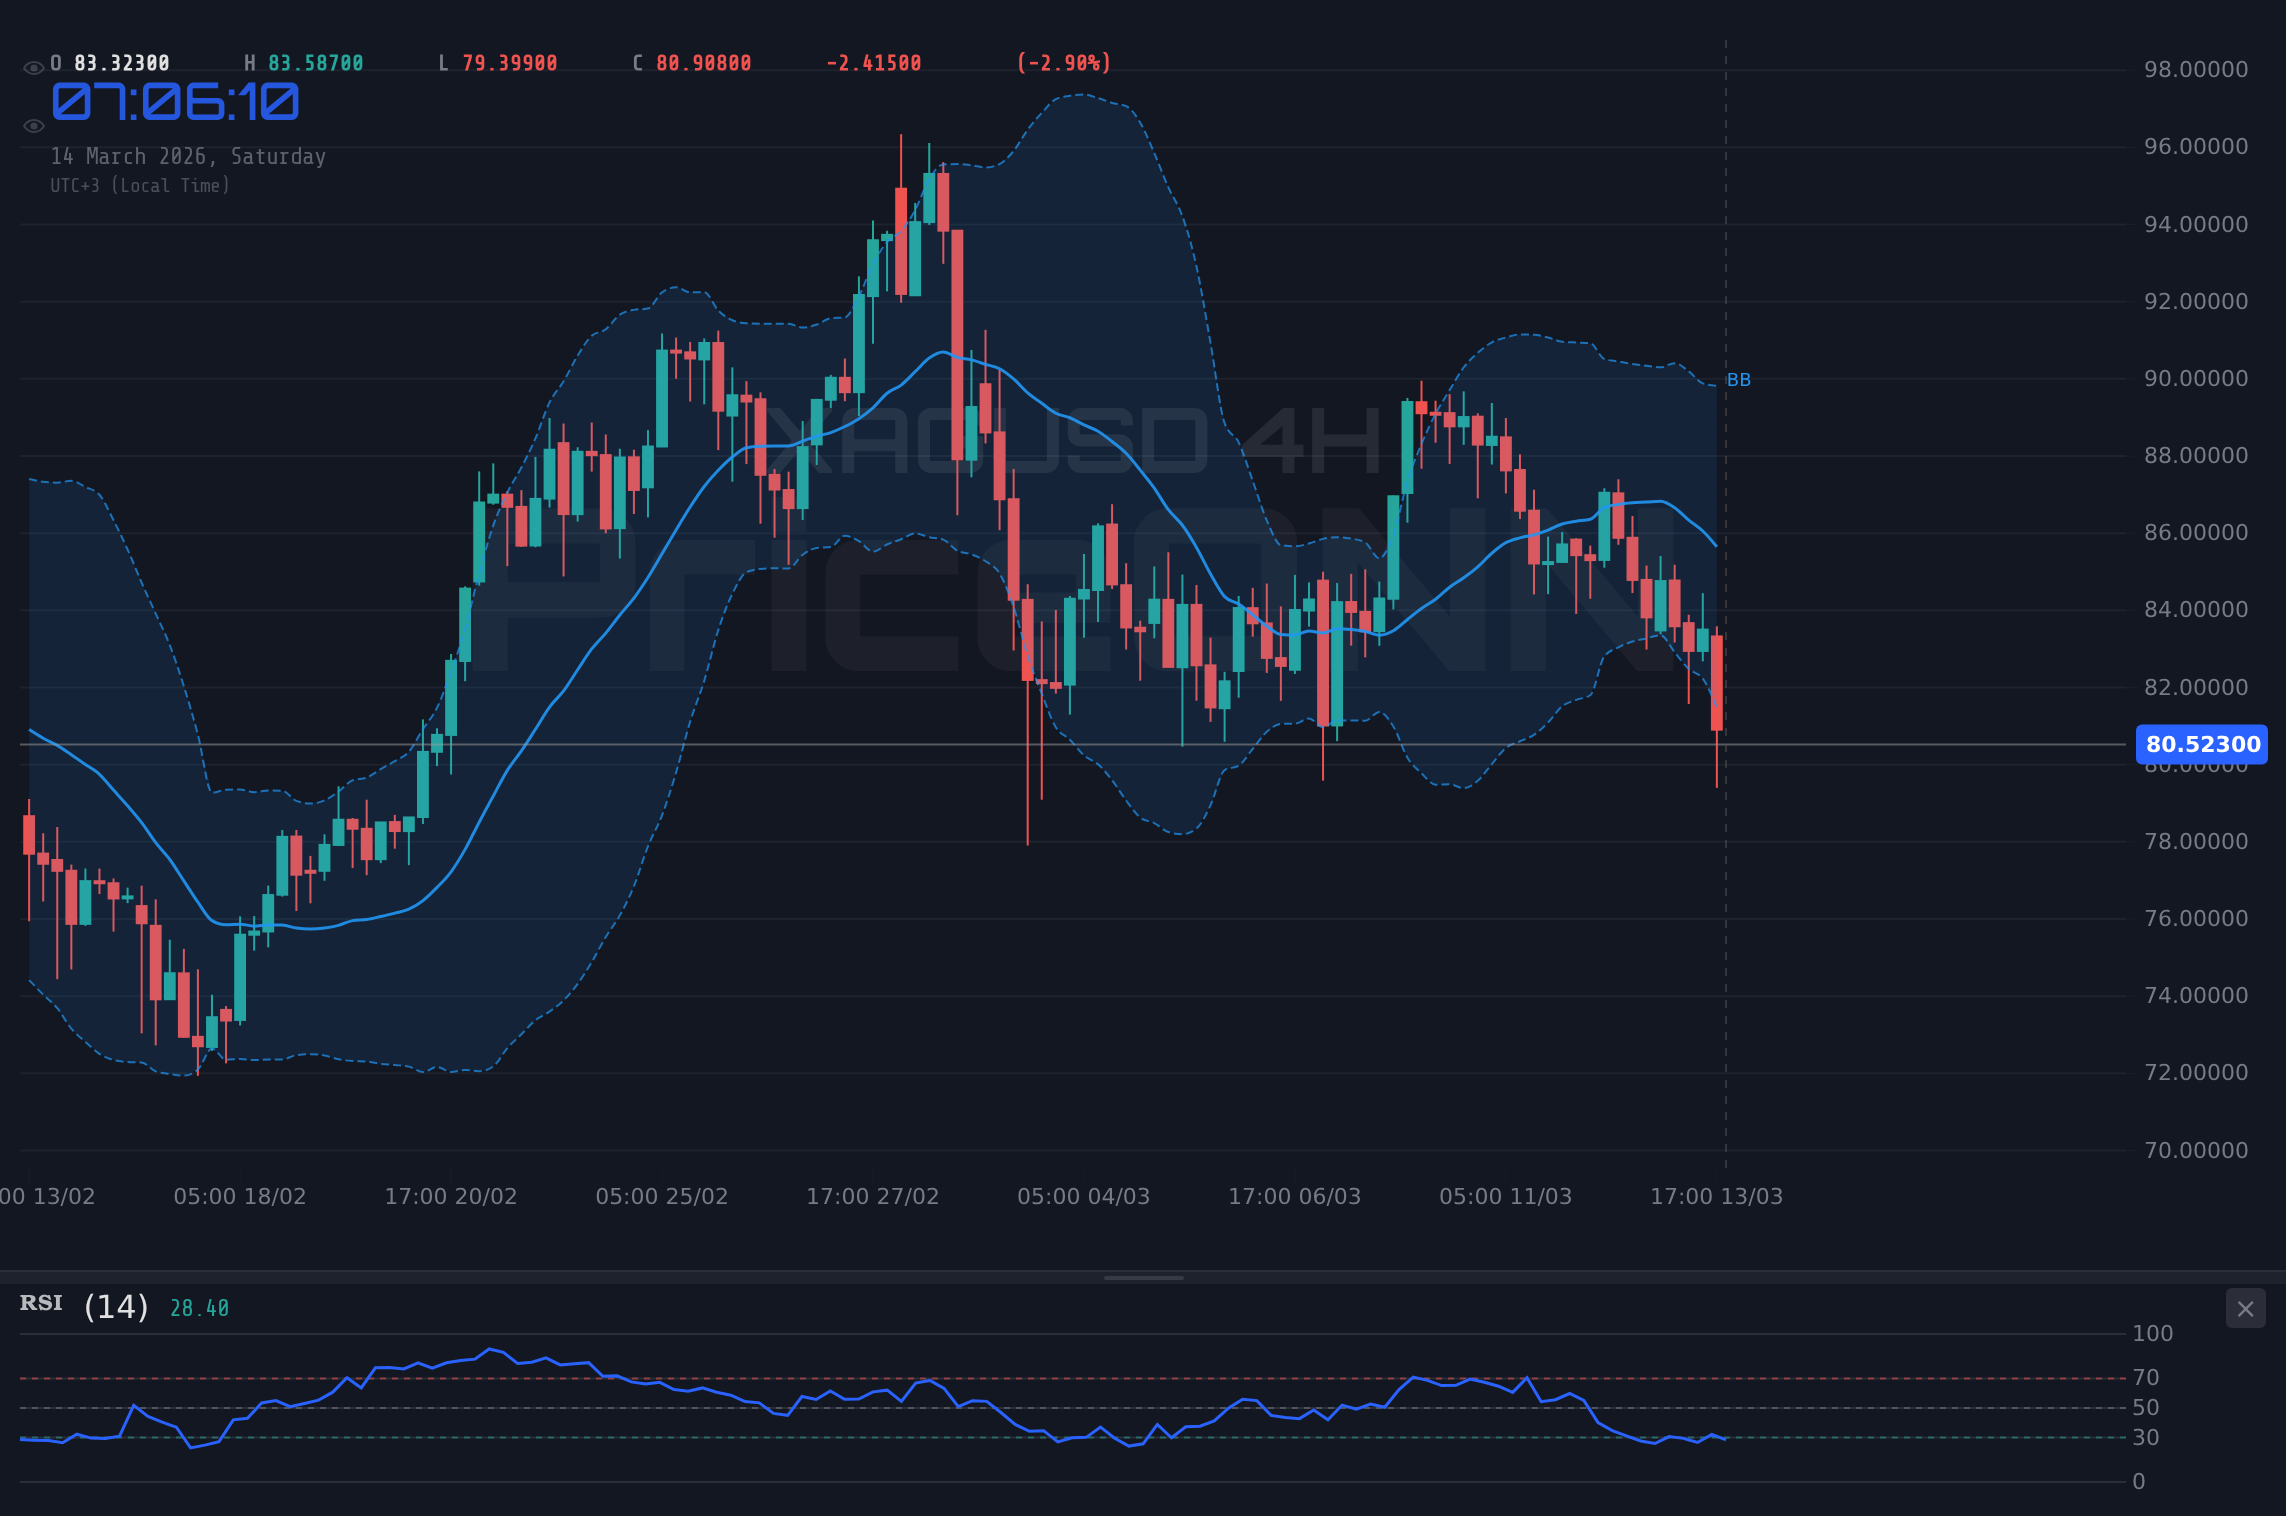
The bearish outlook for XAGUSD is primarily driven by the strong dollar and negative technical indicators. The 1H trend is firmly bearish, with a strength rating of 95%. The Average Directional Index (ADX) on the 1H chart reads 40.31, confirming a strong downtrend. The Moving Average Convergence Divergence (MACD) also indicates negative momentum, with the MACD line below the signal line. These indicators collectively suggest that the bearish trend is likely to persist in the near term.
Looking at the 4H timeframe, the trend is neutral, but the technical indicators still lean bearish. The RSI at 33.84 remains in neutral territory but points downward. The Stochastic oscillator shows a bearish signal (%K at 23.84 and %D at 25.1). On the daily chart, the RSI is at 45.41, and the MACD also shows negative momentum. The news from PriceONN indicates silver sliding below $81 as the US Dollar Index hits a nearly four-month high, reinforcing the bearish narrative.
The high-impact economic data releases are also crucial. The lack of actual data for EUR and USD on March 11th and GBP and USD on March 13th leaves traders guessing about the economic outlook. The market is looking to the upcoming CPI data for clarity on inflation, which could significantly impact the Federal Reserve's monetary policy. A higher-than-expected CPI reading could strengthen the dollar further, exacerbating the downward pressure on XAGUSD.
Technicals as Tiebreaker: XAGUSD at a Crossroads
The technical picture for XAGUSD presents a mixed bag. On the one hand, the 1H chart shows some oversold conditions and a potential bullish divergence in the Stochastic oscillator. On the other hand, the overall trend remains bearish, supported by the ADX and MACD. The key level to watch is the resistance at $81.22 on the 1H chart. A break above this level could signal a potential shift in momentum, while failure to overcome this resistance would reinforce the bearish outlook.
Analyzing the weekly chart, it is evident that XAGUSD has been in a downtrend since the beginning of the year. The price has consistently made lower highs and lower lows, confirming the bearish trend. The support level at $80.69 is critical, as a break below this level could lead to further downside towards $80.42 and $80.17. Conversely, if the price can hold above $80.69 and break above $81.22, it could target the next resistance level at $81.48 and $81.75.
The current silver price XAG/USD is $80.58, and the forexprostr gümüş data shows a weak trend. It is important to monitor the current silver price XAG USD and the current silver price XAGUSD live. The current silver price xag/usd march 2 2026 and current silver price xagusd march 2 2026 are also important historical data to monitor. The current silver price xag usd march 2 2026 and the current silver price xagusd live march 2 2026 are also important data points.
Trade Plan: Short Opportunity on XAGUSD
Given the strong bearish trend, a short opportunity presents itself for XAGUSD. The ADX at 29.13 indicates a strong trend, while the RSI and MACD histogram align to confirm the directional signal. The Stochastic oscillator is in a tradeable zone, providing a clear entry signal.
Enter a short position if XAGUSD fails to break above $81.22. Target the support levels at $80.69 and $80.42. A break below $80.42 could trigger further downside towards $80.17. This scenario carries a 65% probability.
If XAGUSD breaks above $81.22, consider a long position targeting $81.48 and $81.75. However, this scenario is less likely given the overall bearish trend. This scenario carries a 35% probability.
The upcoming CPI data poses a risk to this trade. A surprise increase in inflation could strengthen the dollar and exacerbate the downward pressure on XAGUSD. Traders should exercise caution and manage their risk accordingly.
Verdict: Bearish Outlook for XAGUSD
Based on the technical and fundamental analysis, the outlook for XAGUSD remains bearish. The strong dollar, negative technical indicators, and lack of positive catalysts suggest that the downward pressure is likely to persist in the near term. Traders should focus on short opportunities and monitor the key support levels for potential downside targets. However, it's essential to remain vigilant and adjust the trading strategy based on the upcoming CPI data and any shifts in market sentiment.
Frequently Asked Questions: XAGUSD Analysis
What happens if XAGUSD breaks below $80.69?
If XAGUSD breaks below the support level of $80.69, we could see a further decline toward the next support levels at $80.42 and $80.17, as the bearish momentum strengthens.
Should I short XAGUSD at current levels of $80.58 given ADX at 29.13?
Given the ADX at 29.13 indicating a strong trend, shorting at current levels around $80.58 could be a reasonable strategy, targeting $80.42 and $80.17, as long as you set a stop-loss above $81.22 to manage risk.
Is RSI at 33.11 a buy signal for XAGUSD right now?
While RSI at 33.11 indicates oversold conditions, it's not a standalone buy signal. The overall trend is bearish, and other indicators support further downside. A potential buy signal would require a break above $81.22 and confirmation from other indicators.
How will the upcoming CPI data affect XAGUSD this week?
The upcoming CPI data is a critical catalyst. Higher-than-expected inflation could strengthen the dollar, putting further downward pressure on XAGUSD. Conversely, lower-than-expected inflation could weaken the dollar and provide some relief to XAGUSD.
Key Levels
Support Levels
Resistance Levels
Technical Outlook Summary
| Indicator | Value | Signal |
|---|---|---|
| RSI (14) | 33.11 | Neutral |
| MACD Histogram | Negative | Bearish |
| Stochastic | K=28.08, D=24.91 | Bullish |
| ADX | 40.31 | Strong Trend |
| Bollinger | Mid Band | Bearish |
Track markets in real-time
AI-powered analysis, technical indicators and real-time price data.
Join Our Telegram Channel
Breaking market news, AI analysis and trading signals instantly.
Join Channel