

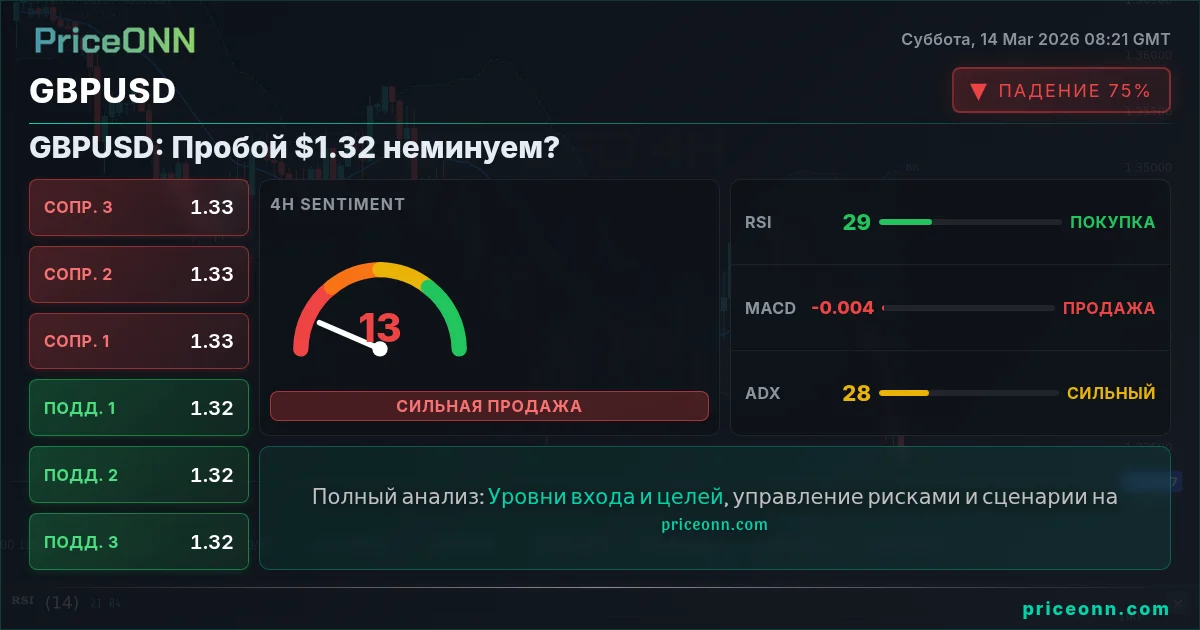
GBPUSD в настоящее время торгуется около $1.32, сталкиваясь со значительными препятствиями после медвежьего разворота на этой неделе. Пара изо всех сил пытается удержаться на фоне укрепления доллара США и эскалации геополитической напряженности на Ближнем Востоке. Вопрос сейчас в том, смогут ли медведи закрепить свой контроль, толкая пару вниз, или покупатели смогут найти точку опоры для восстановления. Многие трейдеры сегодня ищут анализ фунт доллар сегодня, чтобы понять текущую ситуацию.
- RSI на уровне 25.27 на 1H графике сигнализирует о перепроданности, предполагая потенциальный краткосрочный отскок.
- Ключевая поддержка находится на уровне 1.32202, прорыв ниже которого может спровоцировать дальнейший нисходящий импульс.
- ADX на уровне 44.45 указывает на сильный нисходящий тренд на 1H таймфрейме, благоприятствующий продавцам.
- Укрепление доллара и напряженность на Ближнем Востоке являются ключевыми факторами, влияющими на корреляцию GBPUSD с DXY и ценами на нефть.
Британский фунт столкнулся с проблемами по отношению к доллару США, при этом GBPUSD испытала дневное изменение в -0.88%, достигнув $1.32218. Это движение отражает более широкую тенденцию укрепления доллара, поскольку индекс доллара (DXY) поднялся до 100.2, показав дневной прирост в 0.8%. По данным Reuters, представители ФРС подчеркнули, что инфляция остается «упорной», что может привести к более ястребиной денежно-кредитной политике и дальнейшему укреплению доллара.
С технической точки зрения, GBPUSD демонстрирует сильный медвежий тренд, особенно на более коротких таймфреймах. На 1H графике ADX находится на уровне 44.45, подтверждая силу нисходящего тренда. RSI находится на уровне 25.27, указывая на условия перепроданности, что может привести к краткосрочному отскоку или консолидации. Однако MACD остается в отрицательной зоне, предполагая, что медвежий импульс все еще в игре. Индикатор Stochastic, с K на уровне 17.34 и D на уровне 19.99, также указывает на условия перепроданности, что еще больше поддерживает возможность коррекции в ближайшем будущем.
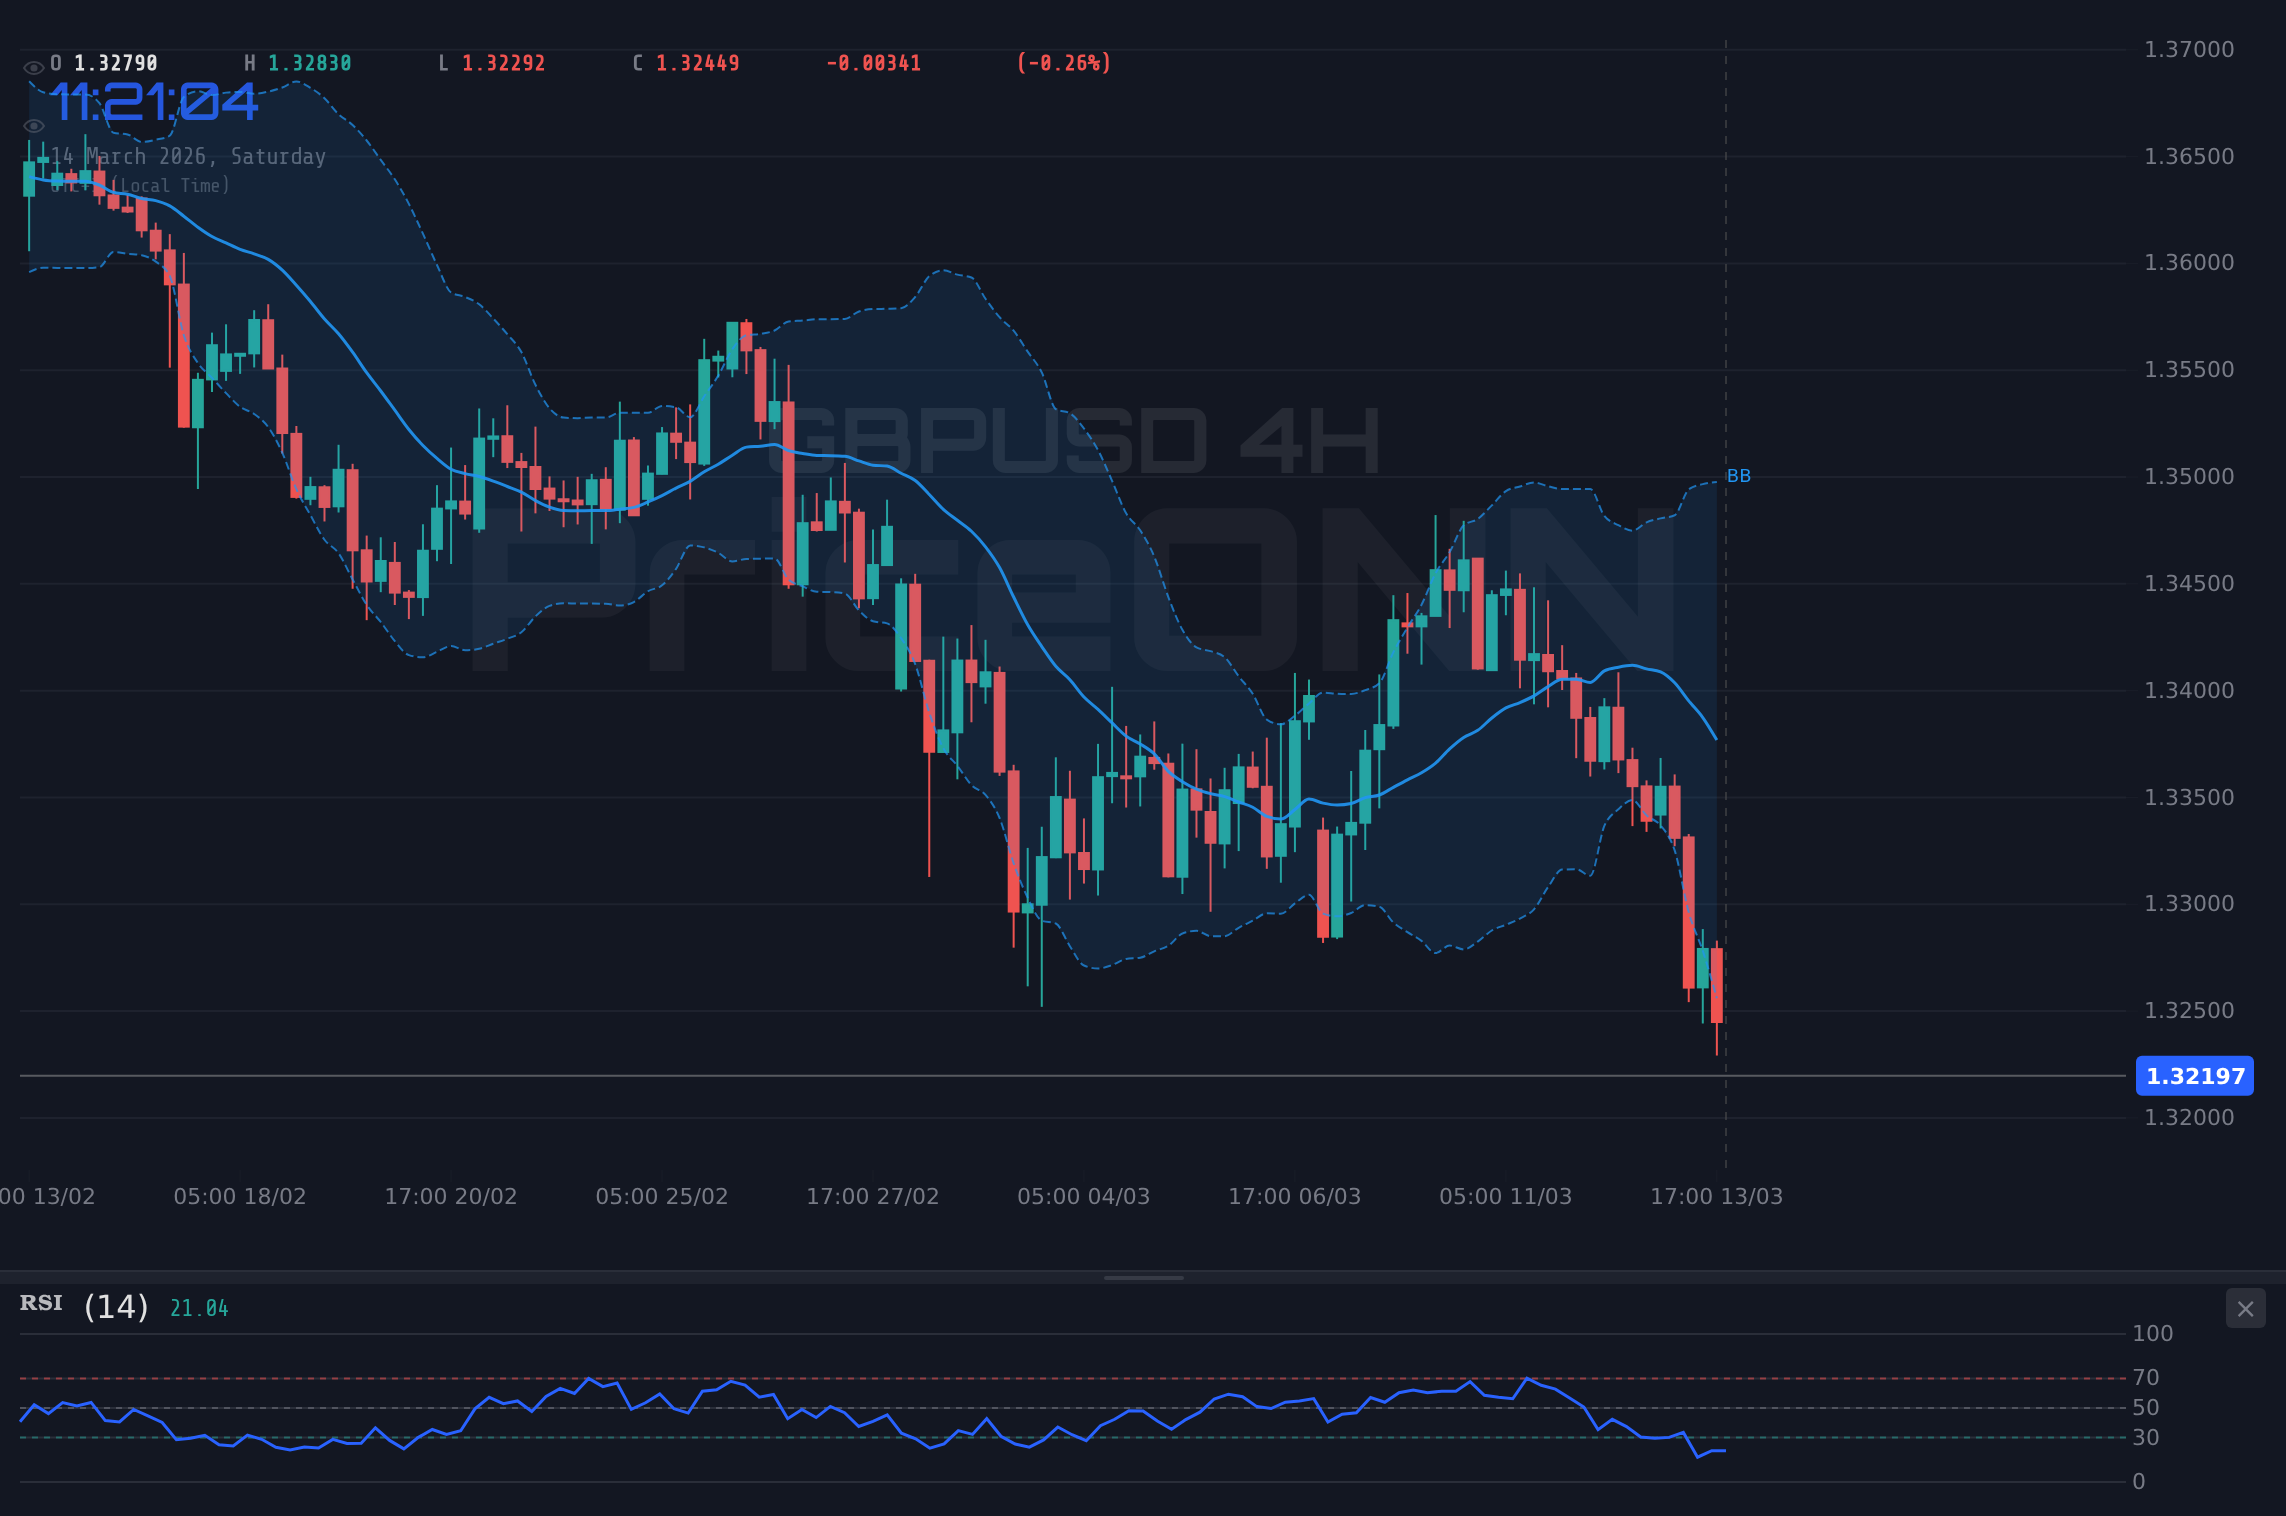
Глядя на 4H таймфрейм, техническая картина остается медвежьей, хотя есть признаки формирования потенциальной поддержки. RSI находится на уровне 31.77, все еще в нейтральной зоне, но имеет тенденцию к снижению. Гистограмма MACD отрицательная, что указывает на продолжающееся давление продаж. Однако индикатор Stochastic глубоко перепродан, с K на уровне 11.46 и D на уровне 10.49, что предполагает, что рынок может быть готов к развороту. Ключевой уровень поддержки, за которым следует следить на 4H графике, составляет 1.32264. Прорыв ниже этого уровня может привести к дальнейшему снижению к 1.32085.
На дневном таймфрейме нисходящий тренд также очевиден, с RSI на уровне 30.58 и ADX на уровне 29.2. MACD остается отрицательным, и индикатор Stochastic имеет тенденцию к снижению. Ключевой уровень поддержки, за которым следует следить на дневном графике, составляет 1.32858. Прорыв ниже этого уровня может открыть дверь для движения к 1.32378. Сопротивление наблюдается на уровне 1.33872, и прорыв выше этого уровня потребуется для нивелирования медвежьего прогноза.
Текущие настроения рынка по отношению к GBPUSD в основном медвежьи, что обусловлено силой доллара США и геополитической неопределенностью. Как сообщает Bloomberg, эскалация напряженности на Ближнем Востоке нарушает глобальные поставки нефти, что вызывает опасения по поводу инфляции и неприятия риска. Это подпитывает спрос на активы-убежища, включая доллар США, оказывая понижательное давление на GBPUSD. Инвесторы будут внимательно следить за предстоящим событием с высоким уровнем воздействия в экономическом календаре.
С точки зрения кросс-рынка, рост цен на нефть способствует инфляционному давлению, что может побудить Федеральную резервную систему сохранить свою ястребиную позицию. Это ожидание поддерживает доллар, что отражается в движении DXY выше 100.00. SP500 снизился на -0.81%, торгуясь около 6625.3, что отражает неприятие риска на рынке. Это неприятие риска еще больше поддерживает доллар, усиливая медвежье давление на GBPUSD.
Учитывая текущий технический и фундаментальный фон, общий прогноз для GBPUSD является медвежьим. Сильный доллар, геополитическая напряженность и отрицательные технические индикаторы указывают на дальнейший потенциал снижения. Однако условия перепроданности на более коротких таймфреймах предполагают, что возможен краткосрочный отскок или консолидация. Трейдерам следует внимательно следить за ключевыми уровнями поддержки и сопротивления, указанными выше, и быть готовыми к потенциальной волатильности.
Почему $1.32202 - линия водораздела
Уровень $1.32202 действует как критический момент для GBPUSD, особенно на 1-часовом таймфрейме. Этот уровень представляет собой немедленную поддержку, и решительный прорыв ниже него может спровоцировать каскад давления продаж. Общий сигнал «SAT» (Продавать) на нескольких таймфреймах усиливает медвежий уклон. Осцилляция RSI на уровне 25.27 еще больше намекает на условия перепроданности, но такие случаи распространены во время сильных нисходящих трендов, предполагая, что пара может продолжить свою нисходящую траекторию до любого потенциального разворота.
Отрицательный импульс дополнительно подтверждается индикатором MACD, который торгуется ниже своей сигнальной линии, указывая на устойчивое медвежье давление. Полосы Боллинджера показывают, что цена в настоящее время торгуется ниже средней полосы, что обычно является признаком медвежьего импульса. ADX на уровне 44.45 подтверждает наличие сильного тренда, что делает любые сделки против тренда рискованными. Схождение этих индикаторов вокруг уровня $1.32202 усиливает его значимость как потенциального триггера для дальнейшего снижения.
Навигация по неспокойным водам: перспектива скальпера
Для скальперов текущая волатильность представляет как возможности, так и риски. 1-часовой таймфрейм показывает четкий нисходящий тренд, что делает короткие позиции более предпочтительными. Ключ в том, чтобы определить точки входа вблизи уровней сопротивления, таких как 1.3249, и установить жесткие ордера стоп-лосс для управления риском. Учитывая условия перепроданности, скальперы должны остерегаться потенциальных краткосрочных отскоков и соответствующим образом корректировать свои стратегии.
Свинг-трейдерам следует сосредоточиться на 4-часовом и дневном таймфреймах, чтобы получить более широкую перспективу. 4-часовой график показывает нейтральный тренд, но RSI на уровне 31.77 указывает на то, что пара приближается к зоне перепроданности. Свинг-трейдеры могут искать потенциальные модели разворота вблизи уровня поддержки 1.32264, но должны дождаться подтверждения, прежде чем открывать длинные позиции. Дневной график подтверждает общий нисходящий тренд, предполагая, что короткие позиции по-прежнему являются предпочтительным вариантом.
Долгосрочным инвесторам следует проявлять осторожность и избегать ловли падающего ножа. Дневной график показывает сильный нисходящий тренд, и RSI все еще находится в нейтральной зоне. Долгосрочным инвесторам следует дождаться появления четкой модели разворота, прежде чем рассматривать длинные позиции. Прорыв выше уровня сопротивления 1.33872 будет положительным знаком, но потребуется дальнейшее подтверждение, прежде чем переходить к долгосрочной бычьей позиции.
Торговый план: оседлать медвежью волну
Учитывая преобладающие медвежьи настроения и технические индикаторы, рекомендуется короткая сделка для GBPUSD, но с тщательным управлением рисками.
GBPUSD пробивает уровень 1.32202, вызывая дальнейший нисходящий импульс к 1.32085, а затем к 1.32000. Нисходящий тренд поддерживается сильным долларом и неприятием риска.
GBPUSD находит поддержку на уровне 1.32202, организуя краткосрочный отскок к 1.3249, а затем к 1.32559. Это вызвано условиями перепроданности и временным откатом в силе доллара.
Точка входа: Подтвержденный прорыв ниже 1.32202 на 1H графике. Цель 1: 1.32085 Цель 2: 1.32000 Стоп/Отмена: Закрытие выше 1.3249 на 1H графике.
На следующей неделе ожидается событие с высоким уровнем воздействия - данные по индексу потребительских цен (CPI), которые могут вызвать значительную волатильность в GBPUSD.
Часто задаваемые вопросы: Анализ GBPUSD
Что произойдет, если GBPUSD пробьет уровень 1.32202?
Прорыв ниже 1.32202 может спровоцировать дальнейший нисходящий импульс, с первоначальными целями на уровне 1.32085, а затем 1.32000. Нисходящий тренд поддерживается сильным долларом и неприятием риска, что делает короткие позиции более предпочтительными.
Стоит ли мне продавать GBPUSD на текущих уровнях 1.32, учитывая RSI на уровне 25.27?
Хотя RSI на уровне 25.27 предполагает условия перепроданности, продажа GBPUSD по-прежнему является жизнеспособным вариантом, учитывая общий медвежий тренд. Однако трейдерам следует остерегаться потенциальных краткосрочных отскоков и устанавливать жесткие ордера стоп-лосс для управления риском.
Что говорит сигнал MACD о тренде GBPUSD?
Отрицательная гистограмма MACD указывает на продолжающееся давление продаж, подтверждая нисходящий тренд. MACD торгуется ниже своей сигнальной линии, что еще больше усиливает медвежий уклон. Это предполагает, что короткие позиции по-прежнему являются предпочтительным вариантом.
Как данные по индексу потребительских цен (CPI) на следующей неделе повлияют на GBPUSD?
Ожидается, что данные по индексу потребительских цен (CPI) на следующей неделе вызовут значительную волатильность в GBPUSD. Более высокое, чем ожидалось, значение CPI может привести к дальнейшему укреплению доллара, оказывая понижательное давление на GBPUSD. И наоборот, более низкое, чем ожидалось, значение может спровоцировать краткосрочный отскок в GBPUSD.
Сводка технического анализа
| Индикатор | Значение | Сигнал |
|---|---|---|
| RSI (14) | 25.27 | Перепроданность |
| Гистограмма MACD | Отрицательная | Медвежий |
| Stochastic | 17.34/19.99 | Перепроданность |
| ADX | 44.45 | Сильный тренд |
| Bollinger | Средняя полоса | Ниже |
Ключевые уровни
Уровни поддержки
Уровни сопротивления
Отслеживайте рынки в реальном времени
ИИ-анализ и данные в реальном времени.