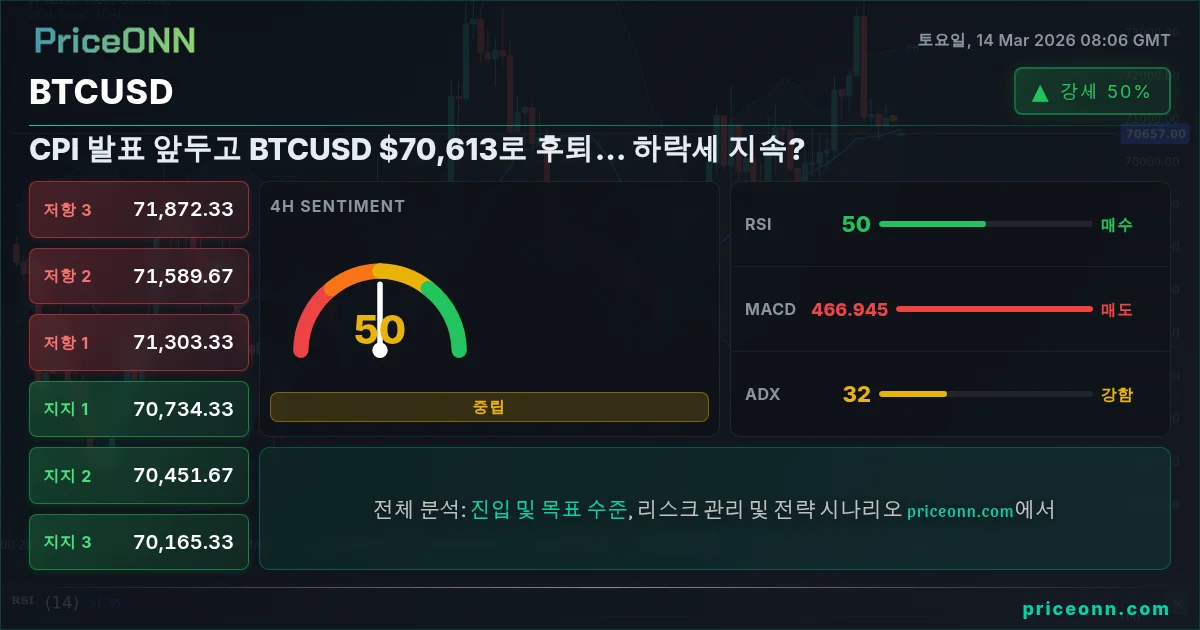
BTCUSD Insight Card

Bitcoin is taking a breather, with BTCUSD currently trading at $70,613. Last Friday's close reflects a market grappling with dollar strength and risk-off sentiment as traders await key economic data. Is this a temporary pullback or the start of a deeper correction? Let’s dive in.

⚡ Key Takeaways
  • RSI at 42.4 on the 1H chart signals further downside potential in the short term.
  • Critical support sits at $70,295, a break below which could trigger a sharper selloff.
  • MACD histogram confirms negative momentum, indicating bearish sentiment is intensifying.
  • Upcoming CPI data could be a major catalyst, influencing BTCUSD correlation with the DXY.

Having tracked BTCUSD through multiple market cycles, the current setup presents a classic wait-and-see scenario. The high correlation with traditional markets, particularly the Nasdaq, suggests that Bitcoin is no longer viewed as a purely independent asset. This means that macroeconomic factors, such as inflation and interest rate expectations, play an increasingly significant role in dictating its price action.

Last week's key events painted a mixed picture for the crypto market. On one hand, Bitcoin miners are adapting to the AI power crunch, signaling long-term resilience. On the other hand, as noted in recent PriceONN analysis, Bitcoin is facing headwinds and may lack the strength to sustain its recent highs. The Chinese fraud victims challenging the UK redress plan for seized Bitcoin adds another layer of complexity, underscoring the regulatory risks that continue to loom over the crypto space.

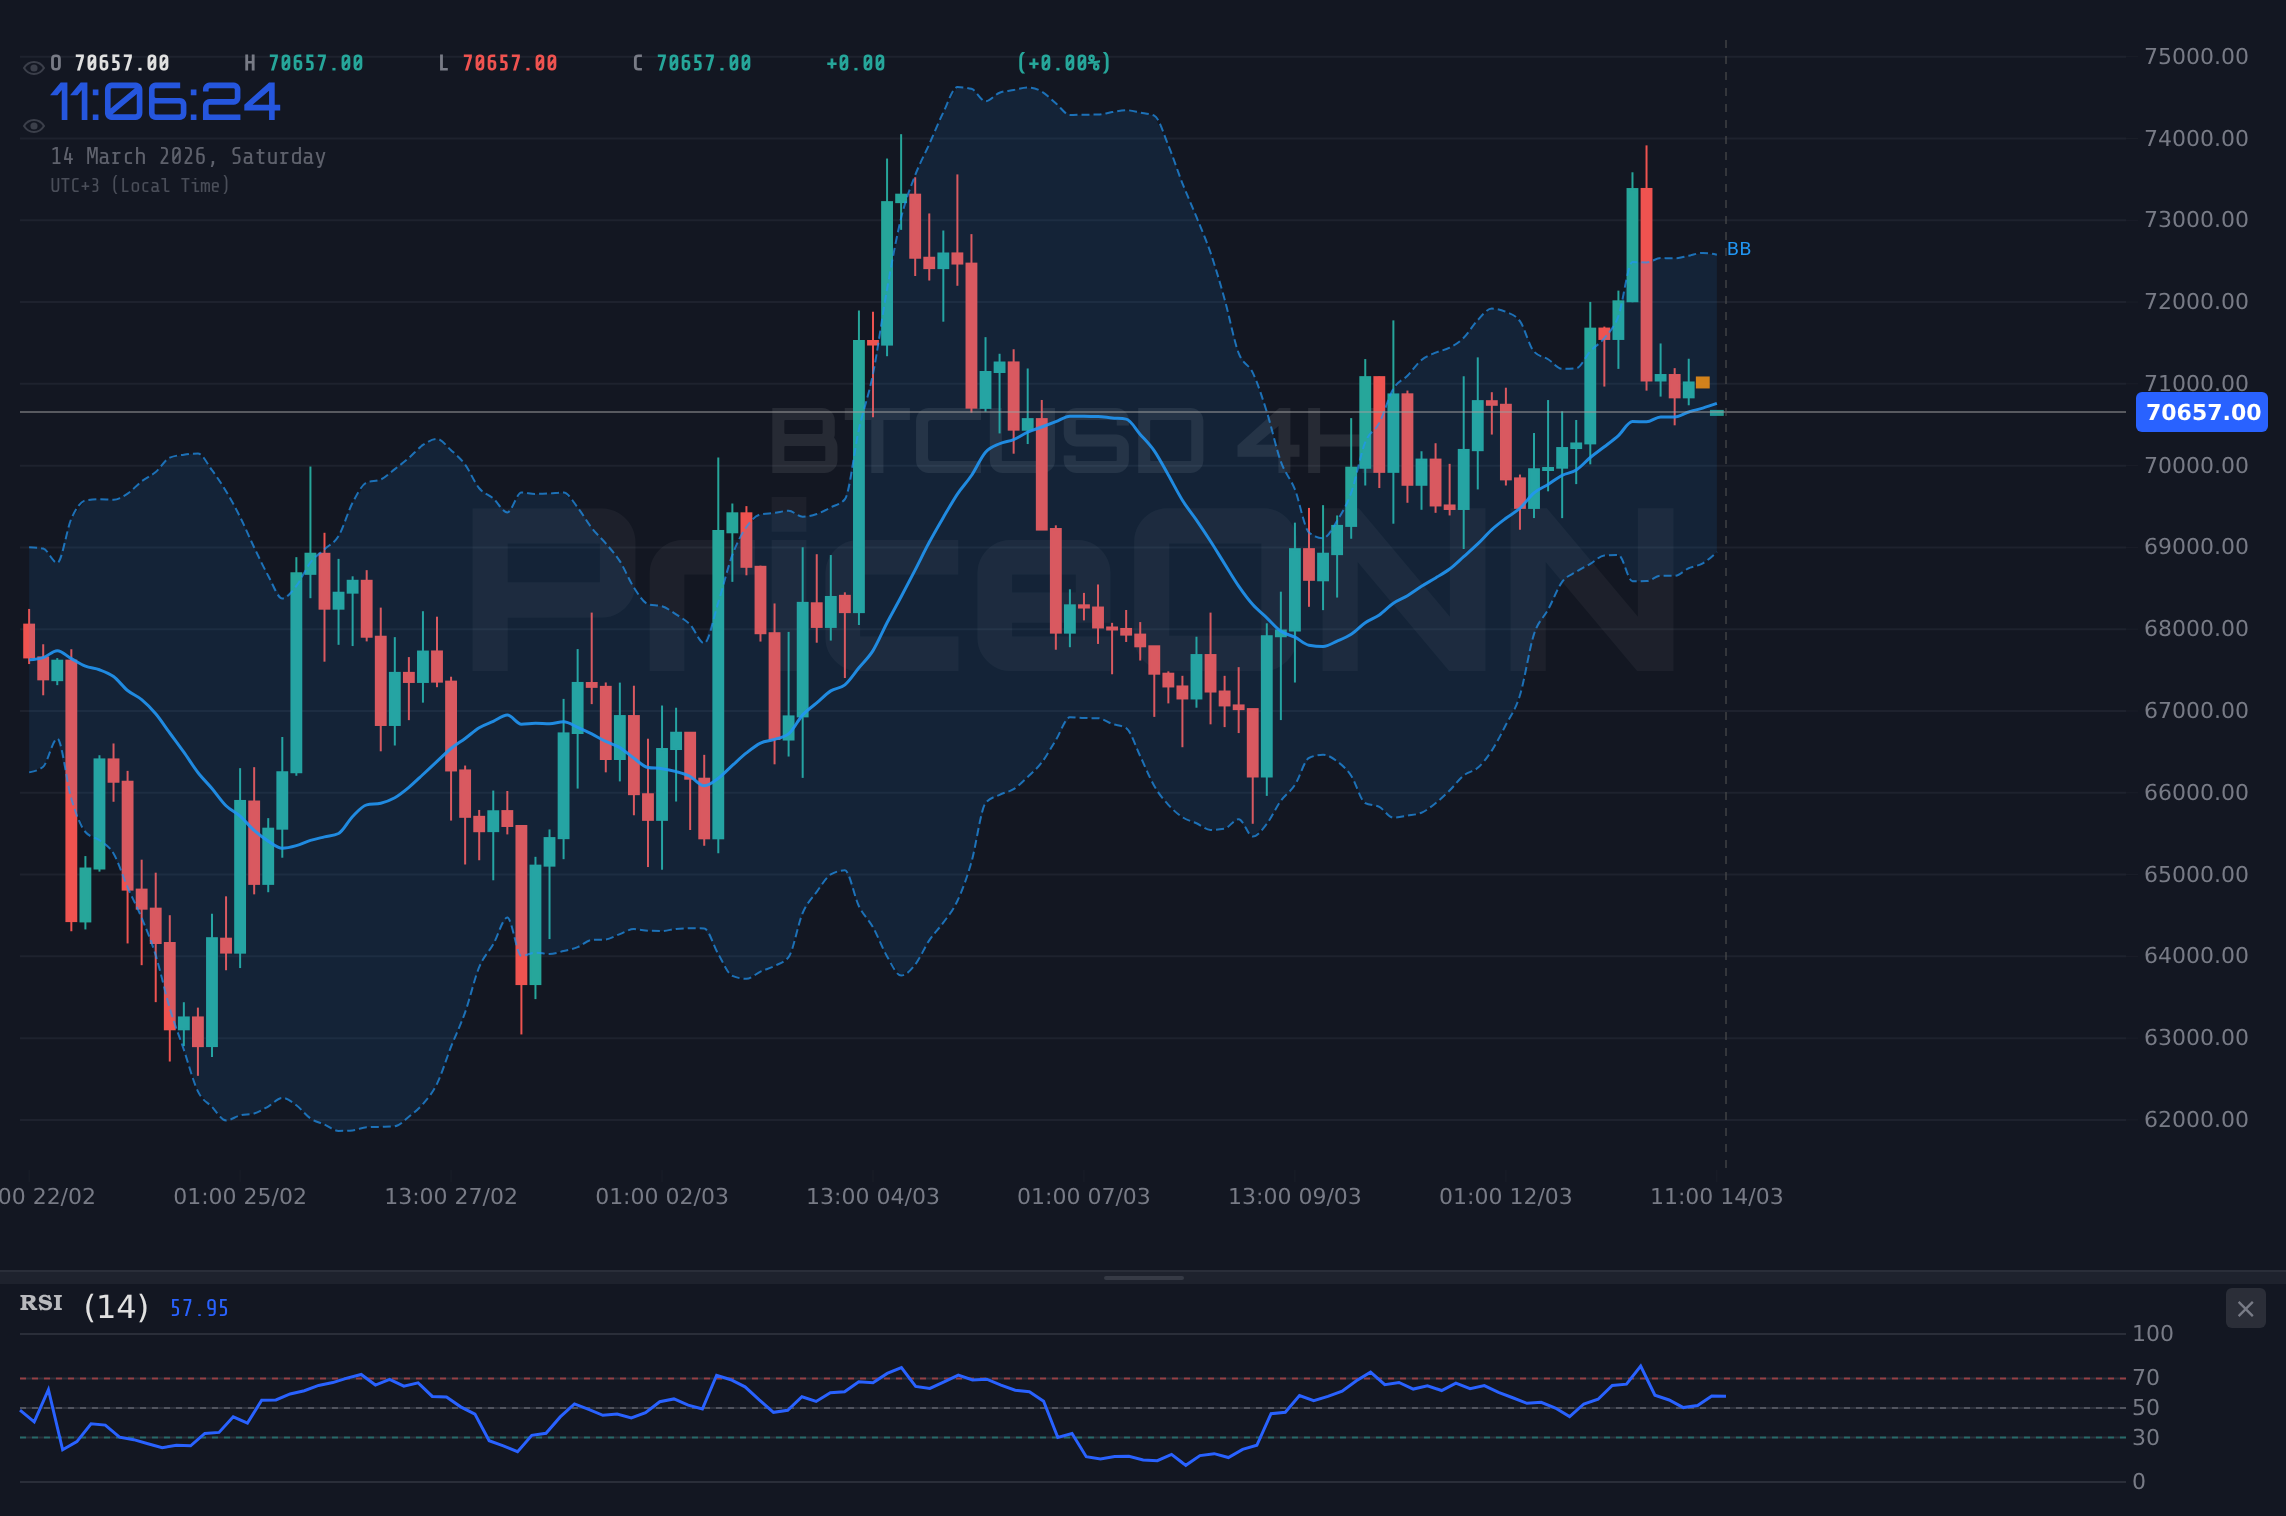
BTCUSD 4H Chart - BTCUSD Retreats to $70,613 as CPI Data Looms; Bearish Hold?
BTCUSD 4H Chart

Technical Analysis: Key Levels and Indicators

From a technical perspective, BTCUSD is at a crucial juncture. The hourly chart shows a clear downtrend, with the price struggling to break above the 20-period moving average. The Relative Strength Index (RSI) at 42.4 suggests that there is still room for further downside before the asset becomes oversold. The Moving Average Convergence Divergence (MACD) histogram confirms the negative momentum, with the signal line well below the zero level.

The 4-hour timeframe provides a slightly more nuanced view. While the overall trend is still technically bullish, the RSI at 51.15 indicates that the buying pressure is waning. The MACD histogram is also showing signs of divergence, suggesting that the bullish momentum is fading. Key support to watch is the 70,488 level. A break below this could open the door for a test of the 70,141 level.

On the daily chart, BTCUSD remains in a relatively strong position. The RSI at 51.78 is neutral, indicating that the asset is neither overbought nor oversold. The MACD is still positive, but the histogram is starting to narrow, suggesting that the bullish momentum is slowing. Key resistance to watch is the 73,344 level. A break above this could pave the way for a retest of the all-time highs.

Fundamental Drivers: Macro Factors and Geopolitics

The fundamental drivers behind BTCUSD are multifaceted. The strength of the U.S. dollar, as reflected in the DXY, is putting downward pressure on Bitcoin. With the DXY currently at 100.2 and showing a strong upward trend on the daily chart, the inverse correlation between the dollar and Bitcoin is likely to persist. This means that any further gains in the dollar could translate into further losses for Bitcoin.

Inflation expectations are also playing a key role. Rising energy prices, driven by escalating tensions in the Middle East, are fueling concerns about a resurgence in inflation. According to recent news reports, crude oil is nearing $100 per barrel as geopolitical tensions continue to disrupt supply routes. This could lead to a more hawkish stance from the Federal Reserve, which would further strengthen the dollar and weigh on Bitcoin.

Geopolitical risks are also contributing to the risk-off sentiment in the market. The ongoing conflict in the Middle East is creating uncertainty and volatility, prompting investors to seek safe-haven assets. While Bitcoin is sometimes viewed as a safe haven, it has not performed particularly well in recent periods of geopolitical stress. This suggests that investors are still more likely to flock to traditional safe havens like gold and the U.S. dollar.

What This Means for Traders Right Now

For short-term traders, the current setup presents both risks and opportunities. The hourly chart suggests that there is potential for further downside, but the oversold conditions on the RSI could also lead to a short-term bounce. Traders should be cautious about chasing the downside, as the market could easily reverse course if the dollar weakens or risk appetite improves.

Swing traders should focus on the 4-hour and daily charts. The key levels to watch are the 70,488 support and the 73,344 resistance. A break below the support could signal a deeper correction, while a break above the resistance could pave the way for a retest of the all-time highs. Traders should also pay close attention to the MACD histogram, as any signs of divergence could provide valuable clues about the future direction of the market.

Long-term investors should remain patient and disciplined. The fundamental outlook for Bitcoin remains positive, but the short-term volatility could be unnerving. Investors should focus on accumulating Bitcoin at attractive levels, rather than trying to time the market. The long-term trend is still up, and any pullbacks should be viewed as buying opportunities.

Trade Plan: Potential Short Setup

Given the bearish technical signals and the strength of the U.S. dollar, a potential short setup could be considered. However, it's crucial to manage risk carefully and wait for confirmation before entering a trade.

Bearish Scenario (60% Probability)

BTCUSD breaks below the 70,295 support, triggering a selloff towards 69,444 and potentially 67,780. This scenario is driven by continued dollar strength and risk-off sentiment.

Trigger: Close below 70,295
Bullish Scenario (40% Probability)

BTCUSD holds above 70,295 and breaks above the 71,187 resistance, paving the way for a retest of 73,344. This scenario requires a weakening dollar and improved risk appetite.

Trigger: Hold above 70,295 and break above 71,187

Entry Trigger: A confirmed break below the 70,295 support level.

Target 1: 69,444

Target 2: 67,780

Stop/Invalidation: A close above 71,187 would invalidate this bearish setup.

Upcoming Economic Data: CPI in Focus

The upcoming CPI data will be a major catalyst for the market. If the data comes in hotter than expected, it could trigger a more hawkish response from the Federal Reserve, which would further strengthen the dollar and weigh on Bitcoin. On the other hand, if the data comes in weaker than expected, it could lead to a weakening dollar and a rally in Bitcoin. Traders should be prepared for significant volatility around the time of the release.

On March 13th, several USD economic data points were released. Traders should analyze these recent releases to anticipate the potential impact of future data.

Frequently Asked Questions: BTCUSD Analysis

What happens if BTCUSD breaks below $70,295 support?

A break below the $70,295 support level could trigger a sharper selloff towards $69,444 and potentially $67,780. This would confirm the bearish scenario outlined above.

Should I buy BTCUSD at current levels of $70,613 given RSI at 42.4?

Given the RSI reading of 42.4 on the 1H chart, it's premature to buy BTCUSD at current levels. Waiting for a more oversold condition or a break above resistance would be prudent.

Is the MACD signal a reliable indicator for BTCUSD trend analysis?

The MACD is a valuable tool, but it should be used in conjunction with other indicators. The current negative momentum on the MACD confirms the bearish sentiment, but it's not a definitive sell signal.

How will the upcoming CPI data affect BTCUSD this week?

The upcoming CPI data will be a major catalyst. Stronger-than-expected data could lead to a more hawkish Fed, strengthening the dollar and weighing on BTCUSD. Weaker-than-expected data could weaken the dollar and trigger a rally in BTCUSD.

Ultimately, the key to navigating the current market environment is to remain flexible and adaptable. The market is constantly evolving, and traders must be prepared to adjust their strategies accordingly. Patience looks like it will be rewarded here.

💎

Volatility creates opportunity-those prepared will be rewarded.

With disciplined risk management, these choppy waters can be navigated safely.