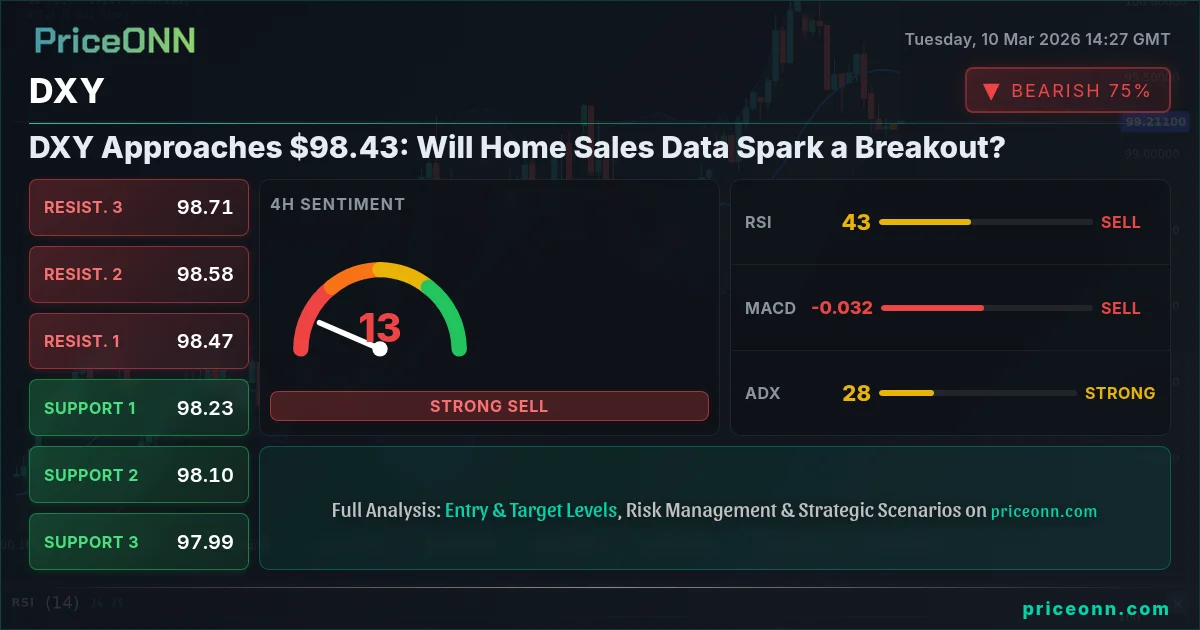
The Dollar Index (DXY) is currently trading near $98.43, a level that has become a key focal point for traders. The index's recent strength is fueled by ongoing geopolitical tensions and anticipation surrounding upcoming US economic data releases, particularly home sales figures. Will the data provide the catalyst for a sustained breakout, or will DXY remain range-bound?
- DXY is trading near a critical level of $98.43, testing resistance.
- RSI at 45.96 on the 1H chart suggests potential for further downside.
- Upcoming US home sales data on Tuesday could trigger a breakout or breakdown.
- A break above 99.02 resistance could signal further gains, while a drop below 98.04 support could lead to further losses.
The Bull's Roadmap: A Break Above 99.02
The bullish scenario for DXY hinges on a sustained break above the 99.02 resistance level. This would signal a continuation of the upward trend, supported by strong US economic data and safe-haven demand driven by global uncertainties. The 1D chart shows a positive MACD histogram, indicating building bullish momentum.
If DXY manages to clear 99.02, the next target would be the 99.66 resistance level, followed by a potential move towards the psychological barrier of 100. The 1H chart shows Stochastic K=56.25 and D=36.43, indicating a potential buy signal. A break above 98.56 could trigger the bullish move, with a time horizon of the next 1-2 weeks.
To confirm the bullish thesis, traders should watch for strong US home sales data, a hawkish tone from the Federal Reserve, and continued geopolitical tensions. A break above 99.02 with increasing volume would add further conviction to the bullish scenario.
Where Bears Take Control: A Drop Below 98.04
The bearish scenario for DXY would unfold if the index fails to sustain its upward momentum and breaks below the 98.04 support level. This would signal a reversal of the recent gains, driven by weaker-than-expected US economic data and a potential easing of geopolitical tensions.
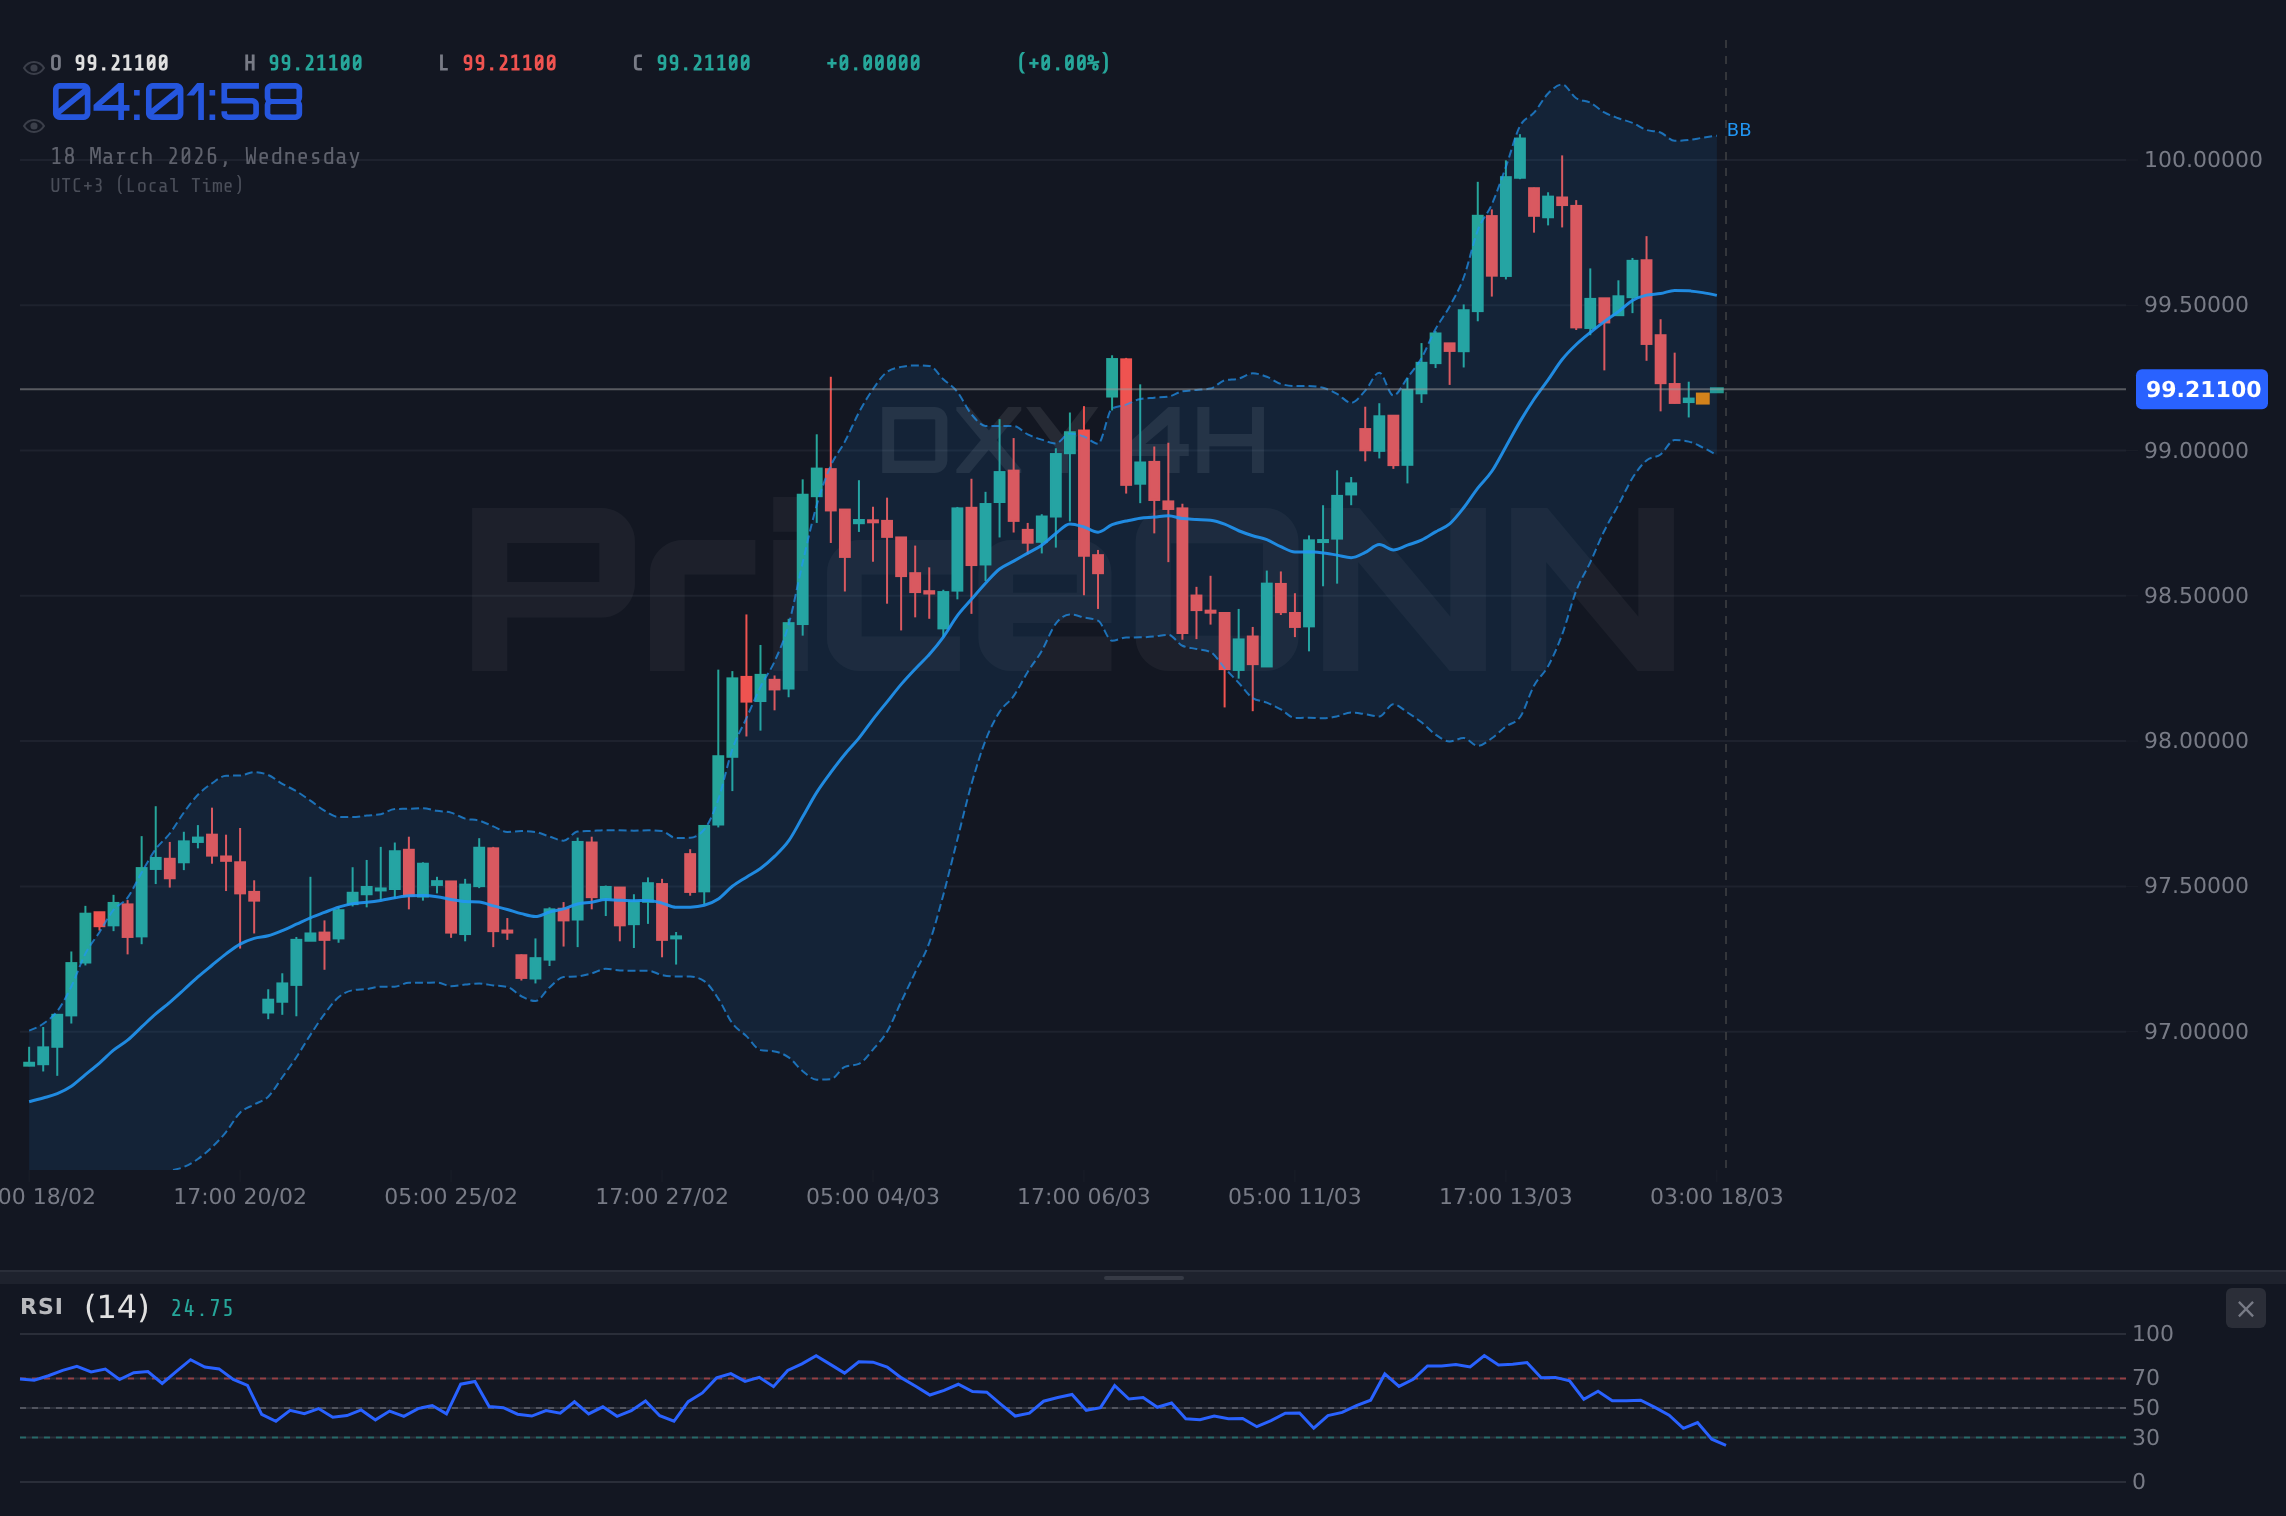
If DXY breaks below 98.04, the next target would be the 97.7 support level, followed by a potential move towards the 97.06 support level. The 4H chart shows a negative MACD histogram, suggesting increasing bearish momentum. The 4H chart RSI is at 46.86, indicating further downside potential. A drop below 98.26 could trigger the bearish move, with a time horizon of the next 1-2 weeks.
To confirm the bearish thesis, traders should watch for weak US home sales data, dovish comments from the Federal Reserve, and a de-escalation of geopolitical tensions. A break below 98.04 with increasing volume would add further conviction to the bearish scenario.
The Waiting Game: Range-Bound Consolidation
The neutral scenario for DXY would involve the index remaining range-bound between the 98.04 support and 99.02 resistance levels. This would suggest a period of consolidation, with traders awaiting further catalysts to drive a sustained breakout or breakdown. The 1D chart ADX at 24.85 indicates a moderate uptrend, but not a strong one. The 1H chart shows RSI at 45.96, suggesting neither overbought nor oversold conditions.
In this scenario, traders should focus on short-term trading opportunities within the range, buying near the support level and selling near the resistance level. A break of either level would signal the start of a new trend, requiring a reassessment of the market outlook. This rangebound scenario could persist for the next 1-3 weeks, depending on the flow of economic data and geopolitical developments.
Which Scenario is Most Likely?
Based on the current technical and fundamental picture, the bullish scenario appears to be the most likely, with an estimated probability of 55%. The ongoing geopolitical tensions and the expectation of continued strong US economic data provide a solid foundation for DXY strength. However, traders should remain cautious and monitor the upcoming US home sales data closely, as a negative surprise could quickly shift the balance towards the bearish scenario.
The ADX on the 4H chart is at 29.38, signaling a strong downtrend. The DXY 1-hour chart shows the price below the 200-period moving average, suggesting bearish momentum. This creates a potential conflict with the overall bullish sentiment, warranting a cautious approach.
Volatility creates opportunity - those prepared will be rewarded. With disciplined risk management, these choppy waters can be navigated safely.
Trade Plan: DXY Short Setup
Given the bearish signals from the short-term technical indicators, a short trade setup is outlined below. This plan is based on the expectation that DXY may face resistance near the $98.43 level and could potentially decline towards the support levels.
If DXY fails to break above the 98.50 level, it could potentially decline towards the support levels at 98.26 and 98.20. A sustained break below 98.20 could open the door for a further decline towards 98.11.
Entry Trigger: Initiate a short position if DXY fails to break above 98.50. Target 1: 98.26. Target 2: 98.20. Stop Loss/Invalidation: Place a stop loss above 98.56 to invalidate the short trade if DXY breaks higher.
The upcoming US home sales data on Tuesday could significantly impact DXY. Be prepared for potential volatility and adjust your position accordingly.
What I'm Watching This Week
Several key triggers could influence DXY's movement this week:
- US Home Sales Data (Tuesday): A strong reading could boost DXY, while a weak reading could weigh on the index.
- Geopolitical Developments: Escalating tensions could increase safe-haven demand for the US dollar, supporting DXY.
- Federal Reserve Comments: Hawkish comments could reinforce expectations of further rate hikes, boosting DXY.
Technical Outlook Summary
| Indicator | Value | Signal |
|---|---|---|
| RSI (14) | 45.96 | Neutral |
| MACD Histogram | Positive | Bullish |
| Stochastic | 56.25/36.43 | Bullish |
| ADX | 27.97 | Strong Downtrend |
| Bollinger | Middle Band | Watch |
Key Levels
Support Levels
Resistance Levels
Frequently Asked Questions: DXY Analysis
What happens if DXY breaks above 98.50 resistance?
If DXY breaks above the 98.50 resistance level, it could trigger a bullish move towards the next resistance levels at 99.02 and 99.66. The 1H chart shows Stochastic K=56.25 and D=36.43, indicating a potential buy signal.
Should I short DXY at current levels of $98.43 given the ADX at 27.97?
Given the ADX at 27.97 signaling a downtrend, you could consider a short position if DXY fails to break above 98.50. Set a stop loss above 98.56 to invalidate the short trade if DXY breaks higher, and target 98.26 and 98.20.
Is the positive MACD histogram on the 1D chart a reliable signal for DXY?
The positive MACD histogram on the 1D chart suggests building bullish momentum, but it's important to consider other indicators and potential catalysts. It's best to use this in confluence with other factors, such as a break above 98.50 resistance.
How will the US home sales data affect DXY this week?
Strong US home sales data could boost DXY, confirming the bullish trend, while a weak reading could weigh on the index, potentially leading to a decline towards the support levels at 98.26 and 98.20. Monitor data closely.
Track markets in real-time
AI-powered analysis, technical indicators and real-time price data.
Join Our Telegram Channel
Breaking market news, AI analysis and trading signals instantly.
Join Channel