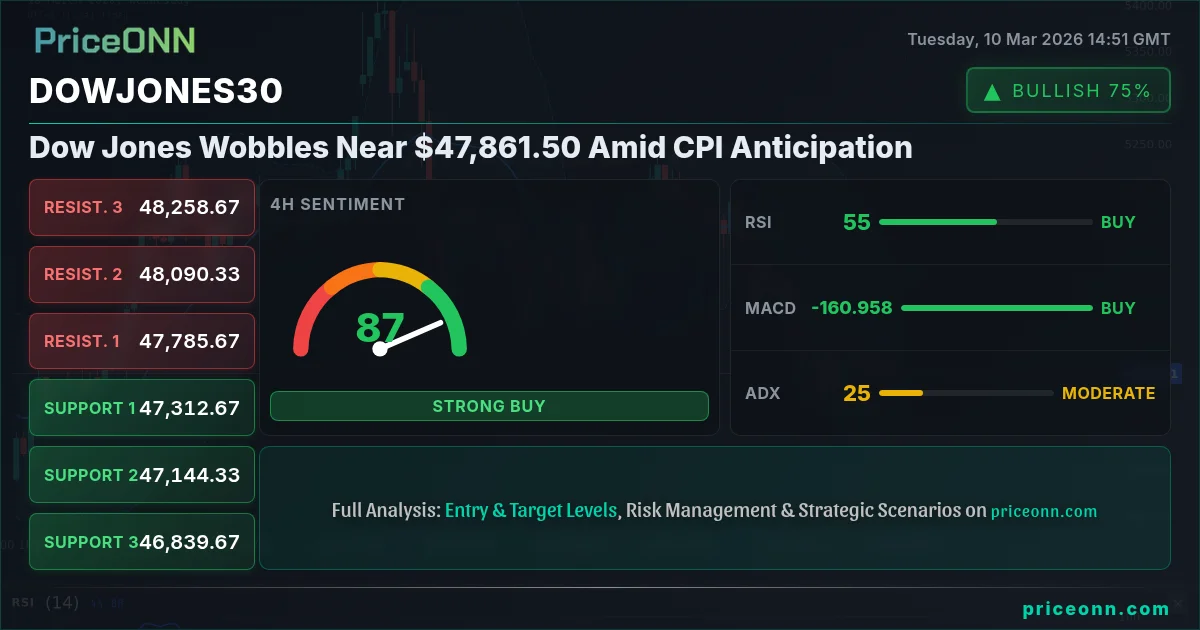
All eyes are on the Dow Jones Industrial Average as it navigates a choppy session near $47,861.50. Investors are keenly awaiting the latest Consumer Price Index (CPI) data, which is poised to inject volatility into the market and potentially reshape expectations for the Federal Reserve's future monetary policy. The Dow's performance is currently influenced by a complex interplay of factors, including rising oil prices triggered by Middle East tensions, a fluctuating dollar index, and mixed signals from various technical indicators.
- Dow Jones is currently trading near $47,861.50, exhibiting a daily change of 0.37%.
- Key support levels to watch are $47,511 and $47,417.
- Upcoming CPI data on Wednesday holds the potential to significantly impact market sentiment and Fed policy expectations.
- A strong uptrend is indicated in the 1H timeframe, with ADX at 25.03 suggesting continued momentum.
The energy sector is particularly sensitive right now. WTI Crude Oil is showing a daily change of -0.38%, trading at $84.64, after geopolitical tensions had pushed prices higher. This volatility in oil prices directly impacts inflation expectations, which in turn influence the Fed's stance on interest rates. According to Reuters, Fed officials have emphasized that inflation remains 'stubborn,' making upcoming economic data releases crucial for policy decisions. Traders are now carefully weighing the possibility of further rate hikes against the backdrop of slowing economic growth. The Dow Jones, as a barometer of the broader economy, is acutely affected by these shifting expectations.
From a technical perspective, the Dow Jones presents a mixed picture. On the 1-hour chart, the trend is decisively bullish, with a strength of 98%. The ADX indicator registers 25.03, confirming the presence of a strong uptrend. However, the RSI at 61.3 is not yet in overbought territory, suggesting that there's still room for further upside. Scalpers might look for opportunities to ride this short-term bullish momentum, targeting the immediate resistance level of $47,682. Swing traders, on the other hand, should exercise caution, given the proximity of the CPI data release and the potential for a sharp reversal.
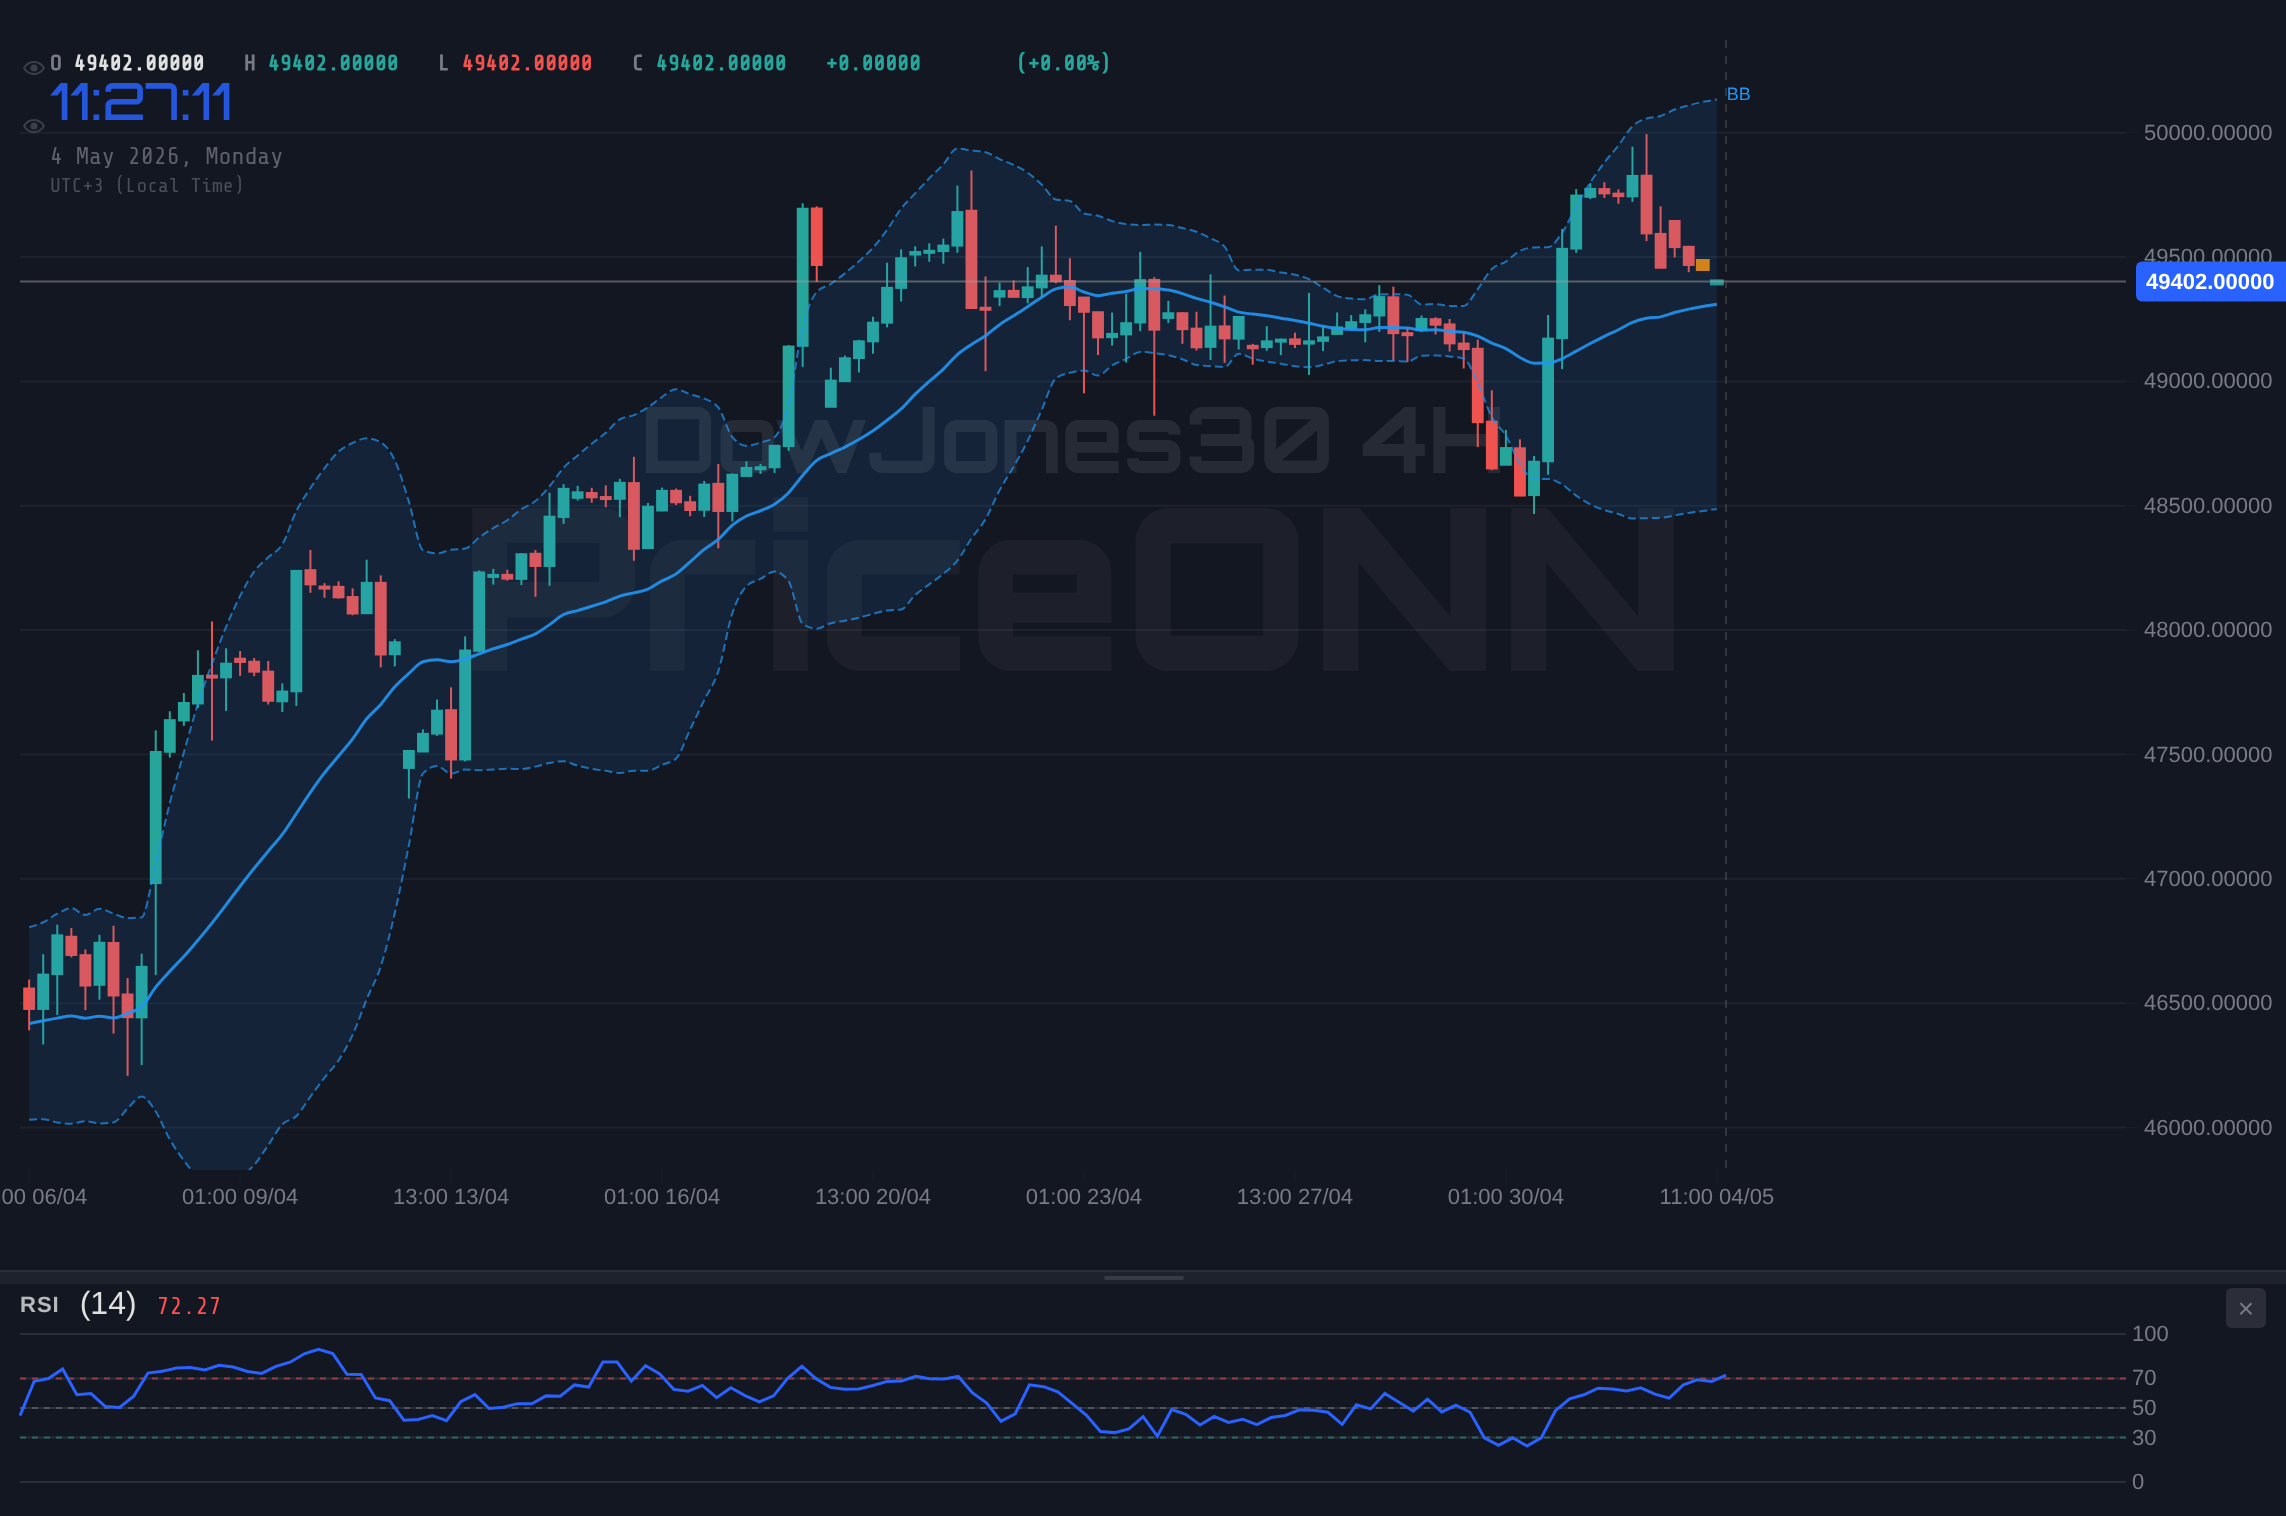
The 4-hour chart paints a slightly different picture. While the trend is classified as neutral, the RSI stands at 51.56, indicating a potential for upward movement. The Stochastic oscillator, with %K at 92.28 and %D at 71.55, is signaling overbought conditions, suggesting that a pullback might be imminent. Key support levels to monitor are $47,689 and $47,488. A break below these levels could trigger a more significant correction. Long-term investors should pay close attention to how the Dow Jones reacts to these support levels, as it could provide clues about the underlying strength of the market.
Looking at the daily timeframe, the Dow Jones reveals a bearish trend with a strength of 95%. The RSI at 38.54 is below the neutral level, suggesting continued downward pressure. The MACD histogram is also negative, reinforcing the bearish outlook. Key resistance to watch is $48,272.33. This bearish trend is further corroborated by the overall market context. The SP500, another major US index, also shows a bearish trend on the daily timeframe, indicating a broader risk-off sentiment in the market. This correlation suggests that the Dow Jones is unlikely to buck the trend and stage a sustained rally unless there's a significant shift in market sentiment.
The Dollar Index (DXY) is currently trading at 98.4, showing a slight increase of 0.03%. Historically, a stronger dollar tends to put downward pressure on the Dow Jones, as it makes US exports more expensive and reduces the competitiveness of US companies. However, the relationship between the DXY and the Dow Jones is not always straightforward and can be influenced by other factors, such as global economic growth and investor risk appetite. With the DXY at 98.4, DowJones30 is facing headwinds. Should the DXY break above 99.02, anticipate even greater pressure on the Dow. Conversely, if the DXY falters, the Dow might find some relief.
The upcoming CPI data is expected to be a major catalyst for market movement. The previous CPI reading was 3.91, and any significant deviation from this level could trigger a sharp reaction in the Dow Jones. A higher-than-expected CPI reading would likely lead to increased expectations for Fed rate hikes, putting downward pressure on the Dow. Conversely, a lower-than-expected CPI reading would ease concerns about inflation and could trigger a rally in the Dow. Investors should be prepared for increased volatility in the lead-up to and following the CPI release. According to Bloomberg, analysts are divided on the likely outcome of the CPI data, adding to the uncertainty in the market.
The geopolitical landscape also warrants close attention. Escalating tensions in the Middle East have led to a surge in oil prices, which in turn has fueled inflation concerns. While oil prices have since retreated from their recent highs, the situation remains fluid, and any further escalation could trigger another spike in energy costs. This would likely exacerbate inflation pressures and further complicate the Fed's policy decisions. As a result, the Dow Jones is likely to remain sensitive to geopolitical developments in the coming days.
For scalpers, the strong uptrend on the 1-hour chart presents opportunities for quick profits. Look for potential entry points near the support level of $47,511, targeting the resistance level of $47,682. However, be mindful of the elevated risk associated with trading around major economic data releases. Swing traders should adopt a more cautious approach, waiting for the CPI data to be released before making any significant moves. A break above the resistance level of $48,272.33 could signal the start of a new uptrend, while a break below the support level of $47,488 could confirm the continuation of the existing downtrend.
Long-term investors should focus on the bigger picture, considering the overall economic outlook and the Fed's long-term policy goals. While the current market environment is characterized by uncertainty and volatility, it also presents opportunities to accumulate quality stocks at attractive valuations. A disciplined approach to risk management is essential, ensuring that portfolio allocations are aligned with individual risk tolerance and investment objectives. Patient investors who are willing to weather the storm are likely to be rewarded in the long run.
If Dow Jones breaks above the resistance at $48,272.33, it could target $48,859.67 and potentially $49,846.33, indicating a strong bullish reversal.
If Dow Jones closes below $47,488, it may fall to $46,698.33 and further to $45,711.67, signaling a continuation of the bearish trend.
Frequently Asked Questions: DowJones30 Analysis
What happens if DowJones30 breaks above $48,272.33 resistance?
If DowJones30 successfully breaches the $48,272.33 resistance, it could signal a strong bullish reversal, potentially targeting higher levels such as $48,859.67 and $49,846.33. This breakout would likely be driven by positive economic data or a shift in market sentiment.
Should I buy DowJones30 at current levels of $47,861.50 given the upcoming CPI data?
Buying at current levels carries risk due to the imminent CPI release. A cautious approach would involve waiting for the CPI data to be released and observing the market's reaction before initiating a long position, especially if the reading significantly deviates from expectations.
Is RSI at 38.54 on the daily chart a reliable sell signal for DowJones30?
While an RSI of 38.54 on the daily chart suggests downward pressure, it should not be used in isolation as a definitive sell signal. Confirmation from other indicators and price action is crucial to validate the bearish outlook, especially considering the potential for a short-term bounce.
How will Wednesday's CPI data affect DowJones30 this week?
The CPI data set to be released on Wednesday will likely have a significant impact on DowJones30. A higher-than-expected CPI reading could intensify fears of inflation, leading to increased expectations of Fed rate hikes and a subsequent decline in the index, while a lower reading may trigger a rally.
The Dow Jones is at a crucial juncture, influenced by a combination of technical factors, economic data releases, and geopolitical tensions. Investors should remain vigilant and adapt their strategies based on the evolving market conditions. The upcoming CPI data is the key event to watch, as it will likely set the tone for the Dow's performance in the coming weeks. Volatility creates opportunity - those prepared will be rewarded.
Technical Outlook Summary
| Indicator | Value | Signal |
|---|---|---|
| RSI (14) | 61.3 | Neutral |
| MACD Histogram | Positive | Bullish |
| Stochastic | 50.44/70.19 | Bearish |
| ADX | 25.03 | Strong Trend |
| Bollinger | Upper Band | Watch |
Key Levels
Support Levels
Resistance Levels
Track markets in real-time
AI-powered analysis, technical indicators and real-time price data.
Join Our Telegram Channel
Breaking market news, AI analysis and trading signals instantly.
Join Channel