BRENT Bullish: $65.73 Holds as Traders Eye US CPI Data?
BRENT crude oil is holding steady at $65.73, with traders closely monitoring upcoming US CPI data for potential market-moving catalysts. Will this level hold?
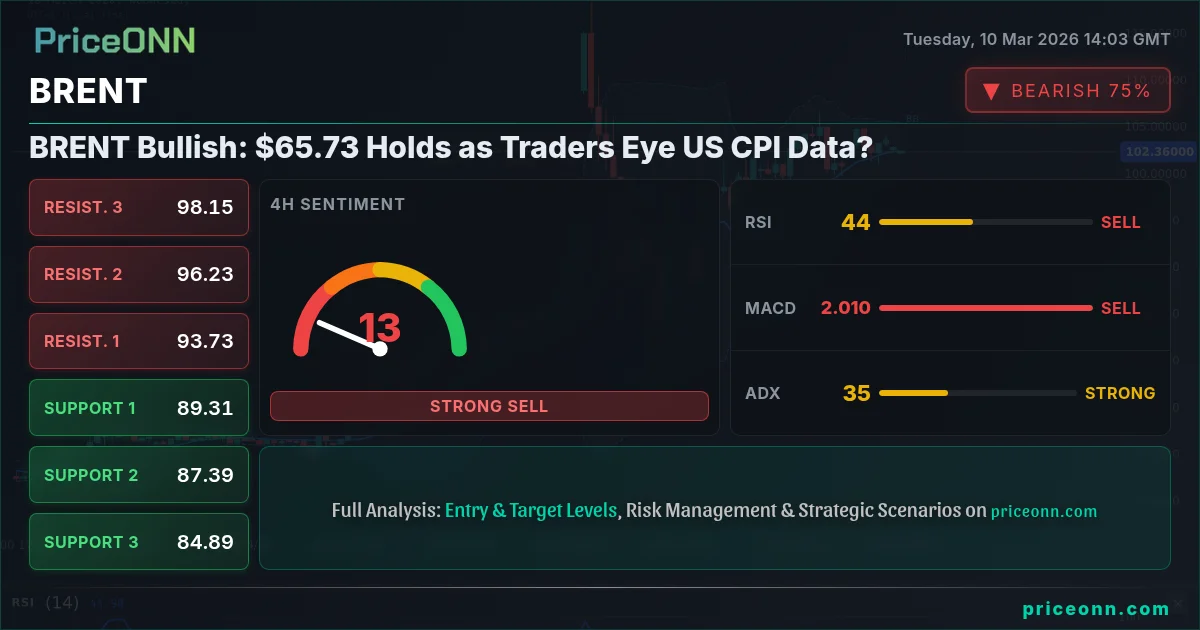
BRENT crude oil finds itself at a pivotal juncture, currently trading around $65.73. The energy market is holding its breath ahead of the upcoming US CPI data release, which could inject significant volatility and redefine short-term trajectories for the commodity. Traders are keenly observing whether this level can hold, given the confluence of technical and fundamental factors at play.
- RSI at 71.16 signals potential overbought conditions on the 1-hour timeframe, suggesting a possible pullback.
- Key support level identified at $65.20, having served as a reliable floor in recent trading sessions.
- MACD on the 1-hour chart displays positive momentum, indicating underlying bullish strength despite overbought concerns.
- Upcoming US CPI data on Wednesday is expected to heavily influence BRENT's correlation with the DXY, potentially triggering a breakout or breakdown.
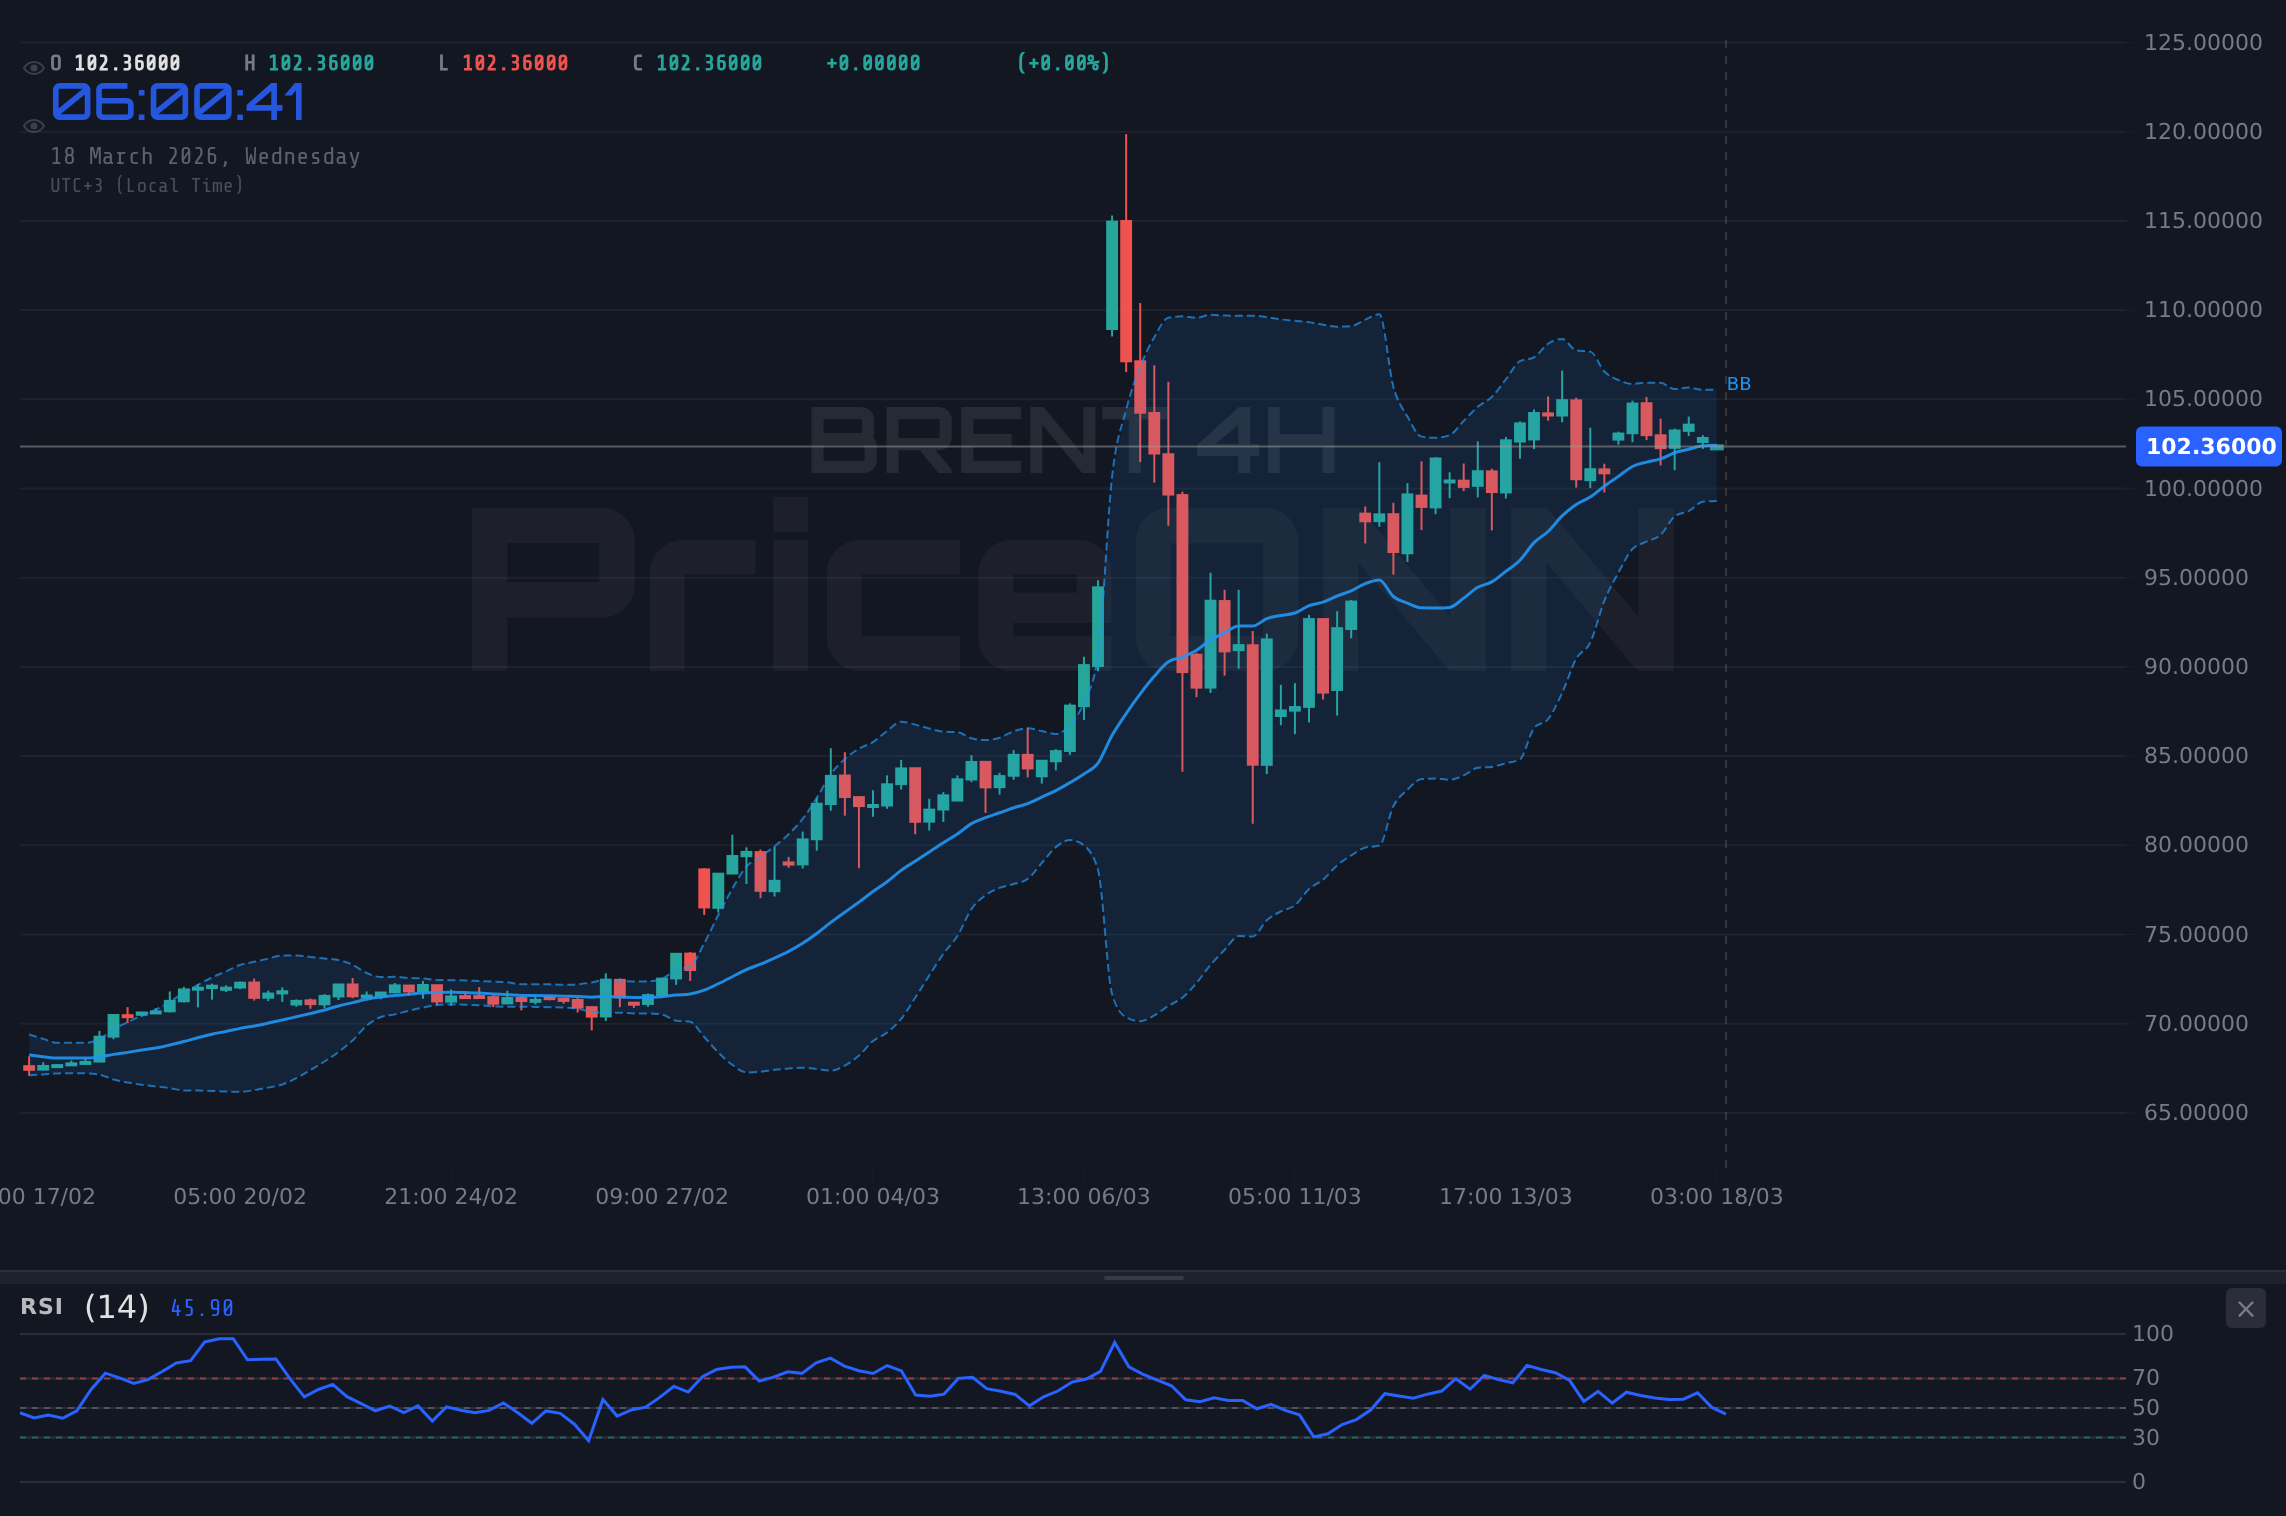
The current market sentiment surrounding BRENT is a mix of optimism fueled by recent gains and caution spurred by technical indicators hinting at overbought conditions. The geopolitical landscape, particularly tensions in the Middle East, continues to provide a backdrop of uncertainty, with potential supply disruptions always a looming threat. This situation has contributed to the recent volatility in oil prices, as highlighted in recent news where WTI crude oil experienced a surge, briefly exceeding $120 per barrel amid escalating geopolitical tensions.
The Bull's Roadmap: A Break Above Resistance
For the bullish scenario to materialize, BRENT needs to decisively break above the immediate resistance at $65.41. This level has proven to be a stubborn barrier, rejecting several attempts to breach it in the past few sessions. IF BRENT manages to clear this hurdle with significant volume, the next target would be $65.52, followed by $65.62. A successful breakout above $65.62 could pave the way for a test of the daily high at $66.04. This scenario is predicated on the US CPI data coming in below expectations, which would likely weaken the dollar and provide a boost to commodity prices. The 1-hour ADX, currently at a weak 19.03, needs to show a considerable increase to confirm the strength of this bullish move. The time horizon for this scenario is within the next 2-3 trading sessions, contingent on the CPI data release. Scalpers might look for quick long entries on pullbacks to $65.20, while swing traders would await confirmation above $65.62 before entering.
Where Bears Take Control: A Breakdown Below Support
On the flip side, the bearish scenario would come into play if BRENT fails to hold the support at $65.20. This level has acted as a critical buffer, preventing further downside in recent trading. IF BRENT breaks below $65.20, the next support target would be $65.10, followed by $64.99. A breakdown below $64.99 could trigger a more significant sell-off, potentially leading to a retest of the daily low at $64.40. This scenario would likely unfold if the US CPI data comes in above expectations, strengthening the dollar and putting downward pressure on oil prices. The 1-hour RSI, currently at 71.16, would need to decline sharply to confirm this bearish move. The time horizon for this scenario is within the next 2-3 trading sessions, also dependent on the CPI data release. Scalpers could target short entries on rallies to $65.41, while swing traders might wait for confirmation below $64.99 before initiating short positions. Long-term investors might see this as an opportunity to accumulate BRENT at lower levels, provided the fundamental outlook remains supportive.
The Waiting Game: Range-Bound Consolidation
A third possible scenario is that BRENT remains trapped in a range-bound consolidation between the support at $65.20 and the resistance at $65.41. This would occur if the US CPI data comes in largely as expected, providing no clear directional impetus to the market. In this case, BRENT would likely continue to oscillate within this narrow range, with traders focusing on short-term scalping opportunities. The ADX on the 1-hour timeframe, currently at a weak 19.03, supports this range-bound view, indicating a lack of strong trending momentum. The Stochastic oscillator, with %K at 90.49 and %D at 81.87, also suggests potential overbought conditions, further reinforcing the possibility of a sideways movement. This scenario could persist for the next few days, until a more significant catalyst emerges. The key for range traders would be to identify short-term overbought and oversold conditions within the range and capitalize on mean-reversion opportunities.
Which Scenario is Most Likely?
Considering the current market dynamics, the most likely scenario is a test of resistance at $65.41 (estimated probability: 45%). The positive momentum indicated by the MACD on the 1-hour chart, coupled with the overall bullish trend across multiple timeframes, suggests that BRENT has a higher probability of breaking higher. However, the overbought conditions indicated by the RSI and Stochastic oscillator warrant caution, and the US CPI data remains a significant wildcard. A bearish breakdown below $65.20 is assigned a probability of 35%, while the range-bound consolidation scenario is given a probability of 20%. The US Dollar Index is currently at 98.5, and any further strengthening could weigh on BRENT prices.
Key Triggers to Watch This Week
Several key triggers could significantly impact BRENT prices this week. Firstly, the US CPI data release on Wednesday will be crucial in determining the short-term direction of the market. A higher-than-expected CPI print would likely strengthen the dollar and put downward pressure on oil prices, while a lower-than-expected print would likely weaken the dollar and provide a boost to oil prices. Secondly, any escalation of geopolitical tensions in the Middle East could lead to a surge in oil prices, as supply disruption concerns would increase. Thirdly, any unexpected changes in OPEC+ production policy could also significantly impact the market. Traders should closely monitor these triggers and adjust their strategies accordingly.
BRENT's Correlation Analysis
Understanding BRENT's correlation with other asset classes is crucial for making informed trading decisions. A strengthening US Dollar Index (DXY), currently at 98.5, typically puts downward pressure on BRENT, as the commodity is priced in dollars. Conversely, a weakening DXY tends to support BRENT prices. The SP500 and Nasdaq indices, serving as indicators of risk appetite, generally exhibit a positive correlation with BRENT. A strong equity market suggests increased economic activity and demand for oil, while a weak equity market signals a decline in economic activity and demand for oil. Treasury yields also play a role, with rising yields often reflecting higher inflation expectations, which can be supportive of oil prices. Finally, geopolitical events, particularly those affecting oil-producing regions, can significantly impact BRENT prices, often leading to sharp spikes due to supply concerns.
Historical Perspective: Similar Patterns in the Past
Analyzing historical patterns can provide valuable insights into potential future price movements for BRENT. In early 2022, similar market conditions prevailed, with rising geopolitical tensions and increasing inflation expectations driving oil prices higher. However, as central banks began to tighten monetary policy, oil prices experienced a significant correction. This historical parallel suggests that the current bullish momentum in BRENT could be vulnerable to a similar reversal, particularly if the US CPI data prompts the Federal Reserve to adopt a more hawkish stance. Traders should be mindful of these historical precedents and exercise caution when making trading decisions.
Central Bank Policies and Macroeconomic Data
Central bank policies and macroeconomic data releases are key drivers of BRENT prices. The Federal Reserve's monetary policy decisions, particularly those related to interest rates and quantitative easing, can significantly impact the dollar and, consequently, BRENT prices. Stronger-than-expected economic data, such as the US CPI, can lead to expectations of a more hawkish Fed stance, strengthening the dollar and putting downward pressure on oil. Conversely, weaker-than-expected data can lead to expectations of a more dovish Fed stance, weakening the dollar and supporting oil prices. Traders should closely monitor these factors and adjust their strategies accordingly. According to Reuters, "Fed officials have emphasized the persistence of inflation.".
Frequently Asked Questions: BRENT Analysis
What happens if BRENT breaks above $65.41 resistance?
If BRENT decisively breaks above the $65.41 resistance level, it could trigger a further rally towards $65.52 and potentially $65.62, as indicated by the 1-hour timeframe analysis. This breakout would likely be fueled by positive news or a weaker dollar.
Should I buy BRENT at current $65.73 levels given RSI at 71.16?
While the overall trend is bullish, the RSI at 71.16 suggests potential overbought conditions on the 1-hour timeframe. It might be prudent to wait for a pullback towards support at $65.20 before considering a long entry, aiming for a target of $65.52 with a stop-loss below $65.10.
Is RSI at 71.16 a sell signal for BRENT right now?
An RSI of 71.16 indicates overbought conditions but does not necessarily warrant an immediate sell signal. It suggests that the upward momentum might be waning, and a pullback is possible. Traders should look for confirmation from other indicators or price action before initiating a short position.
How will the US CPI data on Wednesday affect BRENT this week?
The US CPI data on Wednesday will be a key catalyst for BRENT. A higher-than-expected CPI print would likely strengthen the dollar and put downward pressure on oil prices, while a lower-than-expected print would likely weaken the dollar and provide a boost to oil prices. The market's reaction will depend on the magnitude of the deviation from expectations.
Track markets in real-time
AI-powered analysis, technical indicators and real-time price data.
Join Our Telegram Channel
Breaking market news, AI analysis and trading signals instantly.
Join Channel