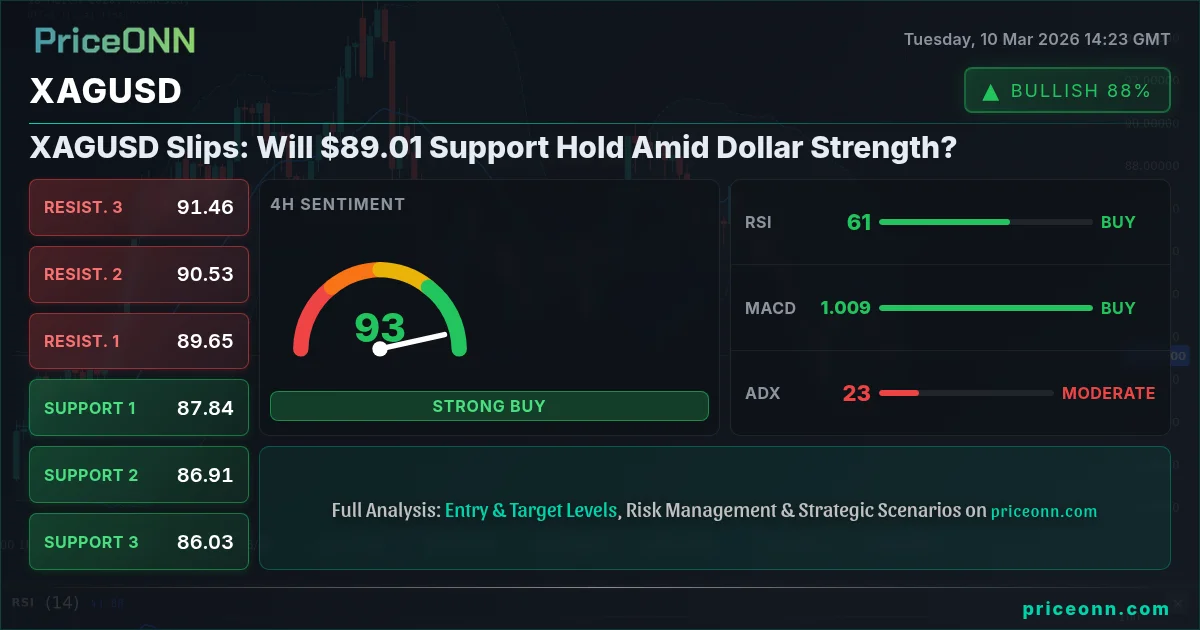
Silver (XAGUSD) is navigating a challenging landscape as the US Dollar Index (DXY) gathers strength, currently trading at $89.01. The stronger dollar, with the DXY at 98.45, is exerting downward pressure on the precious metal, testing critical support levels that could determine its short-term trajectory. Investors are closely watching whether this support can hold, or if a breakdown will trigger a more significant correction.
- XAGUSD is under pressure at $89.01 as DXY strengthens to 98.45.
- Key support at $88.49 is being tested, a break below could trigger further selling.
- Stochastic on the 4H chart signals overbought conditions, suggesting a potential pullback.
- Upcoming USD data on Wednesday, March 11th, could be a catalyst for further XAGUSD volatility.
Silver Under Pressure: Dollar Strength Weighs
The primary driver behind the current weakness in silver is the strengthening US dollar. The DXY, a measure of the dollar's value against a basket of other currencies, has been steadily climbing, reaching 98.45. This rise makes dollar-denominated assets like silver more expensive for international buyers, reducing demand and putting downward pressure on prices. As EUR/USD softens below 1.1650, as reported, the inverse relationship between the dollar and silver becomes more pronounced.
Furthermore, recent economic data and geopolitical tensions are playing a role. As the market digests the impact of the Middle East tensions, which are simultaneously boosting the US dollar and creating safe-haven demand, silver finds itself in a complex situation. The rise in WTI crude to $87.12, while typically inflationary, is overshadowed by the dollar’s strength, leading to conflicting signals for silver.
Technical Analysis: Key Levels and Indicators
From a technical perspective, XAGUSD faces a critical juncture. The 1H chart shows a bullish trend with 84% strength. However, the current price action suggests that the bullish momentum may be waning. The first support level to watch is at 88.06. A break below this level could open the door for a test of the next support at 87.52. On the upside, immediate resistance lies at 88.96, followed by 89.33.
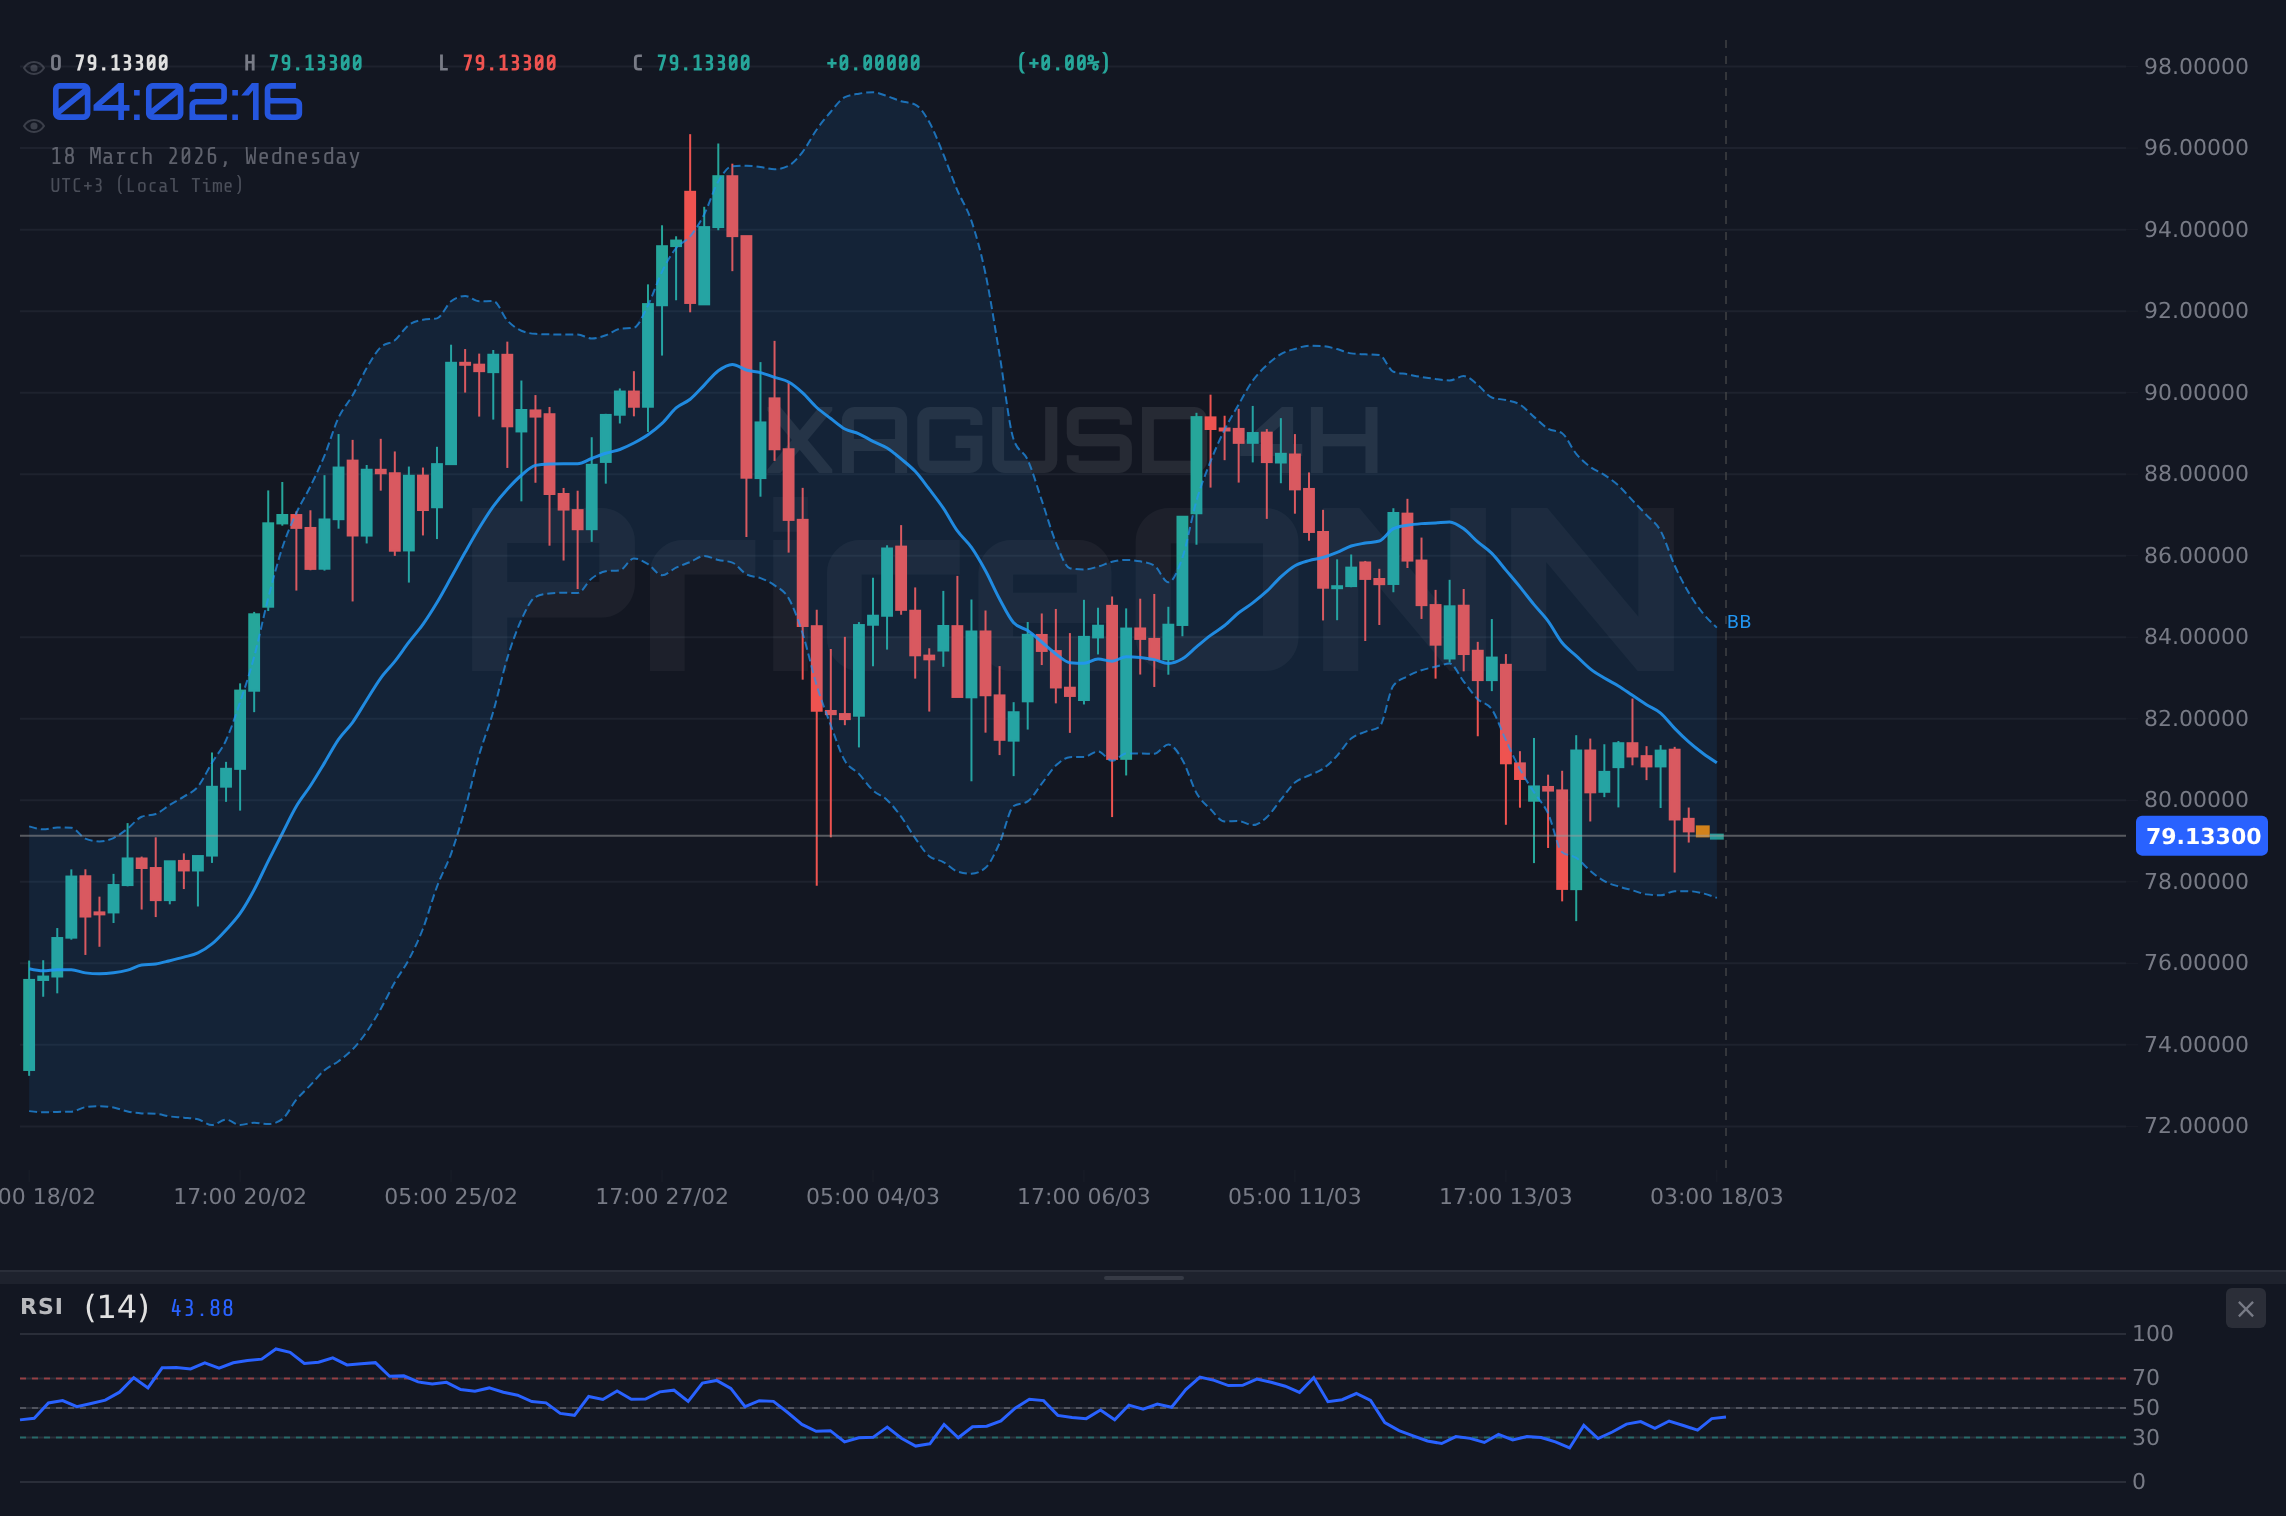
The 4H chart paints a slightly different picture. While the trend is neutral, the RSI at 61.24 indicates that the market is neither overbought nor oversold, suggesting room for further movement in either direction. The MACD is showing positive momentum, but the stochastic oscillator is in overbought territory with K=91.21 and D=90.34, signaling a potential pullback. The key level to watch on the 4H chart is the support at 88.49. A break below this level could lead to a test of 87.87.
On the daily timeframe, XAGUSD is showing a bearish trend with 83% strength. The first resistance level is 89.42, followed by 91.89 and 96.81. The RSI at 54.22 is neutral, and the MACD shows positive momentum, but the stochastic oscillator is giving a bullish signal with K=47.96 and D=41.72.
Trade Plan: Potential Short Setup
Given the technical picture and the strength of the US dollar, a short trade setup may be warranted. The ADX on the 1H chart is at 28.18, indicating a moderate trend strength. The stochastic oscillator is signaling a potential pullback, and the RSI is neutral, allowing for potential downside movement. This supports a bearish outlook.
If XAGUSD can hold above the 88.96 resistance, a move towards 89.33 and 89.87 is possible. A sustained break above 89.87 could signal a continuation of the longer-term uptrend.
A break below the 88.06 support could trigger a sell-off towards 87.52 and 87.16. A close below 87.16 would confirm the bearish outlook, potentially leading to further declines.
Economic Calendar: Watch for USD Data
Traders should keep a close eye on upcoming US economic data releases. On Wednesday, March 11th, there are several USD data points scheduled, including releases that previously had a previous value of 3.91, 0.2, 2.4 and 0.3. These releases could significantly impact the dollar's value and, consequently, XAGUSD. Better-than-expected data could further strengthen the dollar, putting additional downward pressure on silver.
Risk Management and Trade Execution
Given the conflicting signals, it's crucial to manage risk effectively. A stop-loss order should be placed above the recent swing high to protect against unexpected upside moves. The potential reward-to-risk ratio should be carefully considered before entering any trade. Wait for a clear break of the 88.06 support level before initiating a short position. The 1H chart indicates a bullish trend, it is important to be aware of this, and implement proper risk mitigation strategies.
Technical Outlook Summary
| Indicator | Value | Signal |
|---|---|---|
| RSI (14) | 64.23 | Neutral |
| MACD Histogram | Negative | Bearish |
| Stochastic | 51.49/57.59 | Bearish |
| ADX | 28.18 | Strong Uptrend |
| Bollinger | Middle Band | Watch |
Key Levels
Support Levels
Resistance Levels
Risk/Reward Analysis: XAGUSD Short Trade
Considering a short trade on XAGUSD, the risk/reward profile needs careful evaluation. With an entry trigger at a confirmed break below 88.06, the initial target could be 87.52, offering a potential profit of $0.54. The stop-loss should be placed just above the recent high at 88.96, risking $0.90. This setup yields a risk/reward ratio of approximately 1:0.6, which is not ideal. However, if the trade extends to the second target at 87.16, the potential profit increases to $0.90, improving the risk/reward ratio to 1:1.
The probability of this scenario playing out is estimated to be around 60%, given the strong dollar and the bearish signals on the 4H chart. However, traders should be prepared for volatility and unexpected reversals, especially with the upcoming USD data releases.
Frequently Asked Questions: XAGUSD Analysis
What happens if XAGUSD breaks above 88.96 resistance?
If XAGUSD breaks above the 88.96 resistance, it could signal a continuation of the bullish trend, potentially leading to further gains towards 89.33 and 89.87. Traders should watch for a sustained break above 88.96 to confirm the bullish scenario.
Should I sell at current $89.01 levels given the Stochastic at 51.49/57.59?
Given the stochastic oscillator's bearish signal and the overall pressure from the stronger US dollar, selling at current levels could be considered. However, it's crucial to wait for a confirmed break below the 88.06 support before initiating a short position to minimize risk.
Is RSI at 64.23 a sell signal for XAGUSD right now?
An RSI of 64.23 is not a definitive sell signal, as it is within the neutral zone. While it suggests that the market is not oversold, it doesn't necessarily indicate a strong bearish signal. Traders should consider other indicators and price action before making a decision.
How will the USD data on March 11th affect XAGUSD this week?
The USD data releases on March 11th could significantly impact XAGUSD. Stronger-than-expected data could further strengthen the US dollar, putting additional downward pressure on silver. Conversely, weaker-than-expected data could weaken the dollar, providing some support to XAGUSD.
Track markets in real-time
AI-powered analysis, technical indicators and real-time price data.
Join Our Telegram Channel
Breaking market news, AI analysis and trading signals instantly.
Join Channel