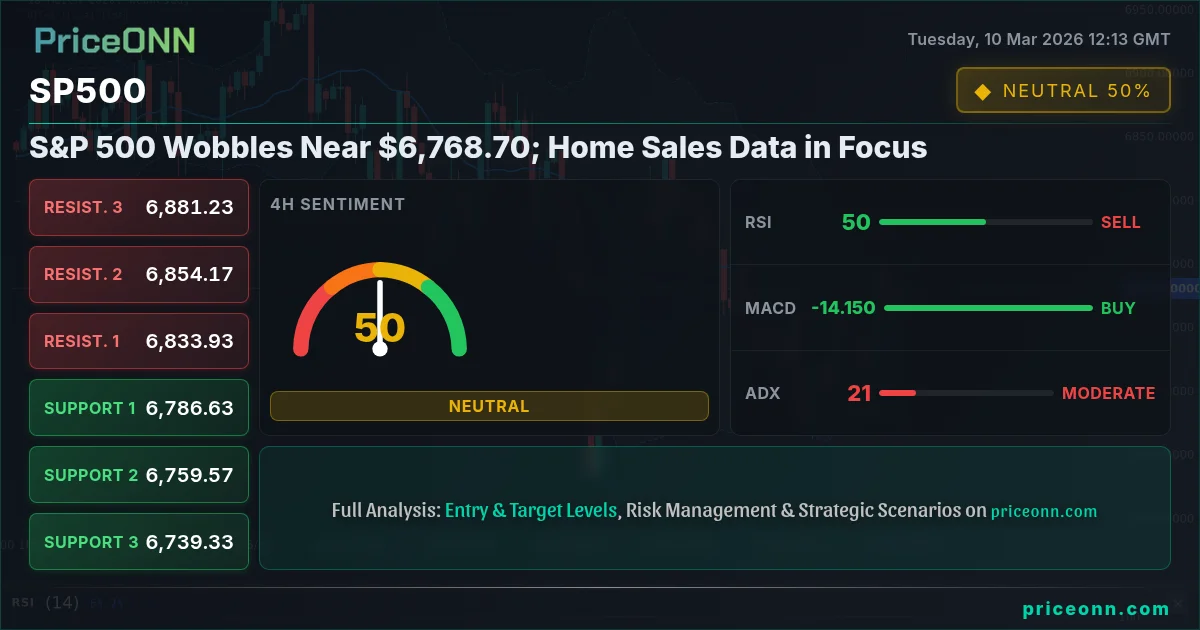
The S&P 500 (SP500) is currently trading at $6,768.70, facing headwinds as the market anticipates upcoming home sales data. This data will be critical in gauging the health of the housing sector and its potential impact on the broader economy. Investors are closely watching key technical levels to determine the next direction for the index.
- RSI at 42.56 on the daily timeframe suggests increasing bearish momentum.
- Critical support level lies at $6,640.47, a break below could trigger further declines.
- MACD histogram shows negative momentum, indicating selling pressure.
- Upcoming home sales data and Middle East tensions are key drivers of SP500 correlation with DXY.
Why $6,768.70 is the Line in the Sand for SP500
The $6,768.70 level is proving to be a pivotal point for the SP500. After a period of sustained bullish momentum, the index is now facing increased selling pressure. The daily chart reveals a concerning picture, with the RSI at 42.56 indicating growing bearish momentum. This suggests that the bulls are losing their grip, and the bears may be poised to take control. The MACD histogram also supports this view, showing negative momentum and highlighting the increasing selling pressure.
From a multi-timeframe analysis perspective, the hourly chart shows a slight recovery with RSI at 52.46 and ADX at 28.88 showing a strong upwards trend, suggesting a short term bullish push. However, the daily chart is showing the overall trend is still bearish with a strong trend at ADX 33.6. Traders should keep these in mind as they make their decisions.
The correlation between the SP500 and the DXY (Dollar Index) is also worth noting. As the DXY strengthens to 98.55 amid Middle East tensions, it puts additional pressure on the SP500. This inverse relationship suggests that any further gains in the dollar could exacerbate the downward pressure on the index. Investors should keep a close eye on the DXY as a leading indicator for the SP500's potential direction. According to Reuters, the Federal Reserve is likely to maintain its hawkish stance due to persistent inflationary pressures, which could further support the dollar and weigh on the SP500.
The Bull's Roadmap: A Rebound Scenario
If the SP500 can hold above the immediate support at $6,757.80, we might see a rebound towards the resistance level of $6,816.07. A successful break above this resistance could pave the way for further gains towards $6,872.57. This scenario is contingent on positive economic data and a de-escalation of geopolitical tensions.
For the bullish scenario to unfold, several factors need to align. First and foremost, the market needs to see positive economic data that supports the notion of continued economic growth. Specifically, a better-than-expected home sales report could provide a much-needed boost to sentiment. Additionally, a de-escalation of geopolitical tensions in the Middle East could alleviate some of the safe-haven demand for the dollar, which would help to ease the downward pressure on the SP500. Scalpers should watch for quick bounces off intraday support levels, while swing traders might consider entering long positions on a confirmed break above $6,794.73. Long-term investors may view this pullback as an opportunity to add to their positions at a discounted price.
Where Bears Take Control: A Breakdown Scenario
Conversely, if the SP500 fails to hold above the $6,757.80 support, a breakdown scenario could unfold. This would likely trigger a move towards the next support level at $6,640.47. A break below this level could lead to a more significant correction towards $6,493.73. This scenario is more probable if home sales data disappoints and geopolitical tensions escalate.
The bearish scenario is predicated on a combination of negative economic data and heightened geopolitical risks. A disappointing home sales report would signal weakness in the housing sector, which could weigh on overall economic growth. Furthermore, an escalation of tensions in the Middle East could lead to a surge in safe-haven demand for the dollar, putting further downward pressure on the SP500. Scalpers should look for opportunities to short the index on intraday rallies, while swing traders might consider entering short positions on a confirmed break below $6,757.80. Long-term investors should consider reducing their exposure to equities if the bearish scenario gains traction.
The Waiting Game: A Range-Bound Scenario
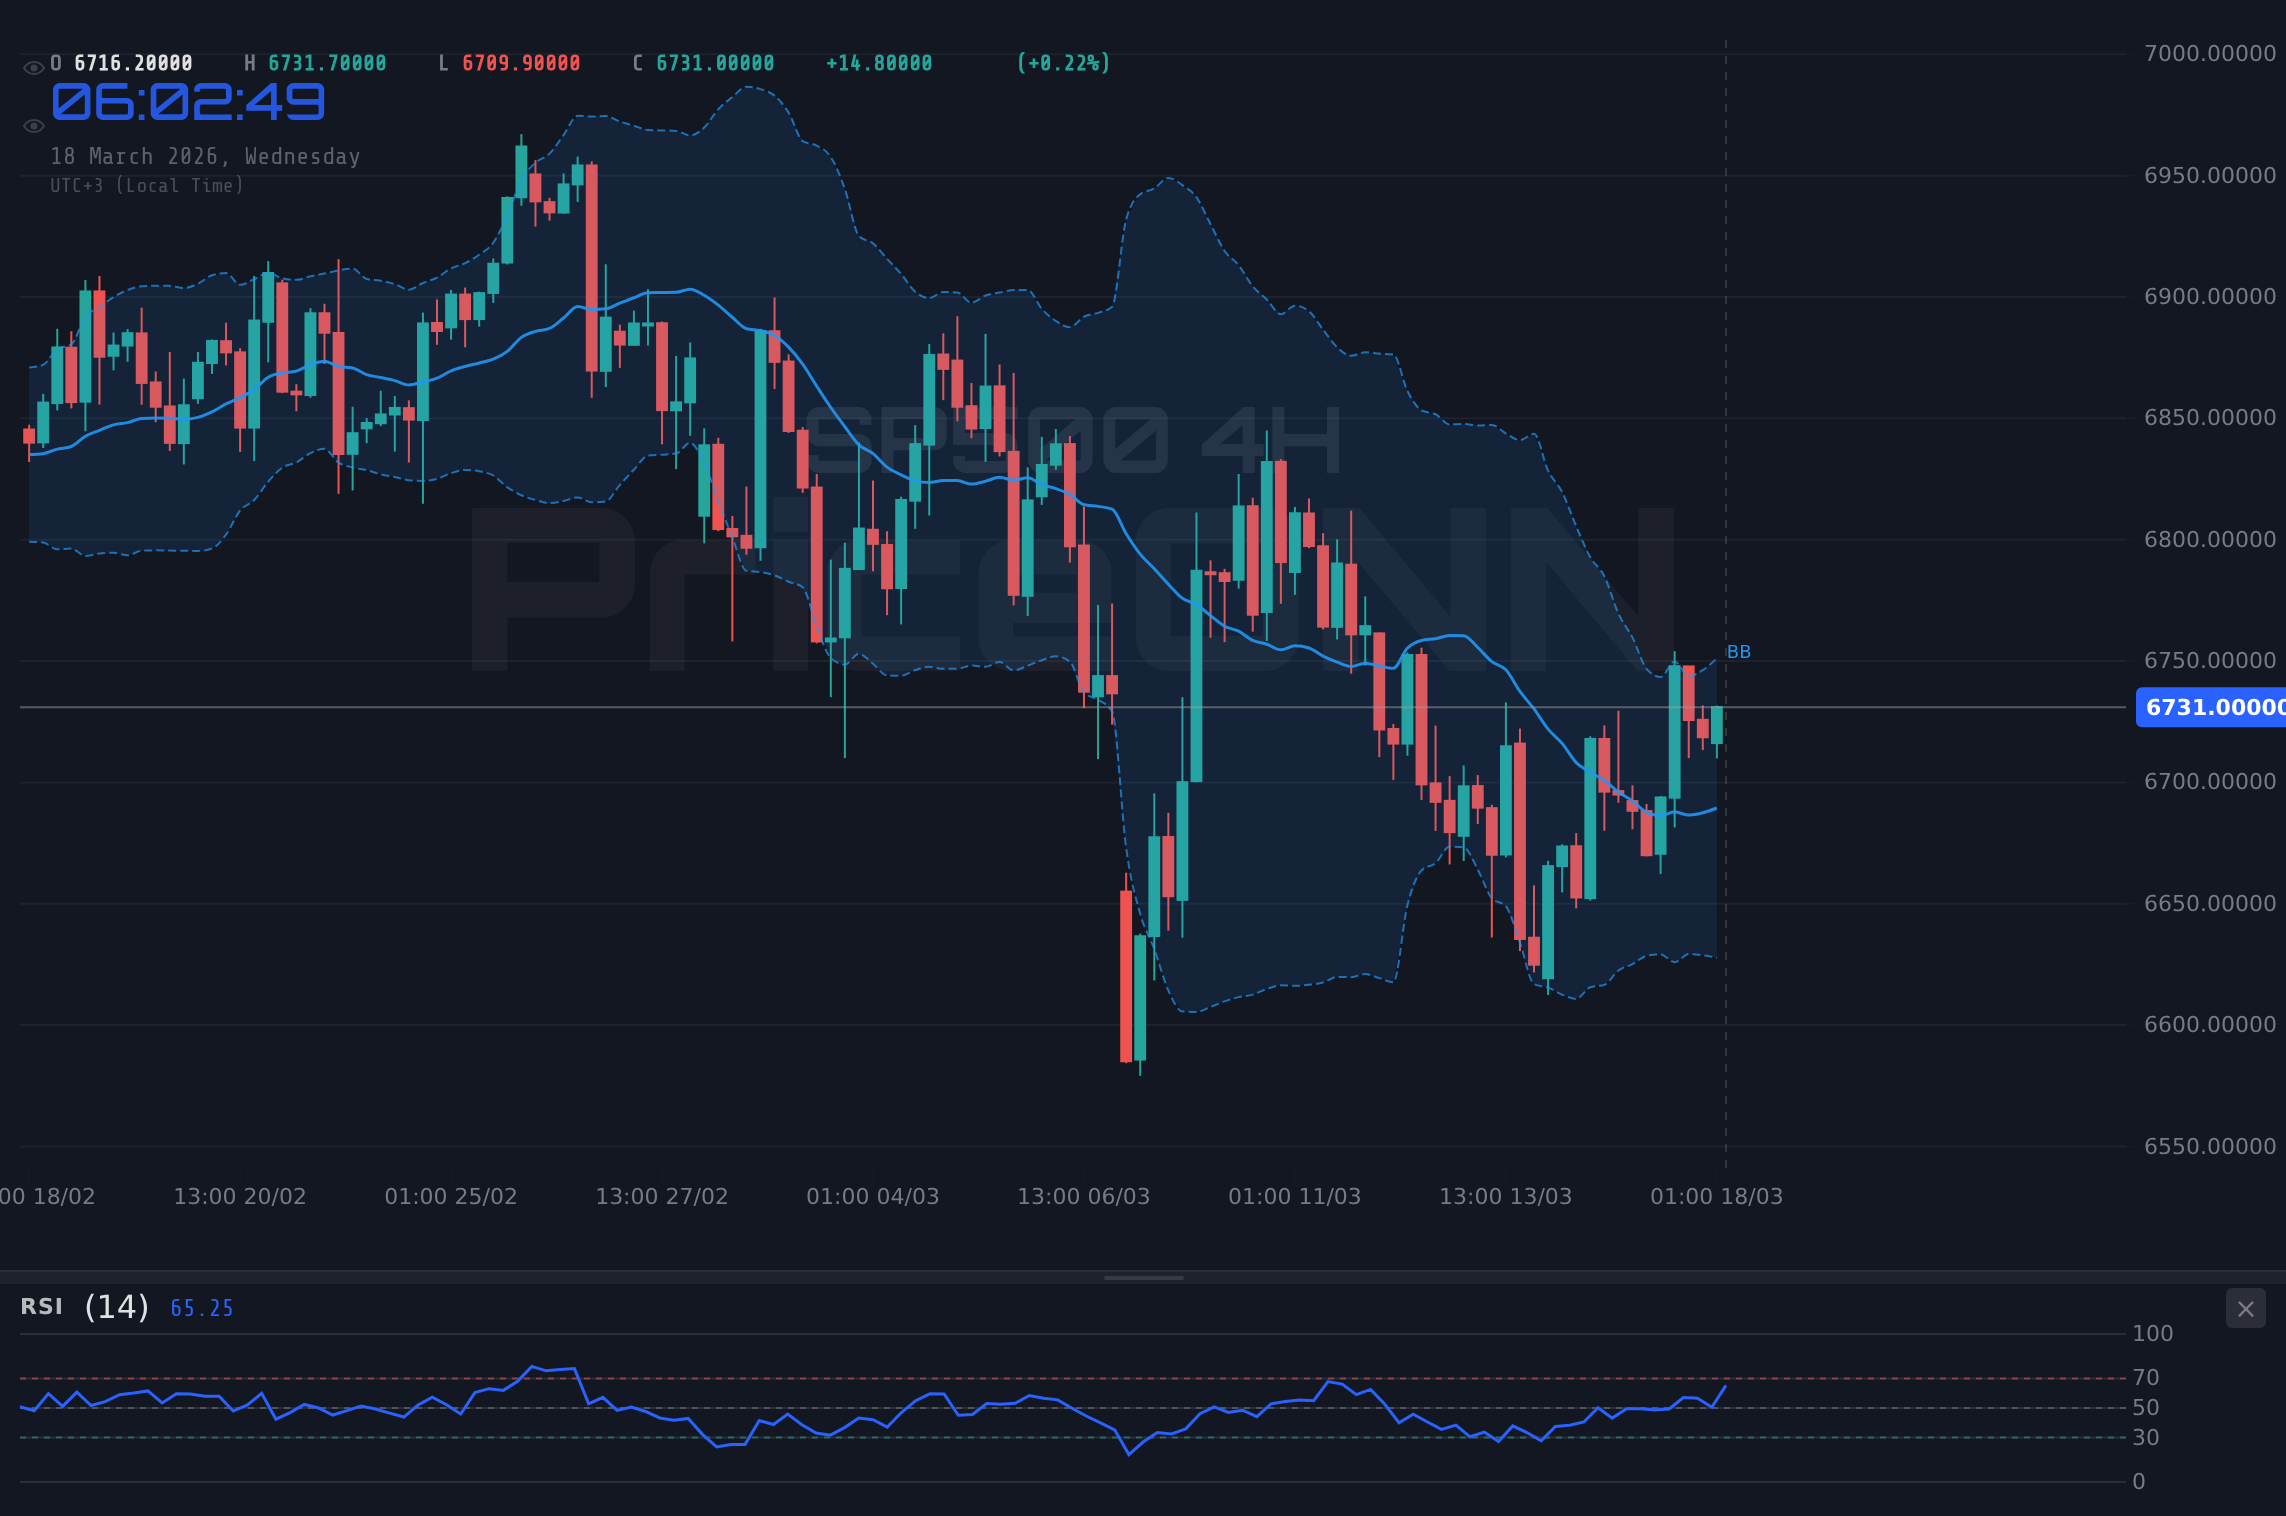
It's also possible that the SP500 could remain range-bound between the $6,757.80 support and the $6,816.07 resistance. This scenario would likely play out if economic data is mixed and geopolitical tensions remain stable. In this case, traders should focus on trading the range, buying near support and selling near resistance. The ADX reading of 22.15 on the 4-hour chart suggests that the index is not currently in a strong trend, which supports the possibility of a range-bound scenario. The Stochastic K=84.47 and D=61.22 on the 4H chart shows that prices are trending up, so traders should keep an eye on these indicators.
For scalpers, a range-bound market provides ample opportunities to profit from small price movements. Swing traders can also benefit by trading the range, but they need to be patient and wait for clear signals before entering positions. Long-term investors should remain neutral in a range-bound market, waiting for a clear breakout or breakdown before making any significant changes to their portfolios.
Most Likely Scenario: Bearish Momentum Building (60% Probability)
Based on the current technical picture and the prevailing market sentiment, the bearish scenario appears to be the most likely outcome. The combination of negative momentum indicators (RSI and MACD), the strengthening dollar, and the potential for disappointing economic data suggests that the SP500 is likely to break below the $6,757.80 support and move towards lower levels. I assign a 60% probability to this scenario, while the bullish and range-bound scenarios are assigned probabilities of 25% and 15%, respectively.
The Dow Jones is also showing a bearish trend with RSI at 34.7, and ADX at 29.53. With the WTI crude oil price at $90.42 and RSI at 77.82, inflation will likely be an issue in the near term which will continue to put pressure on the SP500. USD is also strengthening, which is also negatively correlated to the SP500
Key Triggers to Watch This Week
Several key events and data releases could significantly impact the SP500 this week. Investors should pay close attention to the following triggers:
- Home Sales Data: A better-than-expected report could provide a short-term boost, while a disappointing report could exacerbate the downward pressure.
- Middle East Tensions: Any escalation of tensions could lead to a surge in safe-haven demand for the dollar, weighing on the SP500.
- Federal Reserve Commentary: Any hints from the Fed regarding future interest rate hikes could also impact market sentiment.
Technical Outlook Summary
| Indicator | Value | Signal |
|---|---|---|
| RSI (14) | 52.46 (1H) / 42.56 (1D) | Neutral (1H) / Bearish (1D) |
| MACD Histogram | Positive (1H) / Negative (1D) | Bullish (1H) / Bearish (1D) |
| Stochastic | 56.04 (1H) / 38.07 (1D) | Bearish (1H) / Bearish (1D) |
| ADX | 28.88 (1H) / 33.6 (1D) | Strong Uptrend (1H) / Strong Downtrend (1D) |
| Bollinger | Middle Band | Watch |
Key Levels
Support Levels
Resistance Levels
Frequently Asked Questions: SP500 Analysis
What happens if SP500 breaks below $6,757.80 support?
If the SP500 breaks below the $6,757.80 support level, it could trigger a significant sell-off towards the next support level at $6,640.47. This breakdown scenario is likely to unfold if home sales data disappoints and geopolitical tensions escalate, leading to increased risk aversion.
Should I sell SP500 at current $6,768.70 levels given RSI at 42.56 on the daily chart?
With the RSI at 42.56 on the daily chart, the SP500 is showing increasing bearish momentum. While not yet in oversold territory, this suggests that selling pressure is building. A break below $6,757.80 could confirm the bearish signal and warrant a short position, but always manage your risk with a stop-loss.
What does the negative MACD histogram tell us about SP500 trend analysis?
The negative MACD histogram indicates that the SP500 is experiencing negative momentum, suggesting selling pressure is increasing. This bearish signal aligns with the RSI reading and supports the potential for a breakdown below the $6,757.80 support level. Traders should be cautious and look for confirmation of the bearish trend before entering short positions.
How will the upcoming home sales data affect SP500 this week?
The upcoming home sales data is a key catalyst for the SP500 this week. A better-than-expected report could provide a short-term boost to sentiment, while a disappointing report could exacerbate the downward pressure on the index. The market's reaction to this data will likely determine the SP500's direction in the coming days.
Risk Warning: Trading in financial markets involves risk. Only trade with capital you can afford to lose. Past performance is not indicative of future results. Always conduct thorough research and consult with a qualified financial advisor before making any investment decisions.
Track markets in real-time
AI-powered analysis, technical indicators and real-time price data.
Join Our Telegram Channel
Breaking market news, AI analysis and trading signals instantly.
Join Channel