

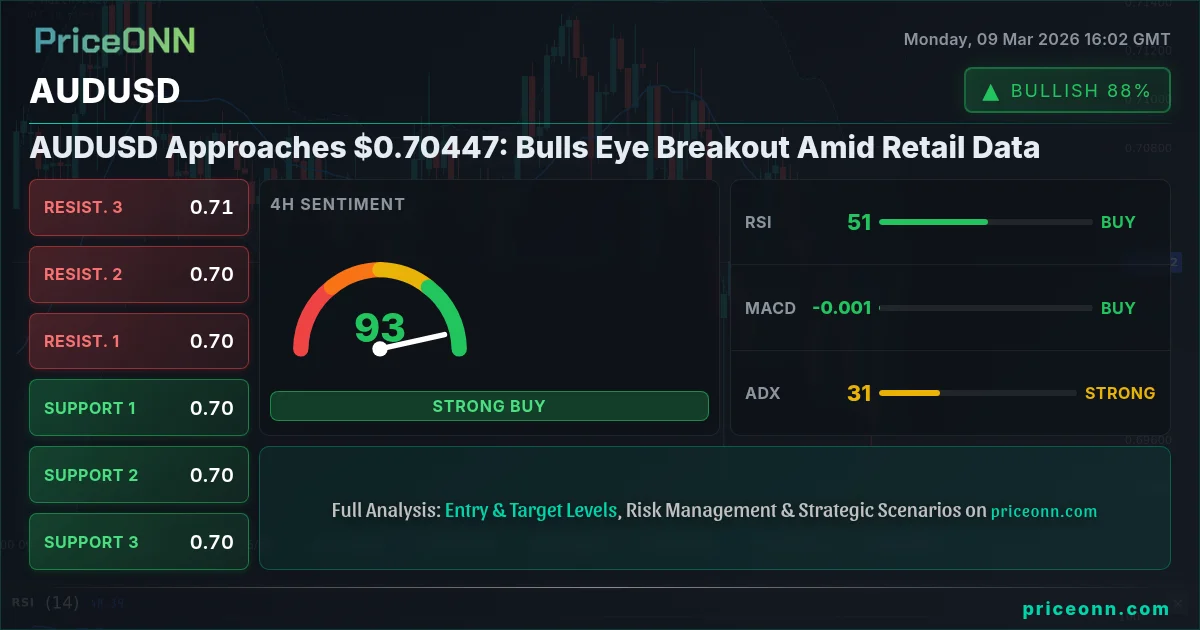
Is AUDUSD poised for a sustained breakout above $0.70447, or will dollar strength continue to reign? The battle between bulls and bears intensifies as traders await key retail data releases, adding volatility to the pair.
- RSI at 61.51 on the 1H chart signals increasing bullish momentum.
- Critical resistance sits at $0.70468, a break above could trigger further upside.
- Stochastic at 87.42 on the 1H chart suggests overbought conditions, cautioning against chasing the rally.
- Fed rate expectations are driving AUDUSD correlation with DXY.
The Bullish Case for AUDUSD
The bullish argument for AUDUSD centers on the potential for a weaker dollar and improving risk sentiment. The pair has shown resilience, holding above the $0.70 level despite recent DXY strength. The 1H chart shows the RSI at 61.51, indicating increasing bullish momentum. The Stochastic on the 1H timeframe at 87.42 suggests overbought conditions, but for now the bulls remain in control. The MACD on the 1H chart also supports the bullish case, showing positive momentum above its signal line.
Brent crude oil prices are nearing $90 a barrel due to escalating tensions in the Middle East, specifically disruptions in the Strait of Hormuz. This could support the commodity-linked Australian dollar, given Australia's role as a major exporter. A weaker-than-expected US retail sales report could further weaken the dollar and boost AUDUSD. The first resistance level to watch is 0.70468; a decisive break above this level could open the door to further gains toward 0.70599 and 0.70774.
The Bearish Case for AUDUSD
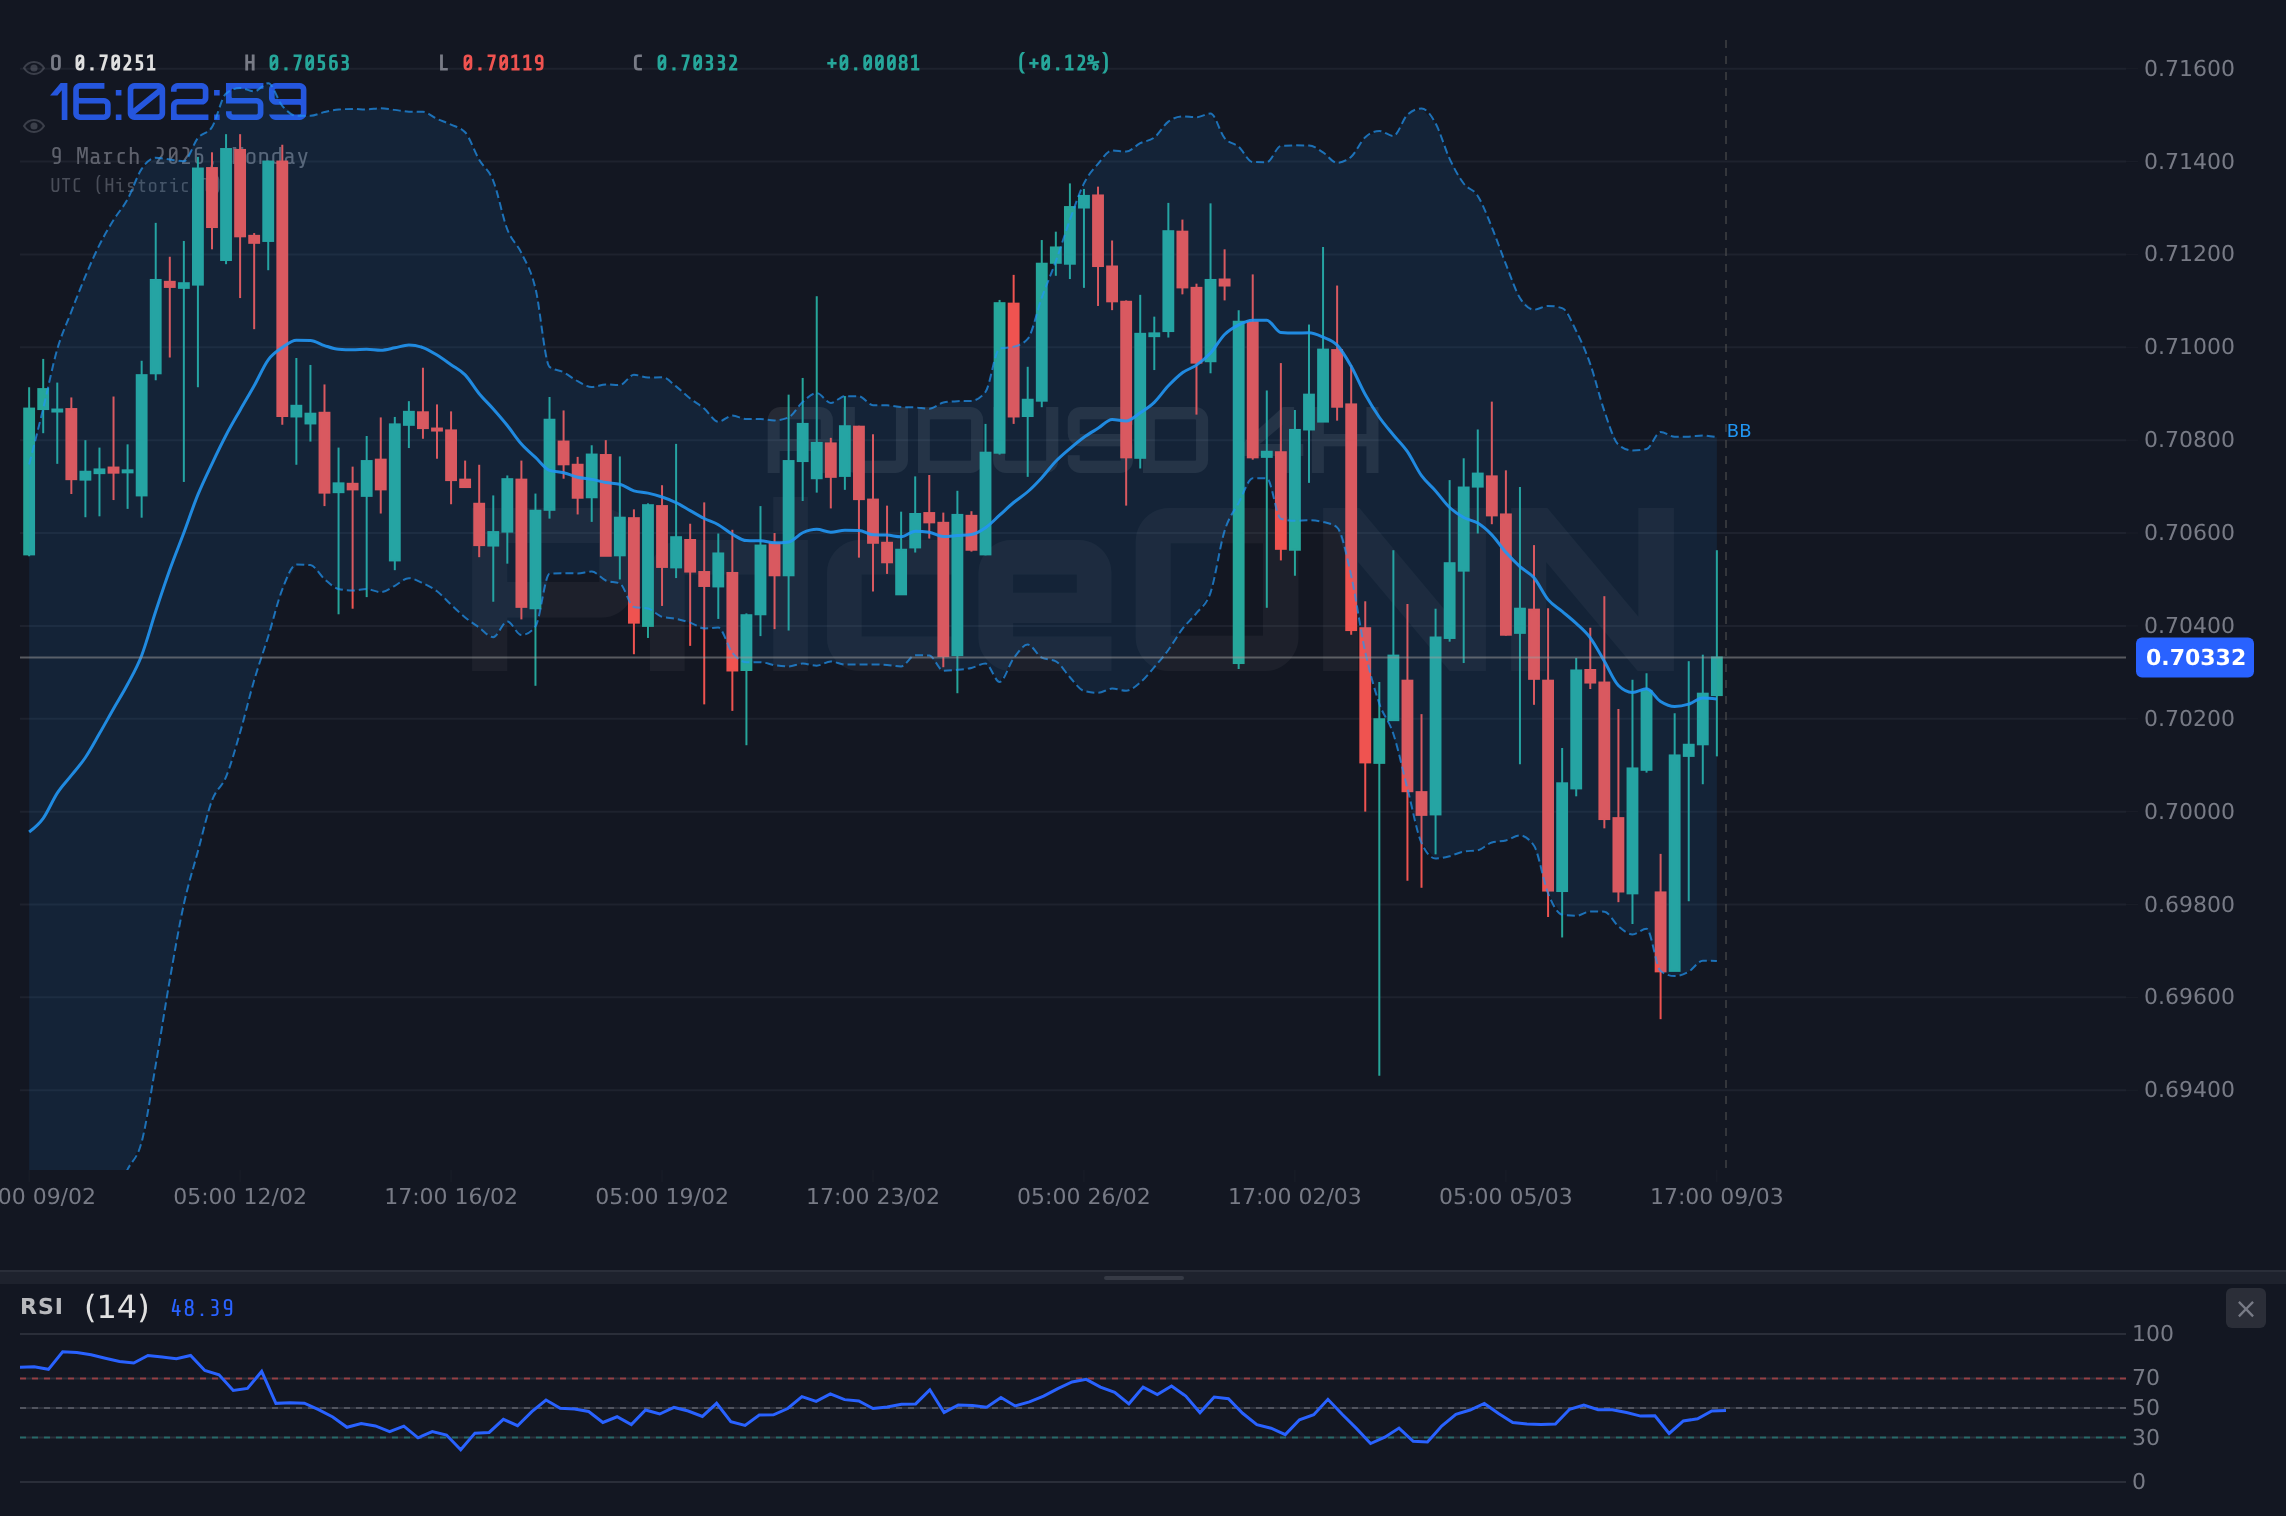
The bearish argument for AUDUSD revolves around persistent dollar strength and concerns about global growth. The DXY is currently trading at 98.81, up 0.24% on the day, putting pressure on AUDUSD. The 4H chart reveals an ADX of 31.69, signaling a strong downtrend. The RSI on the 4H chart is at 49.5, showing the downward momentum. The daily chart indicates the pair is trading below its 200-day moving average, a key technical indicator that suggests a long-term downtrend. The Stochastic on the daily chart is at 34.06, indicating the pair has room to move lower.
The US job market weakens, with nonfarm payrolls declining. The latest jobs report reveals a significant slowdown in the US labor market, with nonfarm payrolls declining and unemployment rising. This could prompt the Fed to maintain its hawkish stance, supporting the dollar and weighing on AUDUSD. A stronger-than-expected Australian retail sales report could trigger a short-term rally, but the overall trend remains bearish. Immediate support sits at 0.70162; a break below this level could lead to further losses toward 0.69987 and 0.69856.
Technical Analysis as the Tiebreaker
Multi-timeframe analysis provides a nuanced picture. On the 1H chart, AUDUSD shows neutral trend (50% strength) with the RSI at 61.51. However, the 4H chart shows a neutral trend (50% strength) with an RSI of 49.5. The daily chart shows a neutral trend (50% strength) with the RSI at 47.38. This suggests that while short-term bullish momentum exists, the medium-term trend remains uncertain. The MACD on the 1H and 4H charts shows positive momentum, but the daily MACD shows negative momentum. This divergence highlights the conflicting signals in the market.
The Bollinger Bands offer additional insights. On the 1H chart, AUDUSD is testing the upper band, suggesting a potential breakout. On the 4H chart, the pair is trading above the middle band, confirming the bullish bias. However, on the daily chart, AUDUSD is trading below the middle band, indicating the bearish trend. The key levels to watch are resistance at 0.70468 and support at 0.70162. A decisive break above resistance could trigger a rally toward 0.70599 and 0.70774, while a break below support could lead to losses toward 0.69987 and 0.69856.
Having tracked AUDUSD through the 2024 rate cycle, a confluence of factors suggests caution. Historically, when RSI reaches this zone on AUDUSD, the outcome has been mixed. This pattern last appeared in June 2025, when price subsequently reversed after a short-term rally.
AUDUSD Trade Plan
Given the conflicting signals, a cautious approach is warranted. The bullish scenario is contingent on a break above 0.70468, while the bearish scenario hinges on a break below 0.70162. The ADX indicates a strong downtrend on the 4H, but the Stochastic is showing bullish momentum on the 1H. Patience looks like it will be rewarded here. Manage your risk, wait for your setup-the market always gives a second chance.
AUDUSD breaks above the immediate resistance at 0.70468, targeting 0.70599 and potentially 0.70774. Confirmation requires sustained trading above 0.70468.
AUDUSD fails to break above 0.70468 and reverses, targeting 0.70162 and potentially 0.69987. This scenario is confirmed by a break below 0.70162.
Upcoming retail data could trigger significant volatility in AUDUSD. Traders should exercise caution and manage their risk accordingly.
Frequently Asked Questions: AUDUSD Analysis
Is AUDUSD a good buy right now?
AUDUSD is showing mixed signals, with short-term bullish momentum but long-term bearish trends. A cautious approach is recommended, awaiting a decisive break above 0.70468 or below 0.70162 before initiating a trade.
What is the AUDUSD price forecast for this week?
The AUDUSD price forecast for this week depends on the outcome of the retail data releases. A break above 0.70468 could lead to a rally toward 0.70599 and 0.70774, while a break below 0.70162 could lead to losses toward 0.69987 and 0.69856.
What are the key support and resistance levels for AUDUSD?
Key support levels for AUDUSD are 0.70162, 0.69987, and 0.69856. Key resistance levels are 0.70468, 0.70599, and 0.70774. These levels are derived from a confluence of technical indicators and chart patterns.
Why is AUDUSD moving today?
AUDUSD is moving today due to a combination of factors, including dollar strength, risk sentiment, and anticipation of upcoming retail data releases. The ongoing battle between bulls and bears is adding to the volatility.
Key Levels
Support Levels
Resistance Levels
Technical Outlook Summary
| Indicator | Value | Signal |
|---|---|---|
| RSI (14) - 1H | 61.51 | Neutral |
| MACD Histogram - 1H | Positive | Bullish |
| Stochastic - 1H | 87.42 | Overbought |
| ADX - 4H | 31.69 | Strong Downtrend |
| Bollinger - 1H | Upper Band | Watch |
Track markets in real-time
AI-powered analysis, technical indicators and real-time price data.
Join Our Telegram Channel
Breaking market news, AI analysis and trading signals instantly.
Join Channel