BRENT Bullish Momentum Builds as $65.73 Holds Ahead of CPI
BRENT crude oil is maintaining its bullish stance, currently trading at $65.73. All eyes are on upcoming CPI data which could fuel further gains.
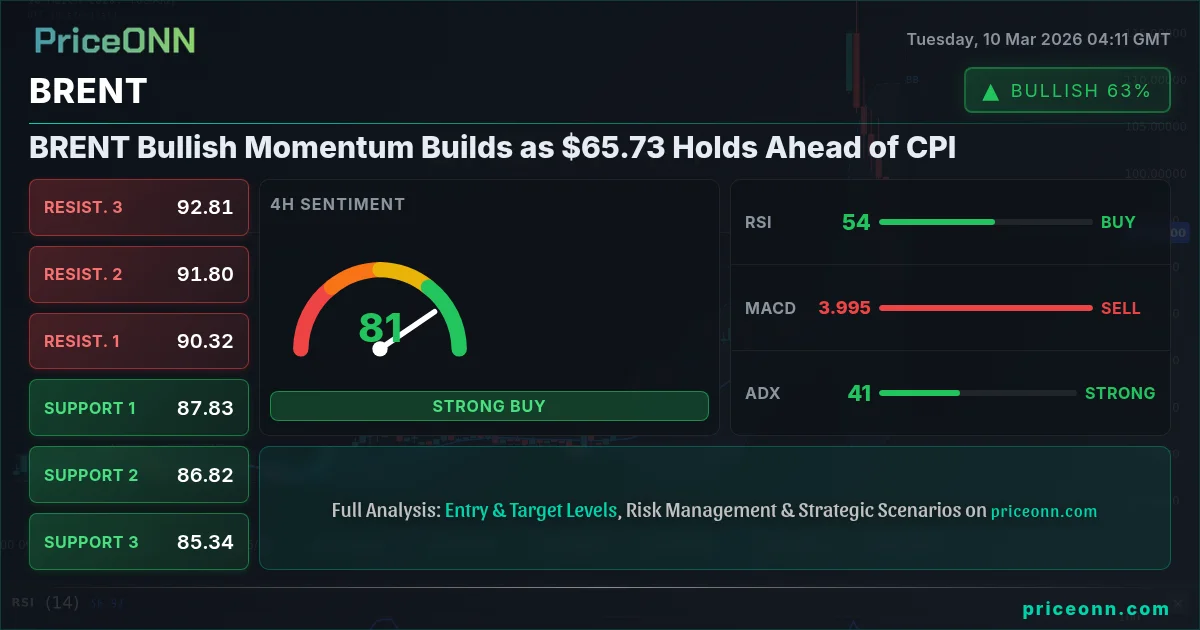
BRENT crude oil finds itself in a precarious position, currently trading at $65.73, a level that has acted as a critical pivot point. The market's attention is keenly focused on the upcoming Consumer Price Index (CPI) data, which could act as a significant catalyst for the next major move. Is this a consolidation phase before a breakout, or are we about to see a reversal?
- RSI at 71.16 on the 1H chart indicates overbought conditions, suggesting a potential pullback.
- The key support level to watch is $65.2, holding above this level is crucial for bullish continuation.
- MACD on the 1H timeframe shows positive momentum, supporting the current bullish trend.
- Upcoming CPI data is likely to be a significant driver for BRENT, influencing its correlation with the DXY.
Navigating Technical Indicators: A Multi-Timeframe Analysis
A deeper dive into the technical indicators reveals a nuanced picture. On the 1-hour timeframe, the Relative Strength Index (RSI) is hovering at 71.16, signaling overbought conditions. This could indicate that the upward momentum is losing steam and a pullback may be imminent. However, it's essential to consider this in conjunction with other indicators.
The Moving Average Convergence Divergence (MACD) on the 1-hour chart paints a more bullish picture, displaying positive momentum and sitting above its signal line. This suggests that, despite the overbought RSI, buyers are still actively participating in the market. Traders should be wary of relying solely on the RSI and instead look for confirmation from other indicators and price action.
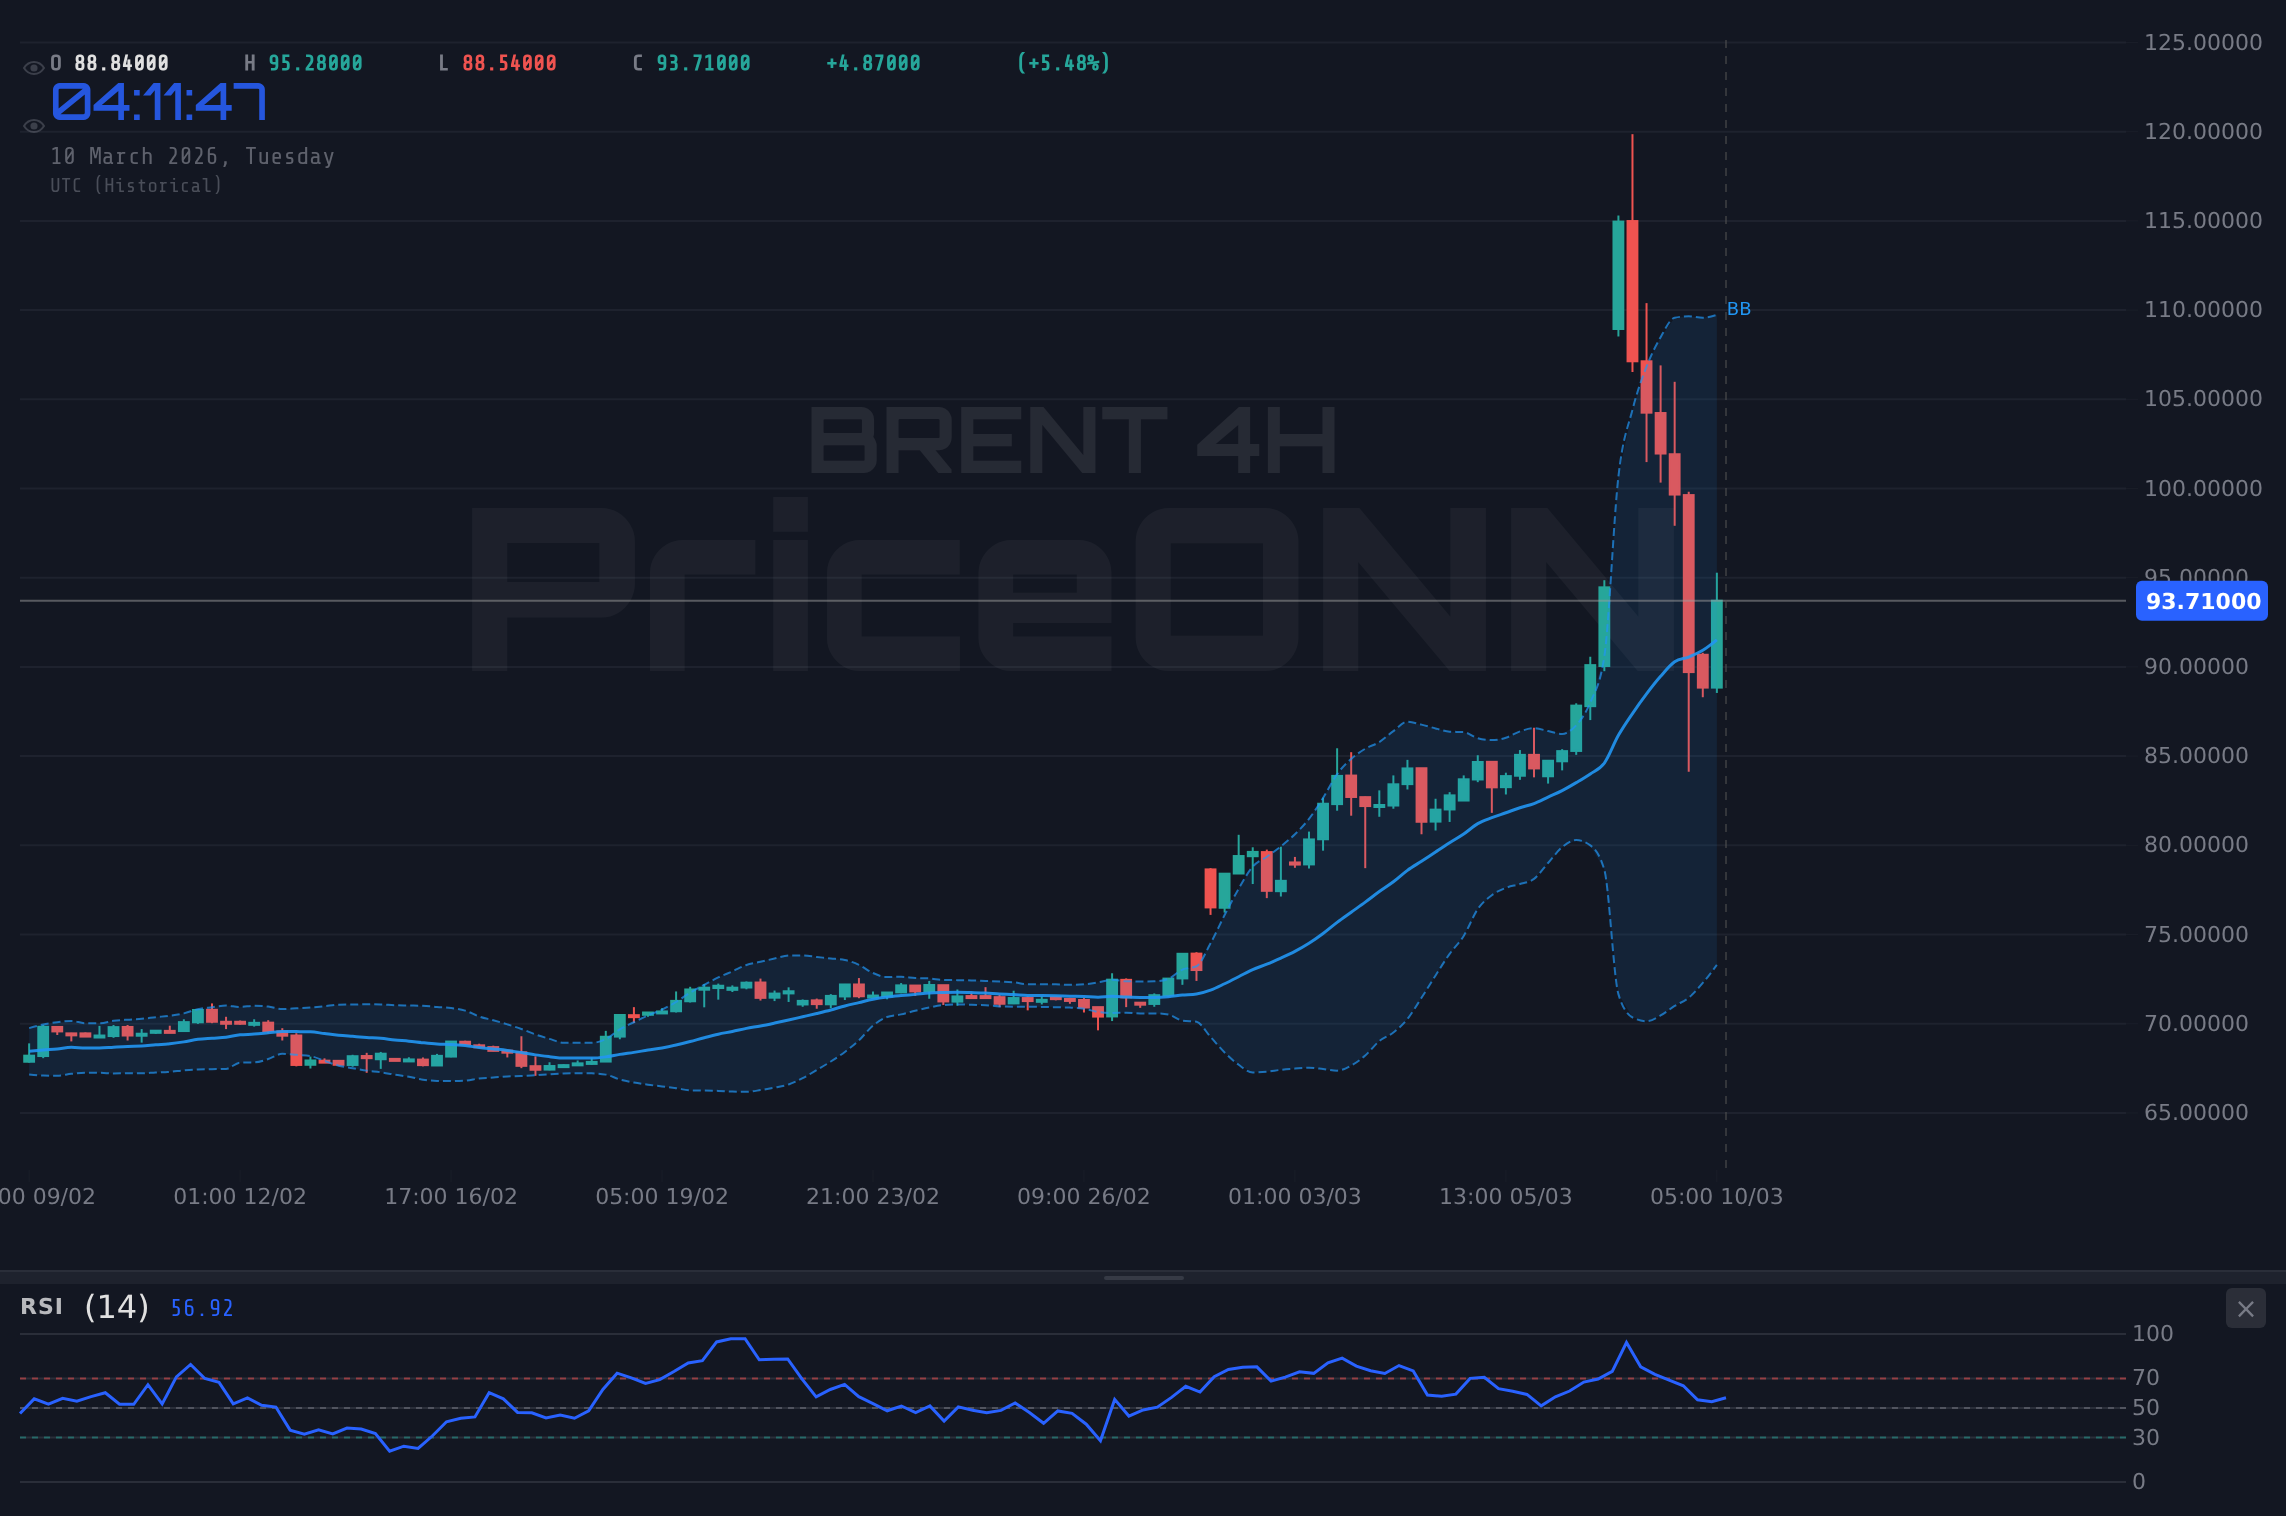
Zooming out to the 4-hour timeframe, the RSI reads 62.33, which is in neutral territory. This suggests that the market is neither overbought nor oversold on this timeframe. The MACD on the 4-hour chart mirrors the 1-hour, showing positive momentum. This alignment across multiple timeframes lends some credence to the bullish bias. However, the ADX on the 4H chart sits at a low 13.59, suggesting a weak trend. This low ADX value warrants caution, indicating that the market might be choppy and lack a clear directional bias.
Looking at the daily chart, the RSI stands at 59.99, also in neutral territory. The MACD continues to show positive momentum, while the ADX reads 28.64, suggesting a strong uptrend. This is where the multi-timeframe analysis becomes crucial. While the daily chart points to a strong uptrend, the 1-hour chart indicates potential overbought conditions. This divergence suggests that while the long-term trend is bullish, short-term pullbacks are possible.
Key Price Levels and Potential Scenarios
Identifying key price levels is paramount for any trader. For BRENT, immediate support lies at $65.2. This level has acted as a reliable floor in recent sessions, and a break below it could signal a shift in sentiment. Further support can be found at $65.1 and $64.99. On the upside, resistance is observed at $65.41, $65.52, and $65.62. A decisive break above these levels would likely pave the way for further gains.
The location of the Bollinger Bands further reinforces these levels. On the 1-hour chart, the price is currently testing the upper band, which aligns with the resistance at $65.41. A sustained move above this band could indicate a strong bullish impulse. Conversely, a failure to break above the upper band, coupled with the overbought RSI, could lead to a test of the middle band, which coincides with the support at $65.2.
The Stochastic oscillator on the 1H chart shows %K at 90.49 and %D at 81.87, both firmly in overbought territory. This reinforces the possibility of a near-term pullback. However, it's important to note that overbought conditions can persist for extended periods in a strong uptrend.
The Impact of Economic Data and Geopolitical Factors
Beyond the technicals, fundamental factors are also at play. The upcoming CPI data is a critical event that could significantly influence BRENT prices. As reported by Reuters, "Fed officials are closely monitoring inflation data for clues about the future path of interest rates." If the CPI comes in higher than expected, it could trigger a stronger dollar and potentially weigh on BRENT. Conversely, a lower-than-expected CPI could weaken the dollar and provide a boost to oil prices.
It's crucial to remember that BRENT is also heavily influenced by geopolitical tensions. As highlighted in recent news, "Escalating geopolitical tensions in the Middle East are contributing to price volatility in the oil market." Any further escalation of these tensions could lead to supply disruptions and a corresponding spike in prices.
Furthermore, the Dollar Index (DXY) is currently trading at 98.68, up 0.32% for the day. A stronger dollar typically exerts downward pressure on BRENT, as oil is priced in dollars. Traders should closely monitor the DXY alongside the CPI data to gauge the potential impact on BRENT.
Correlation Analysis: DXY and Equities
Understanding the correlation between BRENT, the DXY, and equity markets is essential for informed trading decisions. Typically, a stronger dollar (rising DXY) exerts downward pressure on BRENT, as oil is priced in dollars. Conversely, a weaker dollar often provides a tailwind for oil prices.
Currently, the DXY is showing strength, trading at 98.68. This upward momentum in the DXY could potentially cap any significant rallies in BRENT. However, the inverse relationship isn't always absolute, and other factors, such as supply disruptions or strong demand, can override this correlation.
Equity markets, particularly the S&P 500, can also offer insights into BRENT's potential trajectory. A risk-off environment, characterized by a declining S&P 500 (currently at 6766.8), often leads to increased demand for safe-haven assets, potentially weighing on commodities like oil. However, oil prices can sometimes move independently due to specific supply-demand dynamics within the energy sector.
Trading Psychology and Risk Management
Trading psychology plays a crucial role in navigating the complexities of the oil market. The fear of missing out (FOMO) can often lead traders to jump into positions without proper analysis. It's essential to remain disciplined and stick to a well-defined trading plan. As I often tell my clients, “Emotions are the enemy of rational decision-making.”
Risk management is equally important. Traders should always use stop-loss orders to limit potential losses. Position sizing should be carefully considered to avoid overexposure to any single trade. A common mistake is to increase position size after a losing trade in an attempt to recoup losses. This is often a recipe for disaster.
Remember that losses are an inevitable part of trading. The key is to manage those losses effectively and to learn from mistakes. As I've seen with countless traders over the years, self-awareness and emotional control are critical determinants of long-term success.
Economic Calendar: Key Events to Watch
The economic calendar is packed with events that could impact BRENT prices. The high-impact USD data scheduled for release on Wednesday, March 11th, will be closely watched. Specifically, the Previous of 2.4 will be closely scrutinized. Any deviation from expectations could trigger significant volatility in the oil market.
Traders should also pay attention to the GBP data scheduled for release on Friday, March 13th. The previous of 0.1 will be important to monitor. These events can influence currency valuations and, in turn, affect commodity prices.
Frequently Asked Questions: BRENT Analysis
What happens if BRENT breaks above $65.41 resistance?
A decisive break above the $65.41 resistance level could signal a strong bullish impulse, potentially paving the way for further gains towards $65.52 and $65.62. However, traders should be mindful of the overbought RSI on the 1H chart, which could lead to a short-term pullback before the uptrend resumes.
Should I buy BRENT at current levels of $65.73 given RSI at 71.16?
With the RSI at 71.16 on the 1H chart, BRENT is currently in overbought territory, suggesting caution for new long positions at $65.73. It may be prudent to wait for a pullback towards the $65.2 support level before considering an entry, to improve the risk-reward ratio.
Is the positive MACD on the 1H chart a reliable signal for BRENT?
While the positive MACD on the 1H chart suggests bullish momentum, it's important to consider it in conjunction with other indicators. The overbought RSI and the weak trend indicated by the low ADX warrant caution. The MACD signal should be confirmed by price action and other indicators before taking a position.
How will the upcoming USD CPI data affect BRENT this week?
The upcoming USD CPI data is a significant catalyst that could significantly impact BRENT prices. A higher-than-expected CPI could strengthen the dollar and weigh on BRENT, while a lower-than-expected CPI could weaken the dollar and provide a boost to oil prices. Traders should closely monitor the data release and the market's reaction.
Technical Outlook Summary
| Indicator | Value | Signal |
|---|---|---|
| RSI (14) | 71.16 | Overbought |
| MACD Histogram | Positive | Bullish |
| Stochastic | K=90.49, D=81.87 | Overbought |
| ADX | 19.03 | Weak Trend |
| Bollinger | Upper Band | Watch |
Key Levels
Support Levels
Resistance Levels
Track markets in real-time
AI-powered analysis, technical indicators and real-time price data.
Join Our Telegram Channel
Breaking market news, AI analysis and trading signals instantly.
Join Channel