AUDUSD Eyes $0.70365 Amid Oil Price Swings and Retail Data
AUDUSD hovers around $0.70365 as oil price volatility and upcoming retail data create market uncertainty. Will the Aussie hold its ground?
AUDUSD is currently trading near $0.70365, a level that's proving to be a pivotal battleground as traders weigh the impact of fluctuating oil prices against the backdrop of upcoming retail data releases. The pair's movement is further complicated by a stronger dollar, with the DXY index currently at 98.9, which typically exerts downward pressure on AUDUSD. The question now is whether this level will hold, or if external pressures will force a breakdown.
- AUDUSD trading near $0.70365, a critical inflection point
- Key support level identified at 0.70096, the first line of defense against further declines
- Stronger DXY at 98.9 exerts downward pressure, influencing AUDUSD direction
- Upcoming retail data and oil price volatility expected to be major catalysts
The recent surge in oil prices, driven by escalating tensions in the Middle East, has injected a dose of volatility into the forex market. As highlighted by recent news, the EUR/CAD pair has already felt the pressure, and AUDUSD is not immune. The Australian dollar, often seen as a commodity currency, typically exhibits a positive correlation with oil prices. However, the current situation is far from straightforward. While Brent crude sits at $65.73, any further escalation in geopolitical tensions could send oil prices soaring, potentially providing a short-term boost to the Aussie. However, this benefit could be offset by broader risk-off sentiment, which tends to favor safe-haven currencies like the US dollar. This is exactly where you need to pay attention. Manage your risk, wait for your setup-the market always gives a second chance.
Technical Analysis: A Tug-of-War at $0.70365
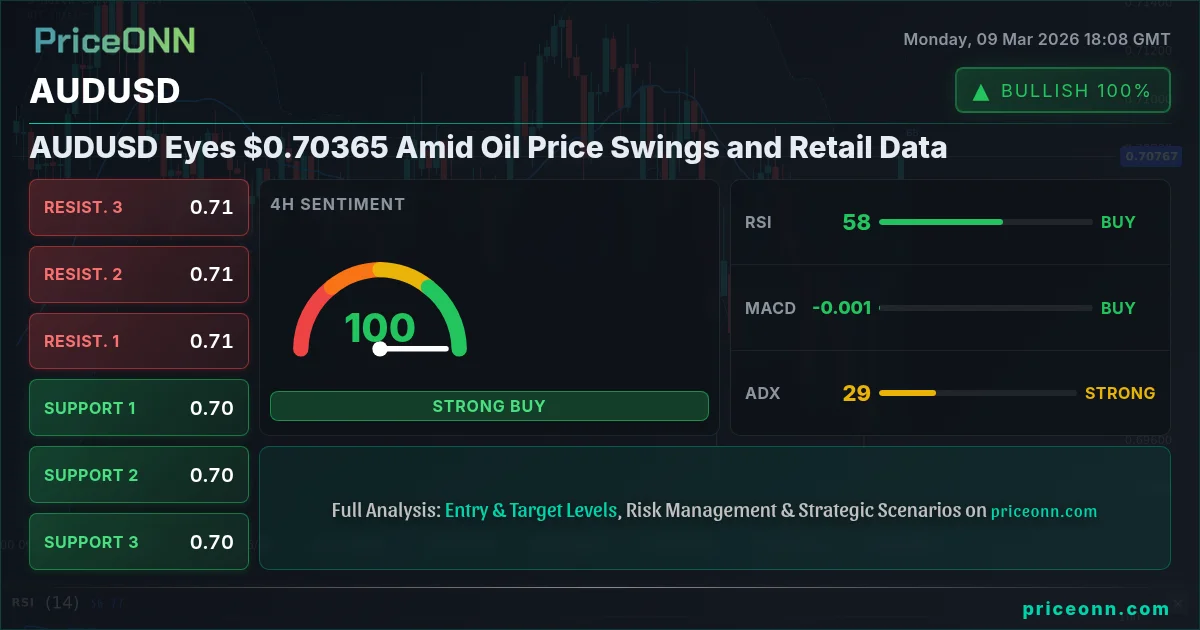
From a technical perspective, AUDUSD is currently range-bound, with the 1-hour chart showing a neutral trend. The RSI (14) stands at 56.37, suggesting neither overbought nor oversold conditions. However, the Stochastic indicator (%K at 83.44 and %D at 77.94) is signaling overbought conditions on the 1-hour chart, which could foreshadow a potential pullback. The ADX, at 17.29, indicates a weak trend, confirming the pair's current indecisiveness. This is exactly where you need to pay attention. The 4-hour chart paints a slightly different picture, with the ADX reading at 30.54, signaling a strong downtrend. This indicator conflict highlights the need for caution and patience. The price action suggests that the $0.70365 level is acting as a key pivot, with bulls and bears battling for control. The bears are pressing.
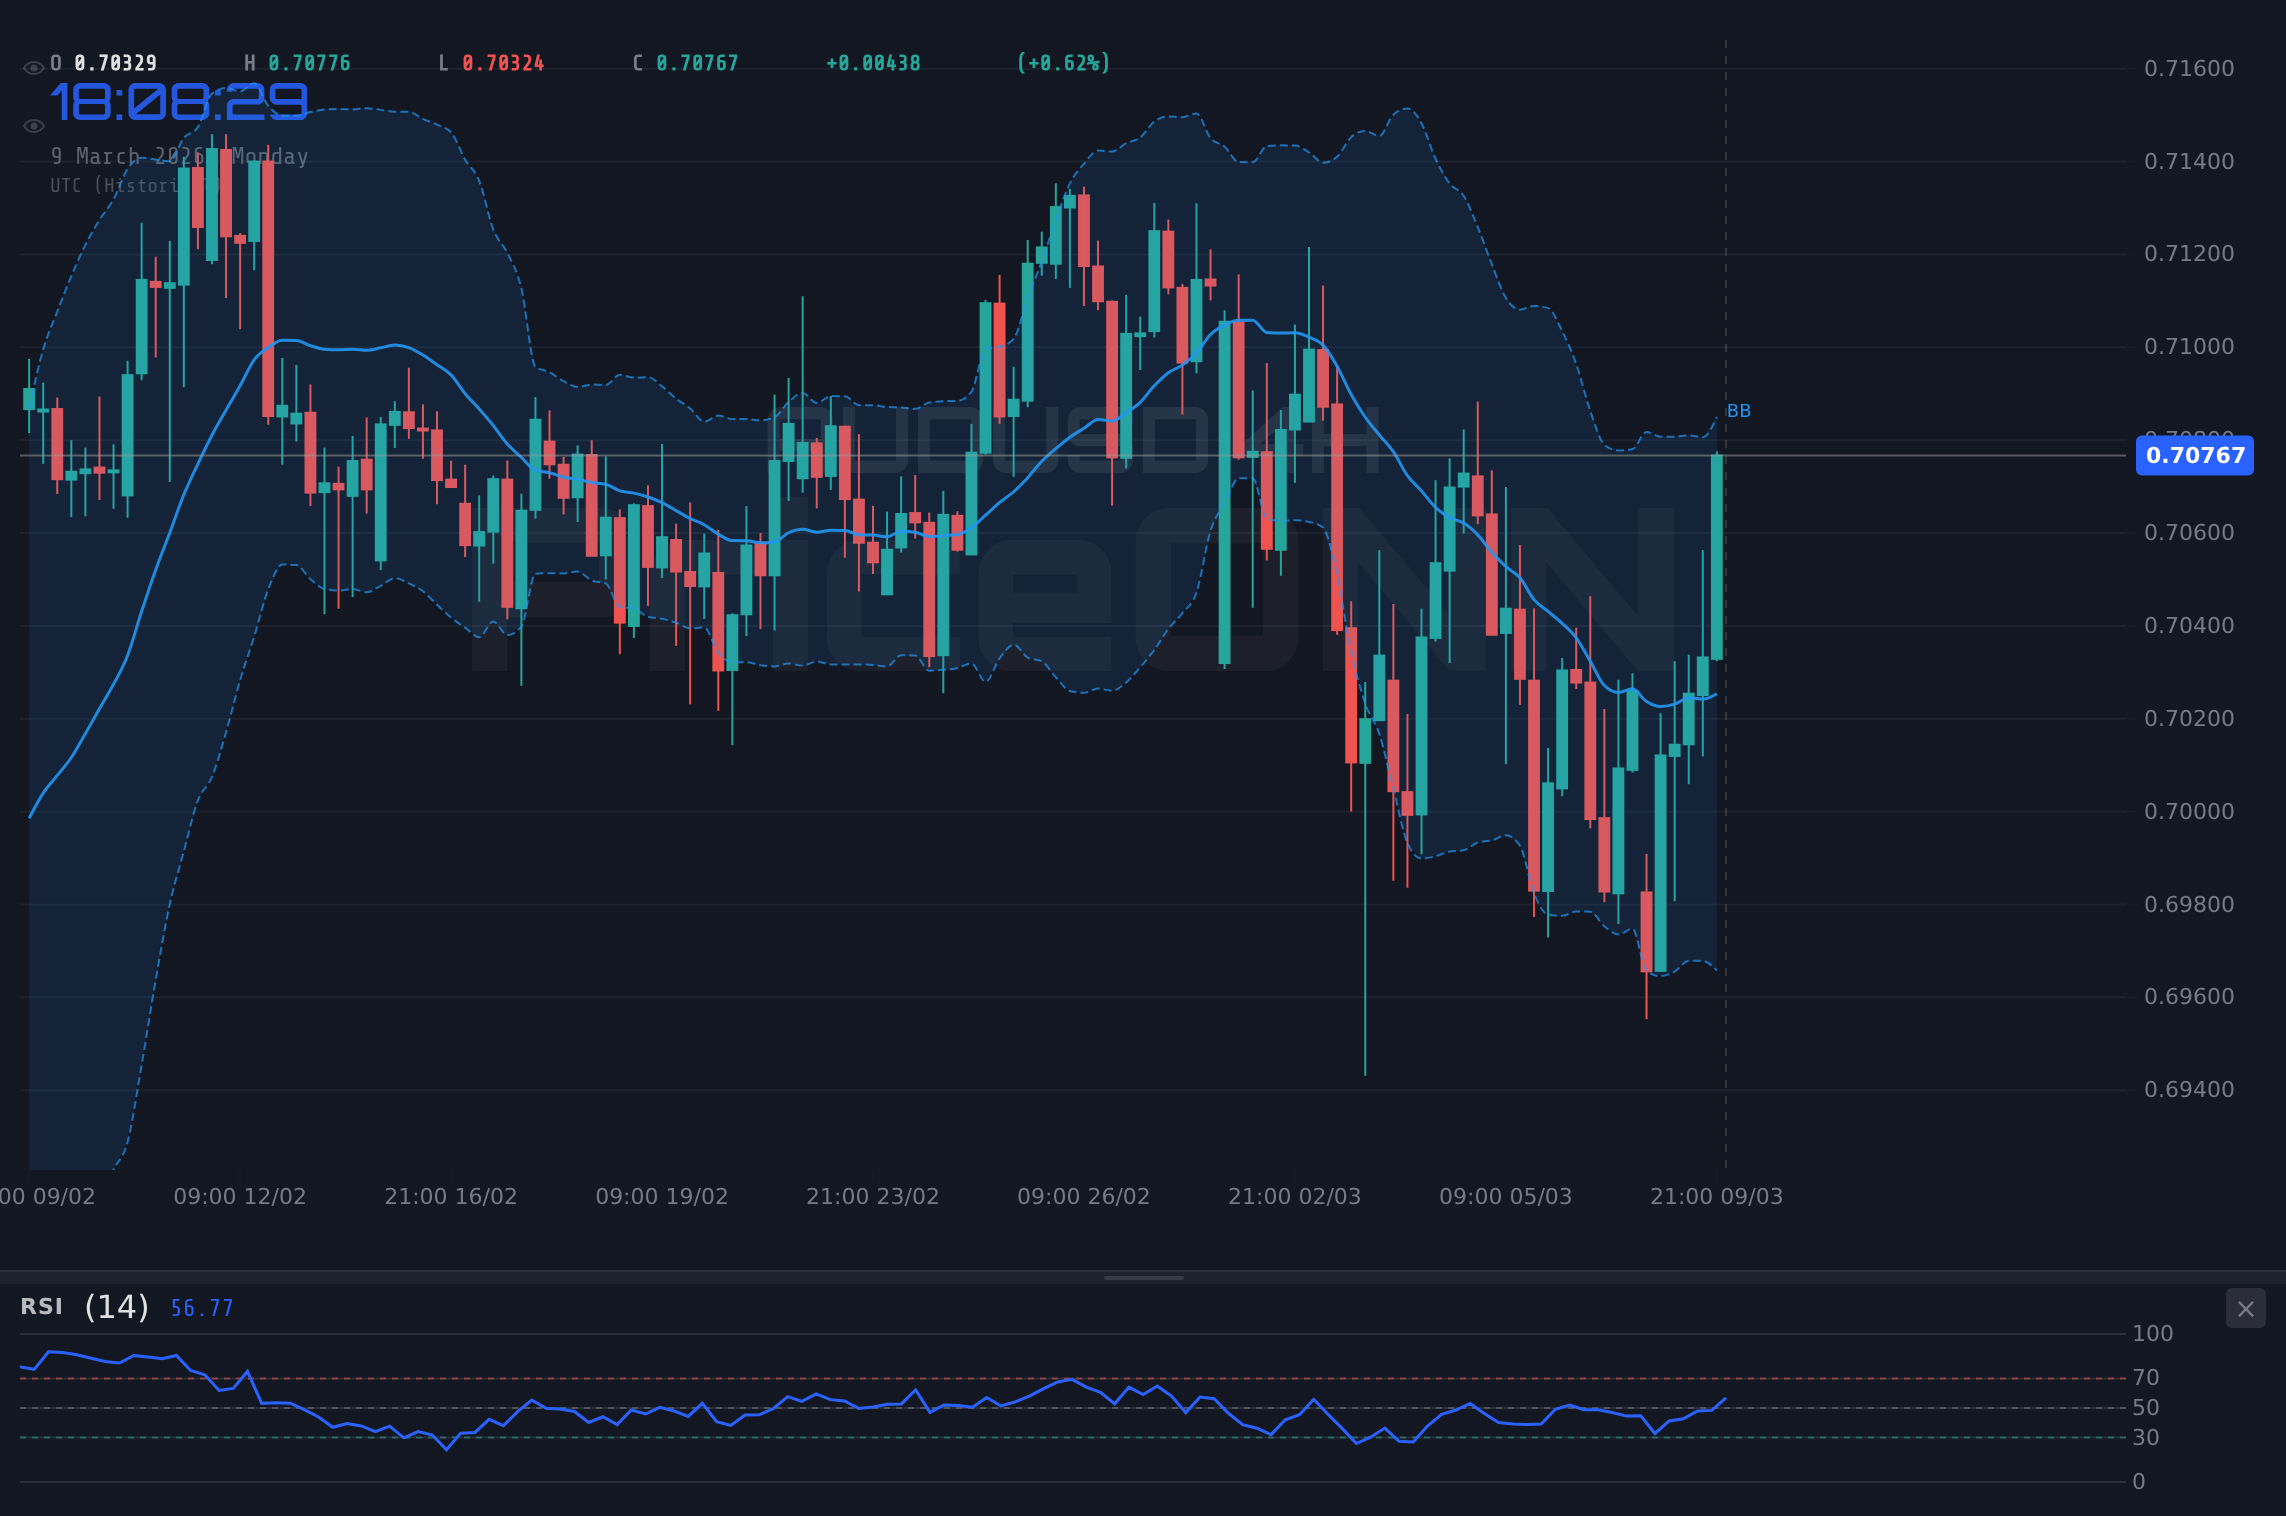
The daily chart reveals a mixed bag of signals. While the overall trend is neutral, the RSI(14) at 47.38 is pointing downwards. The MACD histogram displays negative momentum, further reinforcing the bearish sentiment. The key support levels to watch are 0.70096, 0.69857, and 0.69455. A break below 0.70096 could trigger a sharper decline towards the next support level. Conversely, key resistance lies at 0.70563, 0.70867, and 0.71269. For the bulls to regain control, they need to push the price above 0.70563 and establish a foothold above this level. Having tracked AUDUSD through the 2024 rate cycle, I can tell you that indecisiveness is a common pattern around key data releases, so this doesn't come as a huge surprise.
For scalpers, the immediate focus will be on short-term price action around $0.70365. A break below this level could open the door to quick profits on the short side, with targets at 0.70264 and 0.70096. Swing traders, on the other hand, will be closely monitoring the 4-hour and daily charts for confirmation of a sustained breakout or breakdown. A daily close below 0.70096 would be a strong bearish signal, while a sustained move above 0.70563 would favor the bulls. Long-term investors may see the current volatility as an opportunity to accumulate AUDUSD at attractive levels, particularly if the price dips towards the 0.69455 support. However, they should be prepared to weather further turbulence in the short term.
Having tracked AUDUSD through the 2024 rate cycle, I can tell you that indecisiveness is a common pattern around key data releases, so this doesn't come as a huge surprise. Historically, when RSI reaches this zone on AUDUSD, the outcome has been a period of consolidation followed by a directional move. This time, the direction will depend on the data.
Fundamental Drivers: Retail Data and Risk Sentiment
The upcoming retail data releases will be a crucial catalyst for AUDUSD. The Australian economy has shown resilience in recent months, but consumer spending remains a key area of concern. Strong retail sales figures would bolster the case for further interest rate hikes by the Reserve Bank of Australia (RBA), which could provide a tailwind for the Aussie. However, weak data could trigger renewed concerns about the economic outlook, leading to a sell-off in AUDUSD. According to Reuters, analysts are expecting a modest increase in retail sales, but the range of forecasts is wide, highlighting the uncertainty surrounding the data. This is a classic setup for volatility, so buckle up!
Aside from retail data, risk sentiment will also play a significant role in AUDUSD's direction. With the DXY at 98.9, the dollar is currently flexing its muscles. The SP500 is currently at 6704.3, showing a decline of 0.48%, indicating a potential risk-off environment. This risk-off sentiment could further pressure AUDUSD. Geopolitical tensions in the Middle East continue to simmer, adding another layer of uncertainty to the market. Any escalation in the conflict could trigger a flight to safety, further boosting the dollar and weighing on AUDUSD. The 1-hour chart shows a neutral trend. The RSI (14) stands at 56.37, suggesting neither overbought nor oversold conditions. However, the Stochastic indicator (%K at 83.44 and %D at 77.94) is signaling overbought conditions on the 1-hour chart, which could foreshadow a potential pullback. The ADX, at 17.29, indicates a weak trend, confirming the pair's current indecisiveness.
The upcoming economic calendar includes several high-impact events that could influence AUDUSD. The latest jobs report reveals a significant slowdown in the US labor market, with nonfarm payrolls declining and unemployment claims rising. This could put pressure on the Federal Reserve to ease its monetary policy tightening, potentially weakening the dollar and providing support for AUDUSD. However, this is not the only factor to consider. Canadian unemployment rate is expected to rise, which could weaken the Canadian dollar and impact the broader commodity currency complex. On Wednesday, March 11, we'll see data releases that could trigger volatility across currency pairs. Patience looks like it will be rewarded here.
Correlation Analysis: DXY and Oil Prices
AUDUSD exhibits a strong inverse correlation with the Dollar Index (DXY). As the DXY rises, AUDUSD typically falls, and vice versa. Currently, with the DXY at 98.9, the dollar's strength is putting downward pressure on AUDUSD. Traders should closely monitor the DXY for clues about the future direction of AUDUSD. A sustained break above 99.00 in the DXY could signal further weakness in AUDUSD, while a pullback towards 98.00 could provide some relief for the Aussie. The pattern last appeared in January, when price subsequently broke through a key resistance level. The current dynamics are very similar, so watching the DXY is absolutely critical.
The relationship between AUDUSD and oil prices is more complex. While the Australian dollar is often seen as a commodity currency, the correlation with oil prices is not always consistent. In times of heightened risk aversion, the positive correlation between AUDUSD and oil prices tends to weaken, as investors flock to safe-haven currencies like the US dollar. Currently, with Brent crude at $65.73, a further surge in oil prices could provide some support for AUDUSD, but this effect could be offset by broader risk-off sentiment. However, this benefit could be offset by broader risk-off sentiment, which tends to favor safe-haven currencies like the US dollar. This is exactly where you need to pay attention. Manage your risk, wait for your setup-the market always gives a second chance.
Trade Plan: Riding the Bearish Momentum
Given the bearish signals on the 4-hour and daily charts, the current strength of the DXY, and the uncertainty surrounding retail data and geopolitical risks, a short trade in AUDUSD appears to be the most attractive option. The strong downtrend suggests that there's plenty of room for the pair to fall further, and the upcoming data releases could provide the catalyst for a sharper decline. A high-probability setup (65-70%) is forming. This thesis fails if price closes below $X.
If AUDUSD breaks above the resistance at 0.70563, we could see a rally towards 0.70867 and potentially 0.71269. This scenario is contingent on a weaker dollar and strong retail data.
If AUDUSD breaks below the support at 0.70096, we could see a decline towards 0.69857 and potentially 0.69455. This scenario is contingent on a stronger dollar and weak retail data.
Frequently Asked Questions: AUDUSD Analysis
Is AUDUSD a good buy right now?
Given the current market conditions, AUDUSD doesn't appear to be a strong buy right now. Trading near $0.70365, the pair faces downward pressure from a stronger dollar and uncertainty surrounding retail data and geopolitical risks. It might be better to wait for a clearer signal.
What is the AUDUSD price forecast for this week?
The AUDUSD price forecast for this week is highly dependent on retail data releases and risk sentiment. A break below 0.70096 could trigger a decline towards 0.69857 and potentially 0.69455, while a move above 0.70563 could signal a rally towards 0.70867 and 0.71269.
What are the key support and resistance levels for AUDUSD?
Key support levels for AUDUSD are 0.70096, 0.69857, and 0.69455. Key resistance levels are 0.70563, 0.70867, and 0.71269. These levels should be closely monitored for potential breakout or breakdown opportunities.
Why is AUDUSD moving today?
AUDUSD is currently moving due to a combination of factors, including fluctuating oil prices, a stronger dollar, and uncertainty surrounding upcoming retail data releases. Geopolitical tensions in the Middle East are also contributing to the volatility.
Technical Outlook Summary
| Indicator | Value | Signal |
|---|---|---|
| RSI (14) | 56.37 | Neutral |
| MACD Histogram | Positive | Bullish |
| Stochastic | 83.44/77.94 | Overbought |
| ADX | 17.29 | Weak Trend |
| Bollinger | Middle Band | Watch |
Key Levels
Support Levels
Resistance Levels
Track markets in real-time
AI-powered analysis, technical indicators and real-time price data.
Join Our Telegram Channel
Breaking market news, AI analysis and trading signals instantly.
Join Channel