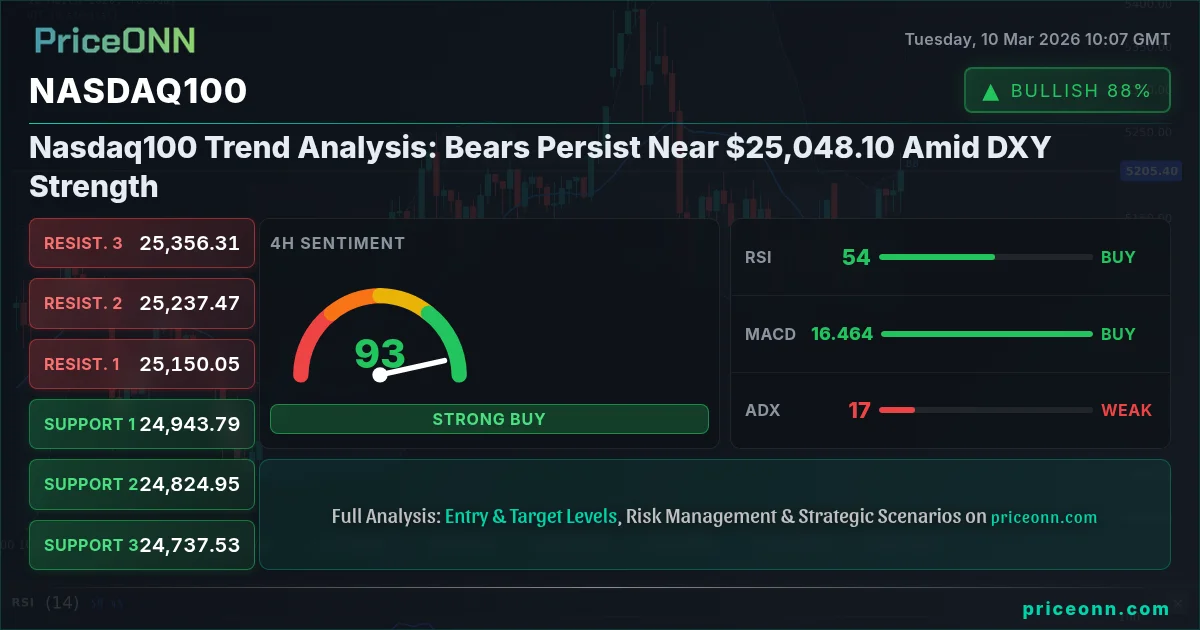
Nasdaq100's trend analysis reveals a persistent bearish outlook, currently trading around $25,048.10. Despite intraday rallies, the index faces headwinds from a robust dollar and lingering concerns about global growth.
- Nasdaq100 faces strong resistance near $25,106.92, capping short-term upside potential.
- Daily RSI at 50.52 indicates further downside momentum unless buyers step in decisively.
- The MACD histogram shows positive momentum, signalling potential for a short-term bounce, but the overall trend remains bearish.
- DXY strength, with the index at 98.4, continues to pressure Nasdaq100, increasing the likelihood of further declines.
The hourly chart shows Nasdaq100 testing the resistance at $25,106.92. A failure to break above this level could lead to a retest of the support at $25,024.31. The hourly RSI, currently at 67.08, suggests that the index is approaching overbought territory, potentially leading to a short-term pullback. However, the ADX at 35.36 indicates a strong uptrend on the hourly timeframe. This conflicting signal suggests caution for intraday traders.
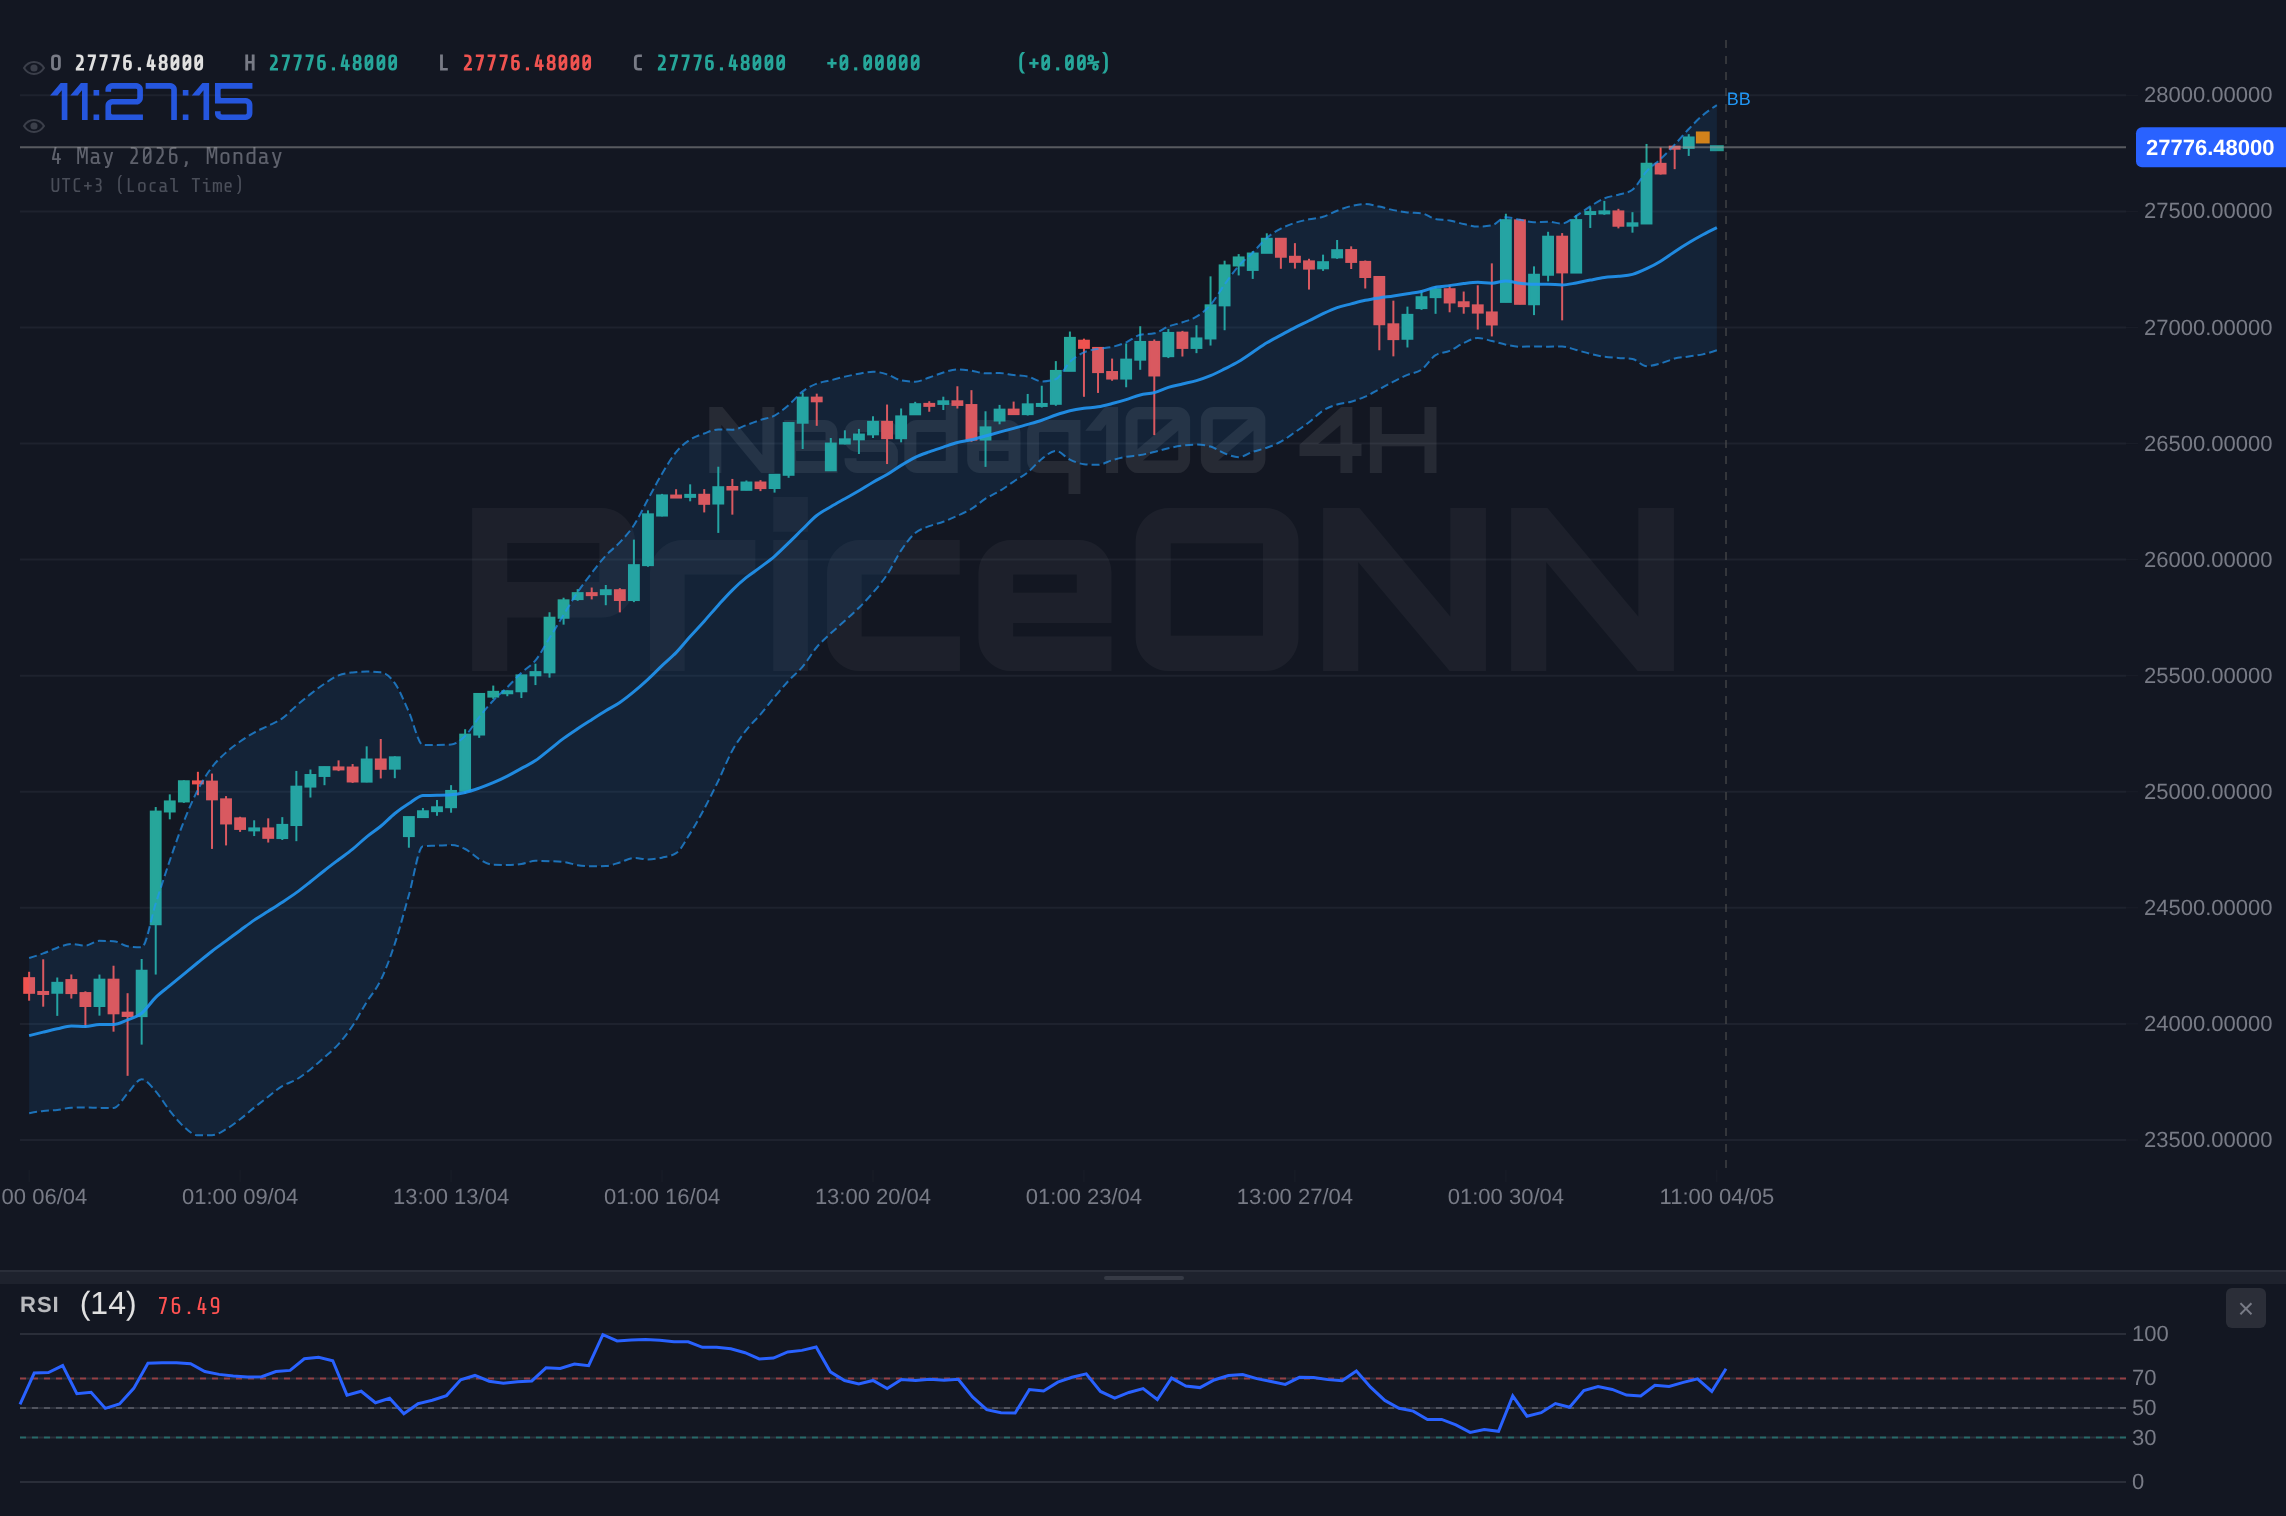
On the 4-hour timeframe, Nasdaq100 is consolidating near the $25,048.10 level. The ADX is at 17.76, indicating a weak trend. This suggests that the consolidation phase could continue in the near term. The 4-hour RSI at 56.99 is in neutral territory, providing limited directional bias. The Stochastic oscillator, however, is showing a K value of 93.06 and D value of 66.04, signalling overbought conditions, potentially setting the stage for a short-term correction.
Zooming out to the daily chart, the trend analysis reveals a more bearish picture. Despite the recent bounce, the index remains below the key resistance at $25,308.11. The daily RSI at 50.52 is in neutral territory but trending downwards, suggesting that the bearish momentum could persist. The MACD, while showing positive momentum, is still below the signal line, indicating that the overall trend remains bearish. The ADX is at 28.37, suggesting a strong downtrend, further reinforcing the bearish bias. The key support level to watch is $24,260.2, a break below which could trigger a more significant selloff.
The Nasdaq100's correlation with the dollar index (DXY) remains a key factor to watch. With the DXY currently at 98.4 and showing signs of strength, Nasdaq100 faces continued headwinds. According to Reuters, the Fed's hawkish stance on inflation is supporting the dollar, further pressuring risk assets like Nasdaq100. The rise in oil prices, currently with WTI at $87.53 per barrel, could also contribute to inflationary pressures, potentially leading to more aggressive monetary policy from the Fed and further downside for Nasdaq100.
From a market sentiment perspective, the Nasdaq100 is facing a mixed picture. While some analysts point to oversold conditions and potential for a short-term bounce, the overall trend remains bearish. As Bloomberg data shows, institutional investors have been reducing their exposure to tech stocks, further contributing to the downward pressure. Given the conflicting signals, traders should exercise caution and wait for clearer directional confirmation before initiating new positions.
Looking at the economic calendar, all eyes are on Wednesday's EUR data release. Stronger-than-expected data could provide some support for the euro, potentially easing the pressure on Nasdaq100. However, the overall focus remains on the US economic outlook and the Fed's policy response. Friday's USD data release will be crucial in determining the near-term direction of the market.
Having tracked Nasdaq100 through various market cycles, it's evident that strong dollar environments often lead to prolonged periods of underperformance for the index. Historically, when the DXY trades above 98, Nasdaq100 tends to struggle, as higher interest rates and tighter financial conditions weigh on growth stocks. This pattern last appeared in late 2025, when a hawkish Fed triggered a significant selloff in the tech sector.
The bearish thesis will be invalidated if Nasdaq100 decisively breaks above the $25,308.11 resistance level on the daily chart. This would require a significant shift in market sentiment and a weakening of the dollar. Until then, the path of least resistance appears to be to the downside.
Frequently Asked Questions: Nasdaq100 Analysis
What happens if Nasdaq100 breaks above $25,106.92 resistance?
A decisive break above $25,106.92 could signal a short-term bullish reversal, potentially leading to a test of the next resistance level at $25,308.11. However, this scenario requires strong confirmation from other indicators and a weakening of the dollar.
Should I buy Nasdaq100 at current levels of $25,048.10 given the daily RSI at 50.52?
Given the neutral RSI and the bearish trend on the daily chart, buying at current levels is risky. It's prudent to wait for a clearer bullish signal, such as a break above $25,106.92 or a significant weakening of the dollar.
Is the positive MACD histogram a reliable buy signal for Nasdaq100?
While the positive MACD histogram suggests increasing bullish momentum, it's important to consider the broader context. The MACD is still below the signal line, and the overall trend remains bearish. Therefore, the MACD signal should be viewed with caution and confirmed by other indicators.
How will Wednesday's EUR data release affect Nasdaq100 this week?
Stronger-than-expected EUR data could weaken the dollar, providing some support for Nasdaq100. However, the overall impact is likely to be limited, as the index's primary driver remains the US economic outlook and the Fed's policy response.
With disciplined risk management, these choppy waters can be navigated safely. Patient investors always find opportunities-the key is waiting for the right moment.
Track markets in real-time
AI-powered analysis, technical indicators and real-time price data.
Join Our Telegram Channel
Breaking market news, AI analysis and trading signals instantly.
Join Channel