XAGUSD, currently trading at $89.30, finds itself at a pivotal juncture as bulls and bears engage in a fierce battle for control. The recent surge in the dollar index (DXY) is placing downward pressure on silver, while underlying inflationary concerns offer some support. The question now is whether silver can hold its ground or succumb to the bearish momentum.
- RSI at 75.2 on the 1H chart signals overbought conditions, hinting at a potential pullback.
- Critical support lies at $86.62, the first line of defense against further declines.
- MACD on the 4H chart shows positive momentum, suggesting underlying bullish strength.
- Rising geopolitical tensions and inflation expectations are driving XAGUSD's correlation with DXY.
The Bull Case for XAGUSD: Inflation Hedge and Industrial Demand
The bull case for XAGUSD rests on two primary pillars: its role as an inflation hedge and its robust industrial demand. With inflation fears simmering, investors often turn to precious metals like silver to preserve their purchasing power. While gold typically grabs the headlines, silver's relative affordability makes it an attractive alternative for smaller investors. Furthermore, silver boasts significant industrial applications, particularly in electronics and solar panels. This dual demand dynamic provides a fundamental underpinning for the metal's price.
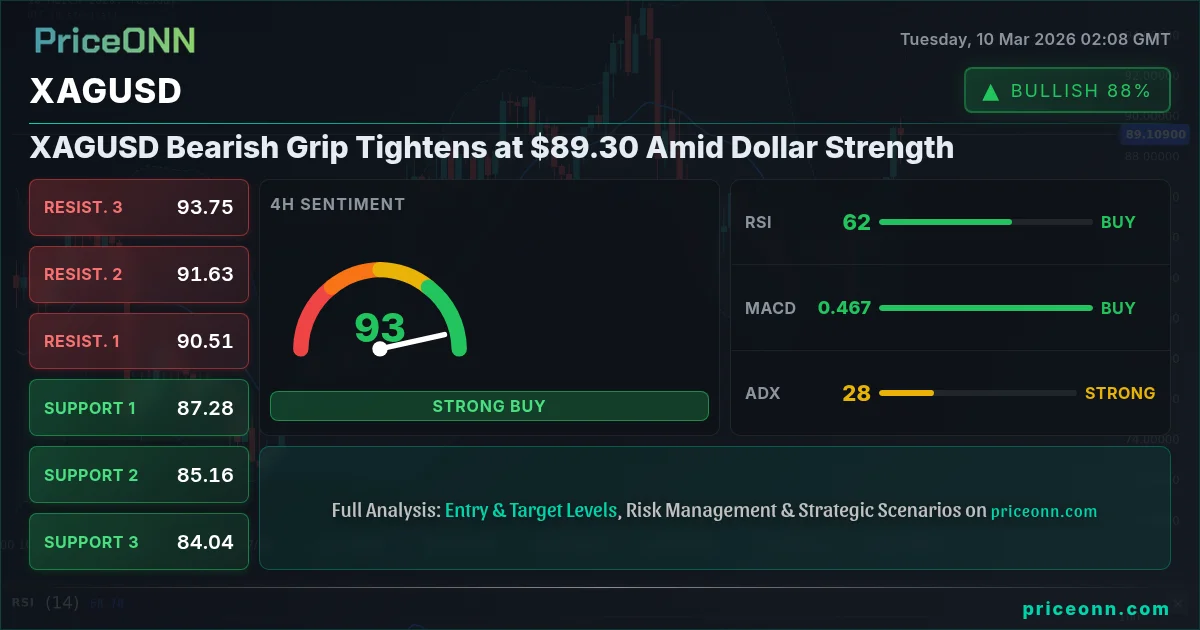
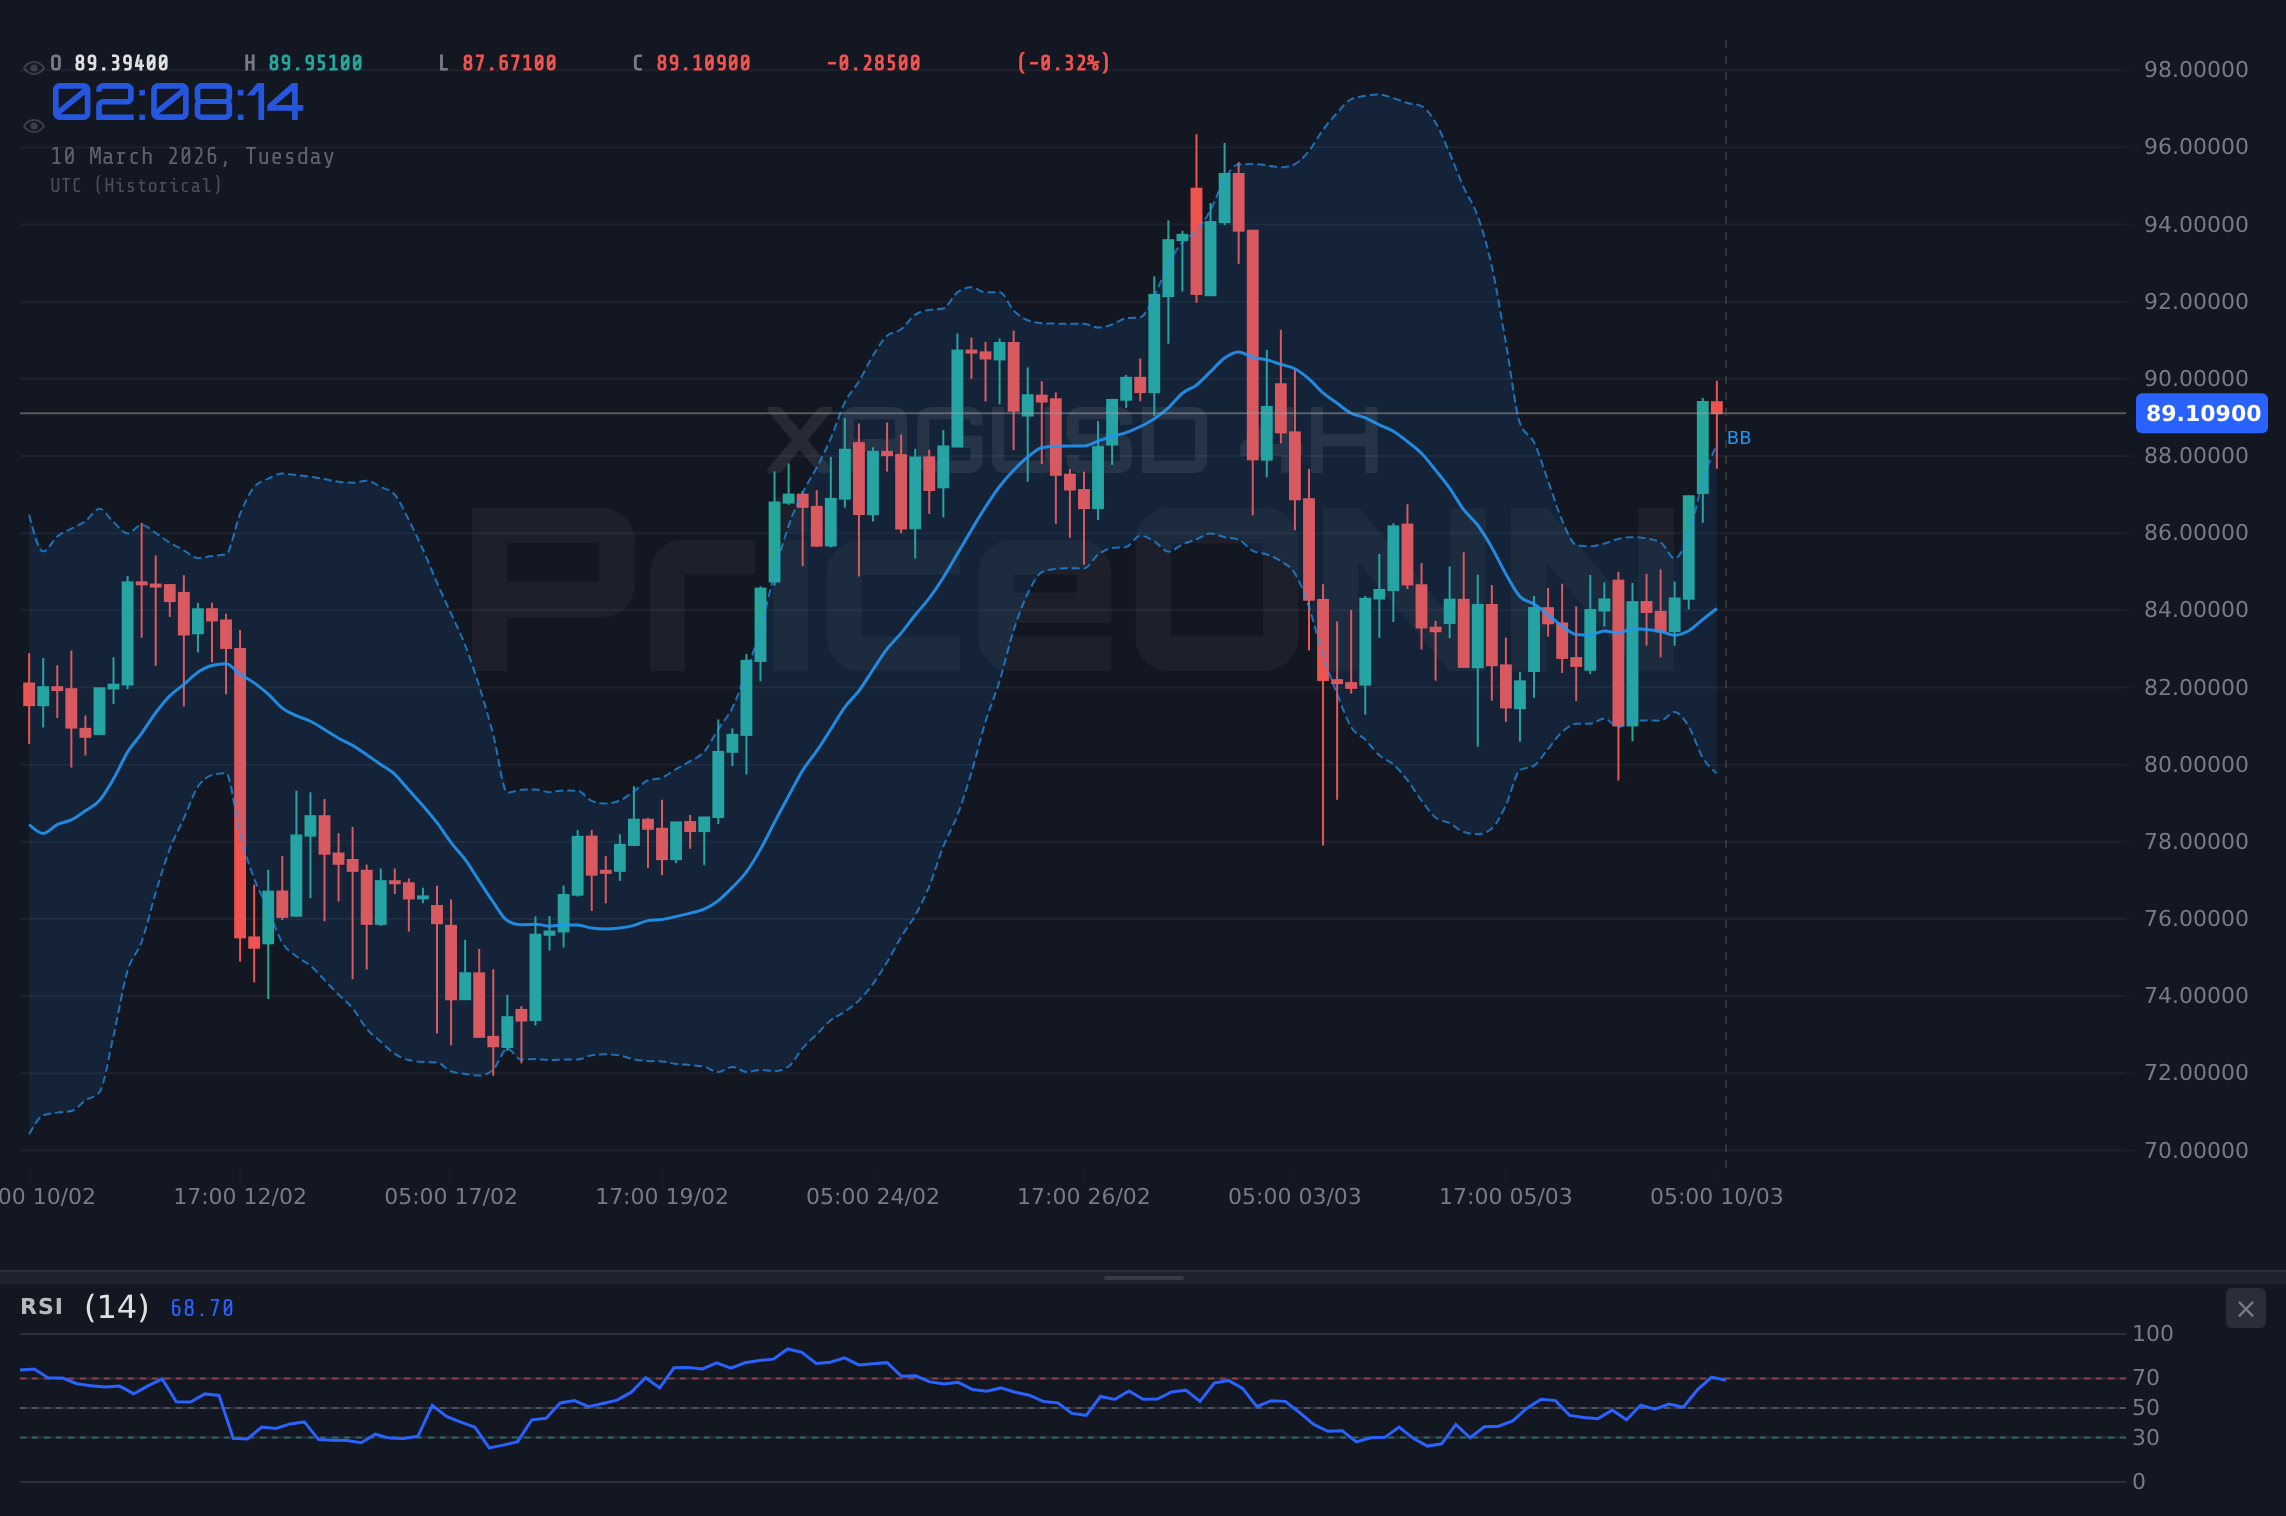
The 4H chart supports the bullish sentiment. The MACD exhibits positive momentum, indicating renewed buying interest. The Stochastic oscillator, with %K at 94.64 and %D at 78.04, signals a potential continuation of the upward trend. However, the RSI at 62.42 remains in neutral territory, leaving room for further gains without immediately triggering overbought conditions.
Moreover, the overall signal on the 4H timeframe is 'AL' (Buy), with 8 out of 8 indicators favoring the upside. This confluence of bullish signals suggests that silver has the potential to break through the immediate resistance at $87.94 and target higher levels. According to Reuters, institutional investors have been increasing their exposure to silver ETFs, further bolstering the bullish narrative.
The Bear Case for XAGUSD: Dollar Strength and Overbought Conditions
Conversely, the bear case centers on the strengthening dollar and short-term overbought conditions. As the dollar index (DXY) continues its ascent, precious metals like silver often face headwinds. A stronger dollar makes silver more expensive for international buyers, dampening demand. Additionally, the recent surge in XAGUSD has pushed several indicators into overbought territory, increasing the risk of a correction. The 1H RSI reading of 75.2 clearly indicates that the market may be due for a breather.
The 1H chart reveals potential weakness. The Stochastic oscillator, with %K at 85.53 and %D at 90.16, is firmly in overbought territory, suggesting that a pullback is likely. The ADX, at 23.13, indicates a moderate uptrend, but not strong enough to sustain the current momentum. The support levels on the 1H chart are $86.62, $86.30, and $85.80. A break below $86.62 could signal a deeper correction.
Adding to the bearish outlook, the daily chart shows the trend as 'Düşüş' (Down), with a strength of 84%. Although the RSI is at 54.33, in neutral territory, the Stochastic Oscillator shows a bearish signal, with %K at 39.82 and %D at 48.51. This conflicting signal warrants caution, as the overall trend might be shifting downwards. The key resistance to watch is $85.58.
According to Bloomberg data, short positions in silver futures have been increasing, indicating that some traders are betting against silver's continued rise. This increased short interest could exacerbate any potential pullback, leading to a sharper decline.
Technicals as the Tiebreaker: Multi-Timeframe Analysis
The technical picture for XAGUSD is mixed, with bullish signals on the 4H chart offset by bearish signals on the 1H and Daily charts. A multi-timeframe analysis is crucial to discern the underlying trend and identify potential trading opportunities. The 4H timeframe offers a more balanced perspective, suggesting that the recent rally may have further to run, albeit with caution.
The key level to watch is $86.62. A decisive break below this level would invalidate the bullish scenario and open the door for a test of the next support at $86.30. Conversely, a sustained move above the resistance at $87.94 would confirm the bullish momentum and pave the way for a test of the higher targets.
The ADX on the 4H chart is at 29.64, indicating a strong upward trend. This suggests that the bulls still have some firepower left, but they need to overcome the immediate resistance to regain control. The EUR/CAD currency pair plunged amidst dollar strength, according to recent Forex news, which could influence the price of XAGUSD as well.
XAGUSD Trade Plan: Riding the Bull, Respecting the Bear
Given the mixed technical picture, a cautious approach is warranted. Here's a potential trade plan for XAGUSD, incorporating both bullish and bearish scenarios:
XAGUSD breaks above $87.94 resistance, fueled by continued dollar weakness and persistent inflation fears. Targets include $88.93 and $90.89.
XAGUSD fails to hold $86.62 support, succumbing to dollar strength and profit-taking. Targets include $86.30 and $85.80.
Probability assessment: The bullish scenario carries a 55% probability, given the underlying inflationary pressures and industrial demand. However, the bearish scenario cannot be ignored, particularly if the dollar index (DXY) continues its ascent.
The US CPI data expected Wednesday, March 11th could provide the next major catalyst for XAGUSD. Higher-than-expected inflation could boost the bull case, while lower-than-expected inflation could strengthen the dollar and weigh on silver.
Risk Management: Position Sizing and Stop-Loss Placement
As with any trade, proper risk management is paramount. Position sizing should be determined based on your risk tolerance and account size. A general guideline is to risk no more than 1-2% of your capital on any single trade. Stop-loss orders should be placed strategically to protect against unexpected market moves. For the bullish scenario, a stop-loss could be placed just below the $86.62 support level. For the bearish scenario, a stop-loss could be placed just above the $87.94 resistance level.
Remember, the market can be unpredictable. Even the best trade setups can fail. The key is to manage your risk, protect your capital, and wait for the right opportunities.
Technical Outlook Summary
| Indicator | Value | Signal |
|---|---|---|
| RSI (14) | 75.2 | Overbought |
| MACD Histogram | Positive | Bullish |
| Stochastic | 85.53/90.16 | Overbought |
| ADX | 23.13 | Weak Trend |
| Bollinger | Upper Band | Watch |
Key Levels
Support Levels
Resistance Levels
Frequently Asked Questions: XAGUSD Analysis
Is XAGUSD a good buy right now?
XAGUSD at $89.30 is at a crucial point. A break above $87.94 could signal a buy, but be cautious of overbought conditions and watch the DXY.
What is the XAGUSD price forecast for this week?
This week's XAGUSD price forecast targets $88.93 if the bullish trend continues. However, a break below $86.62 could lead to a test of $86.30, with a 55% probability for the bullish scenario.
What are the key support and resistance levels for XAGUSD?
Key support levels for XAGUSD are $86.62, $86.30, and $85.80, while key resistance levels are $87.43, $87.94, and $88.25, according to current market data.
Why is XAGUSD moving today?
XAGUSD is moving today due to a combination of dollar strength and inflation fears. The upcoming US CPI data on Wednesday could provide further direction.
Track markets in real-time
AI-powered analysis, technical indicators and real-time price data.
Join Our Telegram Channel
Breaking market news, AI analysis and trading signals instantly.
Join Channel