

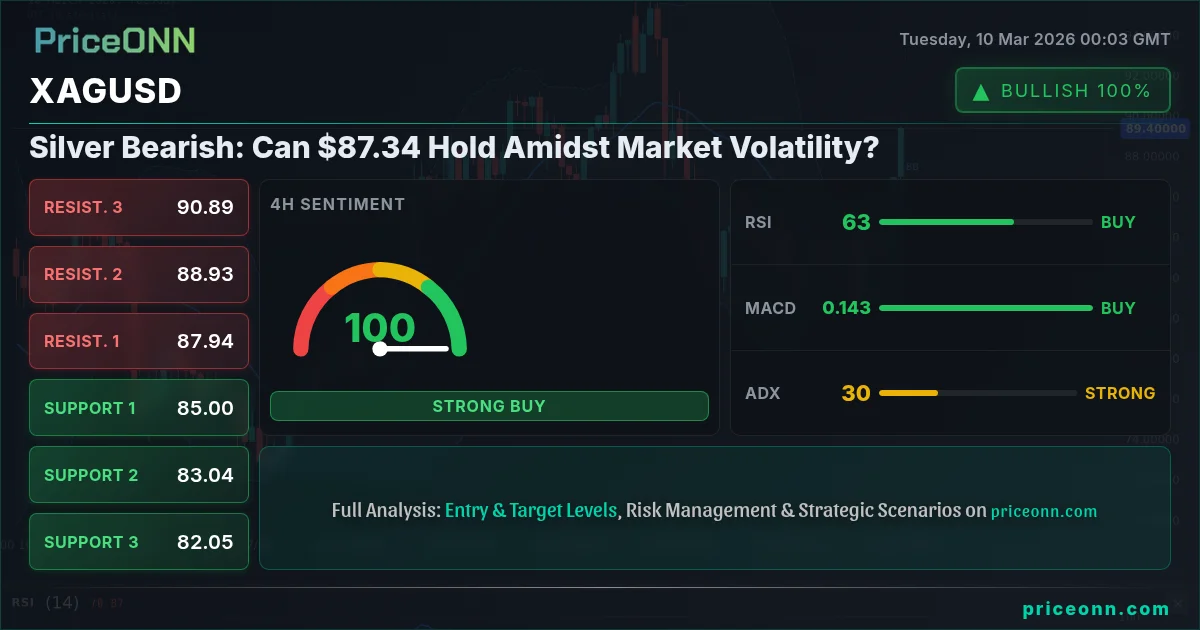
Silver (XAGUSD) is currently trading around $87.34, a level that could determine its short-term trajectory. The tug-of-war between bullish and bearish forces is evident, making a deeper dive into technicals essential for traders. Several factors are contributing to the current market uncertainty, including fluctuating oil prices and geopolitical tensions. Can silver hold its current level, or are we about to see a significant correction?
- RSI at 70.37 on the 1H chart suggests overbought conditions, potentially signaling a pullback.
- Key support level lies at $86.64, a break below which could trigger further downside.
- MACD remains positive, but the histogram shows signs of weakening momentum.
- Geopolitical tensions and fluctuating oil prices are adding to the volatility in XAGUSD.
The Bull Case for Silver
The bullish argument for silver hinges on several factors. First, silver's industrial demand remains robust. As highlighted by recent keyword analysis, the percentage of industrial demand compared to gold is a key factor for investors. The current price of $87.34 may attract buyers looking for undervalued assets, particularly if they anticipate increased industrial activity. The 4H chart shows a positive MACD, supporting bullish momentum. If XAGUSD can maintain its position above $86.64, the bulls could push the price towards the resistance level of $87.88. Furthermore, the overall sentiment in precious metals remains positive, with gold also showing strength. The daily chart shows the price is still trending up in general.
Adding to the bullish narrative is the potential for increased safe-haven demand. With global economic uncertainties and geopolitical tensions on the rise, investors often flock to precious metals like silver as a store of value. If the SP500 continues to show weakness, as indicated by its daily chart trend, silver could benefit from increased risk aversion. Brent crude oil is currently trading near $65.73, showing a strong bullish trend on the daily chart. This could signal inflationary pressures, further supporting silver prices. As the dollar index (DXY) trades at 98.5, any further weakening could provide additional tailwinds for silver.
The Bear Case for Silver
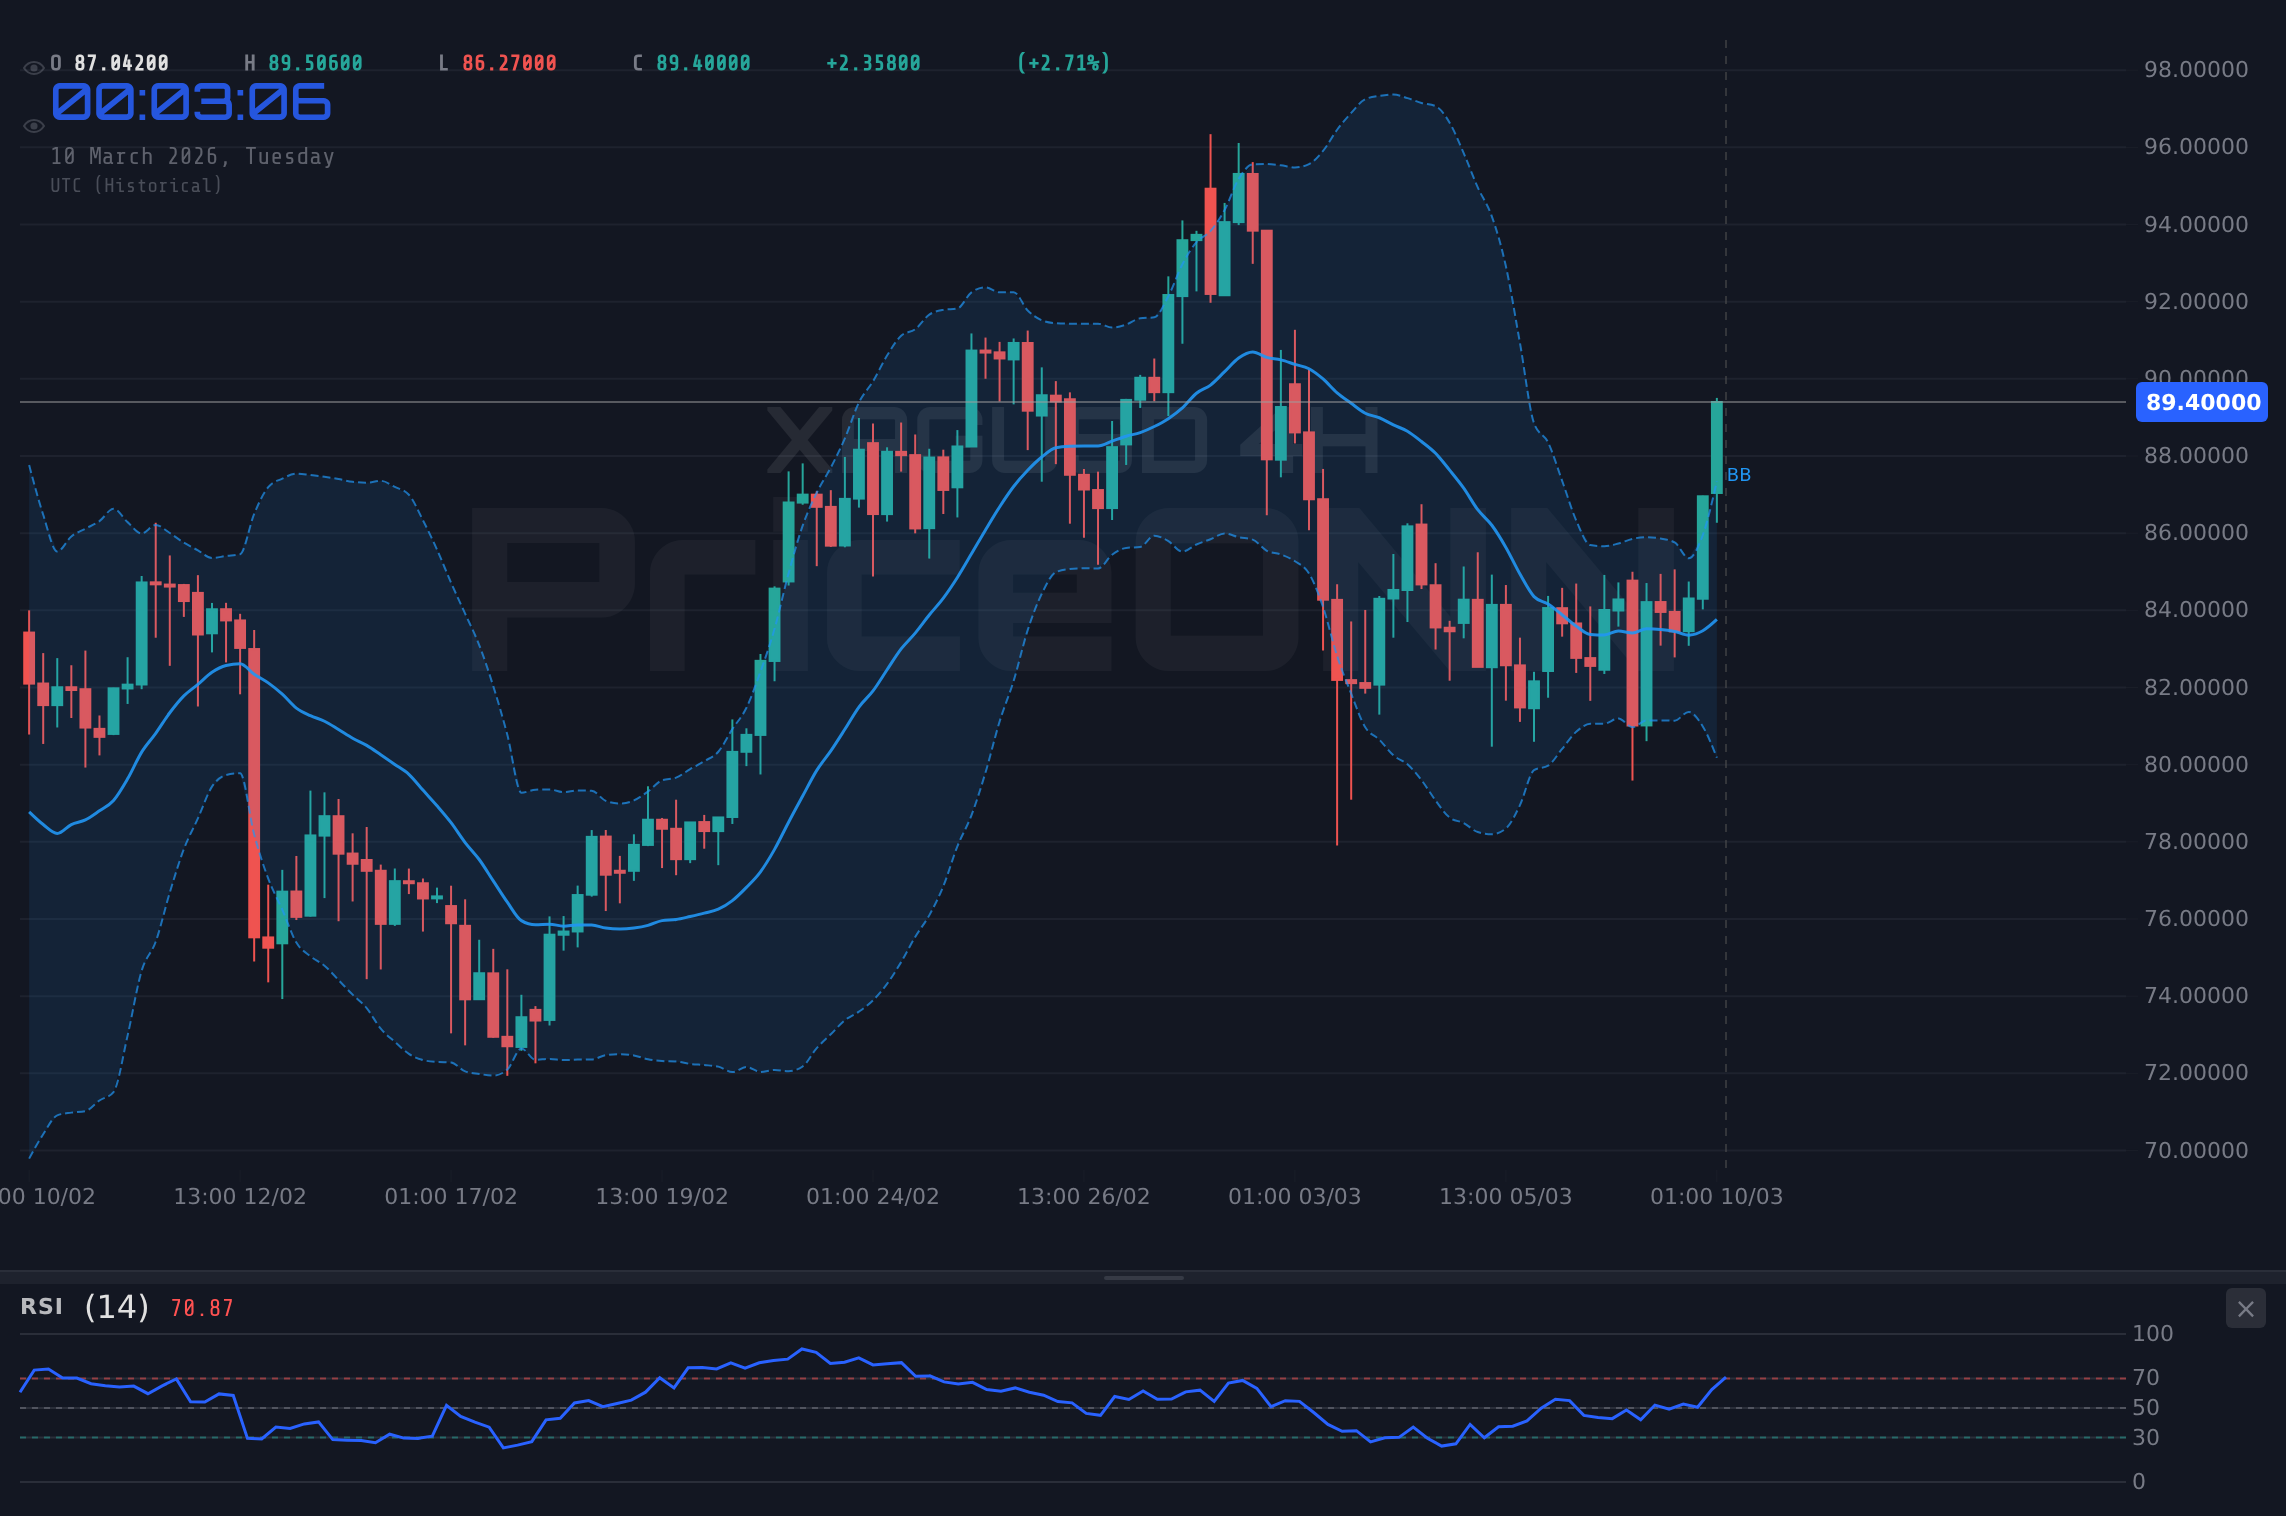
The bearish case for silver is primarily driven by technical indicators and external economic factors. The 1H chart's RSI of 70.37 indicates overbought conditions, suggesting a potential pullback. A break below the support level of $86.64 could trigger a sell-off, pushing the price towards the next support level at $85.83. The Stochastic indicator on the 1H chart also points to overbought conditions, with K=94.98 and D=87.11. The ADX on the 1H chart is only 19.45, which indicates that the trend is weak and price can move either way. The daily change is positive at 3.63%, but the bullishness may not last.
Furthermore, a strengthening US dollar could put downward pressure on silver prices. The DXY is currently trading at 98.5, and any further gains could negatively impact XAGUSD. The recent news about WTI crude oil volatility, driven by geopolitical tensions, could also impact silver. If oil prices stabilize or decline, it could reduce inflationary pressures, diminishing the appeal of silver as an inflation hedge. The overall trend in the markets is downward, which also points to bearishness. Therefore, the bulls should be cautious about a possible reversal.
Technical Analysis: The Tiebreaker
Analyzing the technical picture across multiple timeframes provides valuable insights. On the 1H chart, the RSI at 70.37 suggests that bulls are exhausted, and a pullback is likely. However, the MACD remains positive, indicating that the bullish momentum hasn't completely faded. The Stochastic indicator also confirms overbought conditions. On the 4H chart, the RSI is at 58.19, which is neutral. However, the ADX is at 31.66, indicating a strong trend. On the daily chart, the RSI is at 52.65, which is also neutral. The MACD shows positive momentum, but the Stochastic indicator is bearish.
Considering the conflicting signals, it's crucial to identify key levels to watch. The immediate support level to watch is $86.64. If this level breaks, the price could fall towards $85.83 and $85.39. On the upside, the resistance level is $87.88. A break above this level could lead to further gains towards $88.32 and $89.13. Based on current data, it appears more likely that the bears will take over. However, the bulls can still regain control if they can push the price above $87.88.
Trade Plan: Navigating the Uncertainty
Given the mixed signals, a careful trade plan is essential. Here’s a breakdown of potential scenarios and actionable strategies.
If XAGUSD breaks above $87.88 and holds, it could signal renewed bullish momentum. Targets include $88.32 and $89.13. Continuation depends on maintaining support above $87.34.
A close below $86.64 would confirm bearish pressure. Targets include $85.83 and $85.39. Breakdown conditions include a sustained DXY rally.
Entry Trigger: Consider a short position if XAGUSD closes below $86.64. Initial Target: $85.83. Secondary Target: $85.39. Stop Loss/Invalidation: Place a stop loss above $87.34 to protect against unexpected bullish reversals. Probability Assessment: Given the overbought conditions and weak ADX, this setup has an estimated probability of 60%. Risk Warning: The economic calendar shows several USD events. Be cautious of the possible volatility.
Correlation Analysis: DXY and Beyond
Understanding the correlation between XAGUSD and other assets can provide valuable insights. As mentioned earlier, the DXY plays a crucial role. A rising DXY typically puts downward pressure on silver prices, while a falling DXY provides support. Currently, the DXY is trading at 98.5. If the DXY continues to rise, XAGUSD could face further headwinds. Monitor the DXY closely for any signs of a breakout or breakdown, as this could significantly impact silver's price action. Also, keep an eye on the SP500, which is currently trading at 6765.75. A decline in the SP500 could trigger safe-haven demand, benefiting silver. The current WTI price is 88.48, and its trend is bearish.
The Importance of Industrial Demand
Silver's dual role as both a precious metal and an industrial commodity makes it unique. A significant portion of silver demand comes from industrial applications, including electronics, solar panels, and medical devices. Therefore, economic growth and manufacturing activity can significantly impact silver prices. If global economic growth slows down, industrial demand for silver could decline, putting downward pressure on prices. Conversely, if the global economy rebounds, industrial demand could increase, supporting silver prices. Traders should monitor economic indicators such as PMI (Purchasing Managers' Index) and industrial production data to gauge the health of the global economy and its potential impact on silver. The industrial demand percentage compared to gold is also a key factor to watch.
Geopolitical Risks and Safe-Haven Demand
Geopolitical risks can also play a significant role in silver prices. Escalating tensions or conflicts often lead to increased safe-haven demand, benefiting precious metals like silver. Traders should closely monitor geopolitical developments and assess their potential impact on market sentiment and risk aversion. Keep an eye on the news about the WTI crude oil prices, as geopolitical tensions can drive oil prices above $120. This could further increase the inflation rate, which would benefit silver. However, if the tensions ease or a resolution is reached, safe-haven demand could decline, putting downward pressure on silver prices. The conflict in the Middle East is a key factor to watch in the coming days.
The Role of Central Bank Policies
Central bank policies, particularly those of the Federal Reserve (Fed), can also influence silver prices. The Fed's monetary policy decisions, such as interest rate hikes or cuts, can impact the value of the US dollar and, consequently, silver prices. If the Fed adopts a hawkish stance and raises interest rates, it could strengthen the US dollar, putting downward pressure on silver. Conversely, if the Fed adopts a dovish stance and cuts interest rates, it could weaken the US dollar, supporting silver prices. Traders should closely monitor Fed communications and economic data releases to anticipate potential policy shifts and their impact on silver. The market is already expecting the ECB and BoE to cut rates.
Frequently Asked Questions: XAGUSD Analysis
Is XAGUSD a good buy right now?
Given the overbought conditions and conflicting signals, XAGUSD is not a clear buy right now. A safer approach would be to wait for a confirmed break below $86.64 before considering a short position, or a break above $87.88 before considering a long position.
What is the XAGUSD price forecast for this week?
The XAGUSD price forecast for this week is mixed. A break below $86.64 could lead to further declines towards $85.83 and $85.39, while a break above $87.88 could lead to gains towards $88.32 and $89.13. The probability of a bearish move is slightly higher due to overbought conditions and weak ADX.
What are the key support and resistance levels for XAGUSD?
The key support levels for XAGUSD are $86.64, $85.83, and $85.39. The key resistance levels are $87.88, $88.32, and $89.13. These levels should be closely monitored for potential breakouts or breakdowns.
Why is XAGUSD moving today?
XAGUSD is moving today due to a combination of technical factors, including overbought conditions and a weak ADX, and external economic factors, such as fluctuating oil prices and geopolitical tensions. The DXY is also playing a role, as a rising DXY puts downward pressure on silver prices.
Track markets in real-time
AI-powered analysis, technical indicators and real-time price data.
Join Our Telegram Channel
Breaking market news, AI analysis and trading signals instantly.
Join Channel