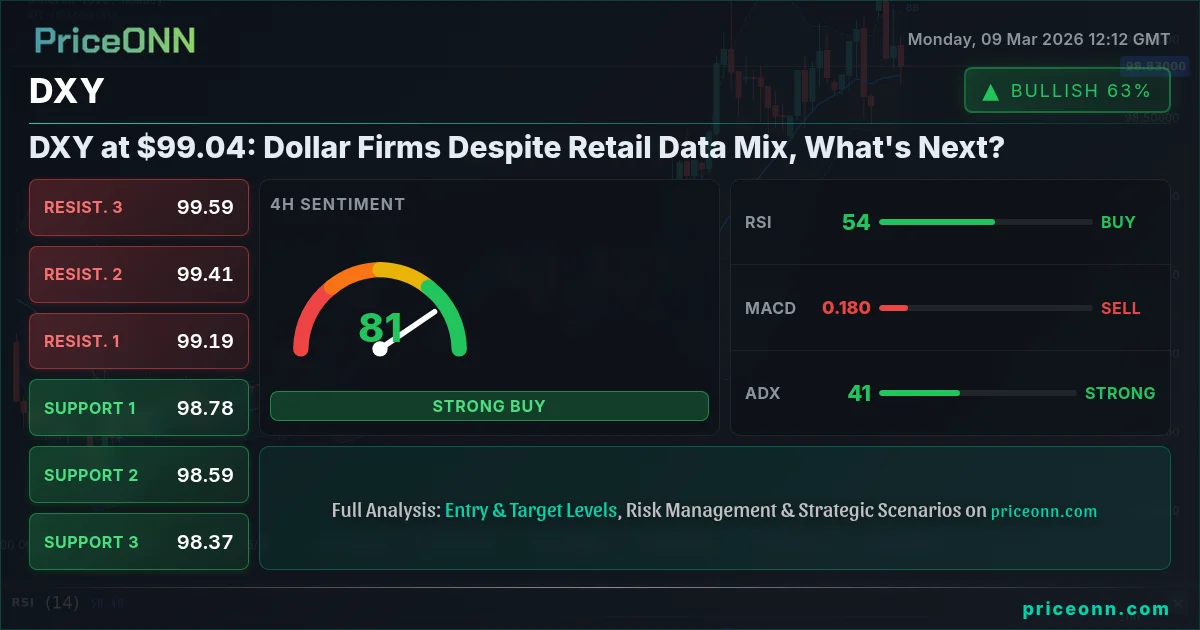
The Dollar Index (DXY) is currently trading near $99.04, a level that's proving to be a battleground between bullish and bearish forces. While recent retail data has presented a mixed picture, the dollar's resilience suggests deeper market dynamics are at play. The question now is whether this strength is sustainable or if a correction is on the horizon.
- RSI at 53.07 on the 1H chart indicates neutral territory, suggesting neither overbought nor oversold conditions.
- Key resistance level sits at $99.18, a break above which could signal further bullish momentum.
- The ADX on the 4H chart is 42.54, indicating a strong uptrend, lending credence to the bullish case.
- Upcoming economic data on Tuesday, March 10th, could act as a catalyst for the next major move in the DXY.
The Bull Case for DXY: Rate Expectations and Safe-Haven Demand
The bullish argument for the DXY rests on several pillars. First, despite some weaker economic data points, expectations for continued, albeit potentially slower, interest rate hikes by the Federal Reserve remain elevated. This expectation provides a fundamental bid for the dollar, as higher interest rates tend to attract foreign capital. The CME FedWatch Tool, while not explicitly provided in this data, would likely show the implied probability of rate hikes, and any increase in these probabilities would further bolster the dollar. Furthermore, the DXY's overall signal is AL (Al: 8, Sat: 0, Nötr: 0) on the daily timeframe, supporting upward movement.
Secondly, geopolitical tensions, particularly the escalating oil crisis stemming from Middle East unrest, are driving safe-haven demand. As uncertainty grips global markets, investors often flock to the perceived safety of the U.S. dollar, further supporting the DXY. Consider the news from March 7th, "Oil Crisis Shakes Forex: EUR/CAD Plunges Amidst Dollar Strength" - the dollar's strength is intrinsically linked to global instability, and the DXY benefits from this flight to safety. The DXY's rise is not just a reflection of the US economy, but its role as a global reserve currency.
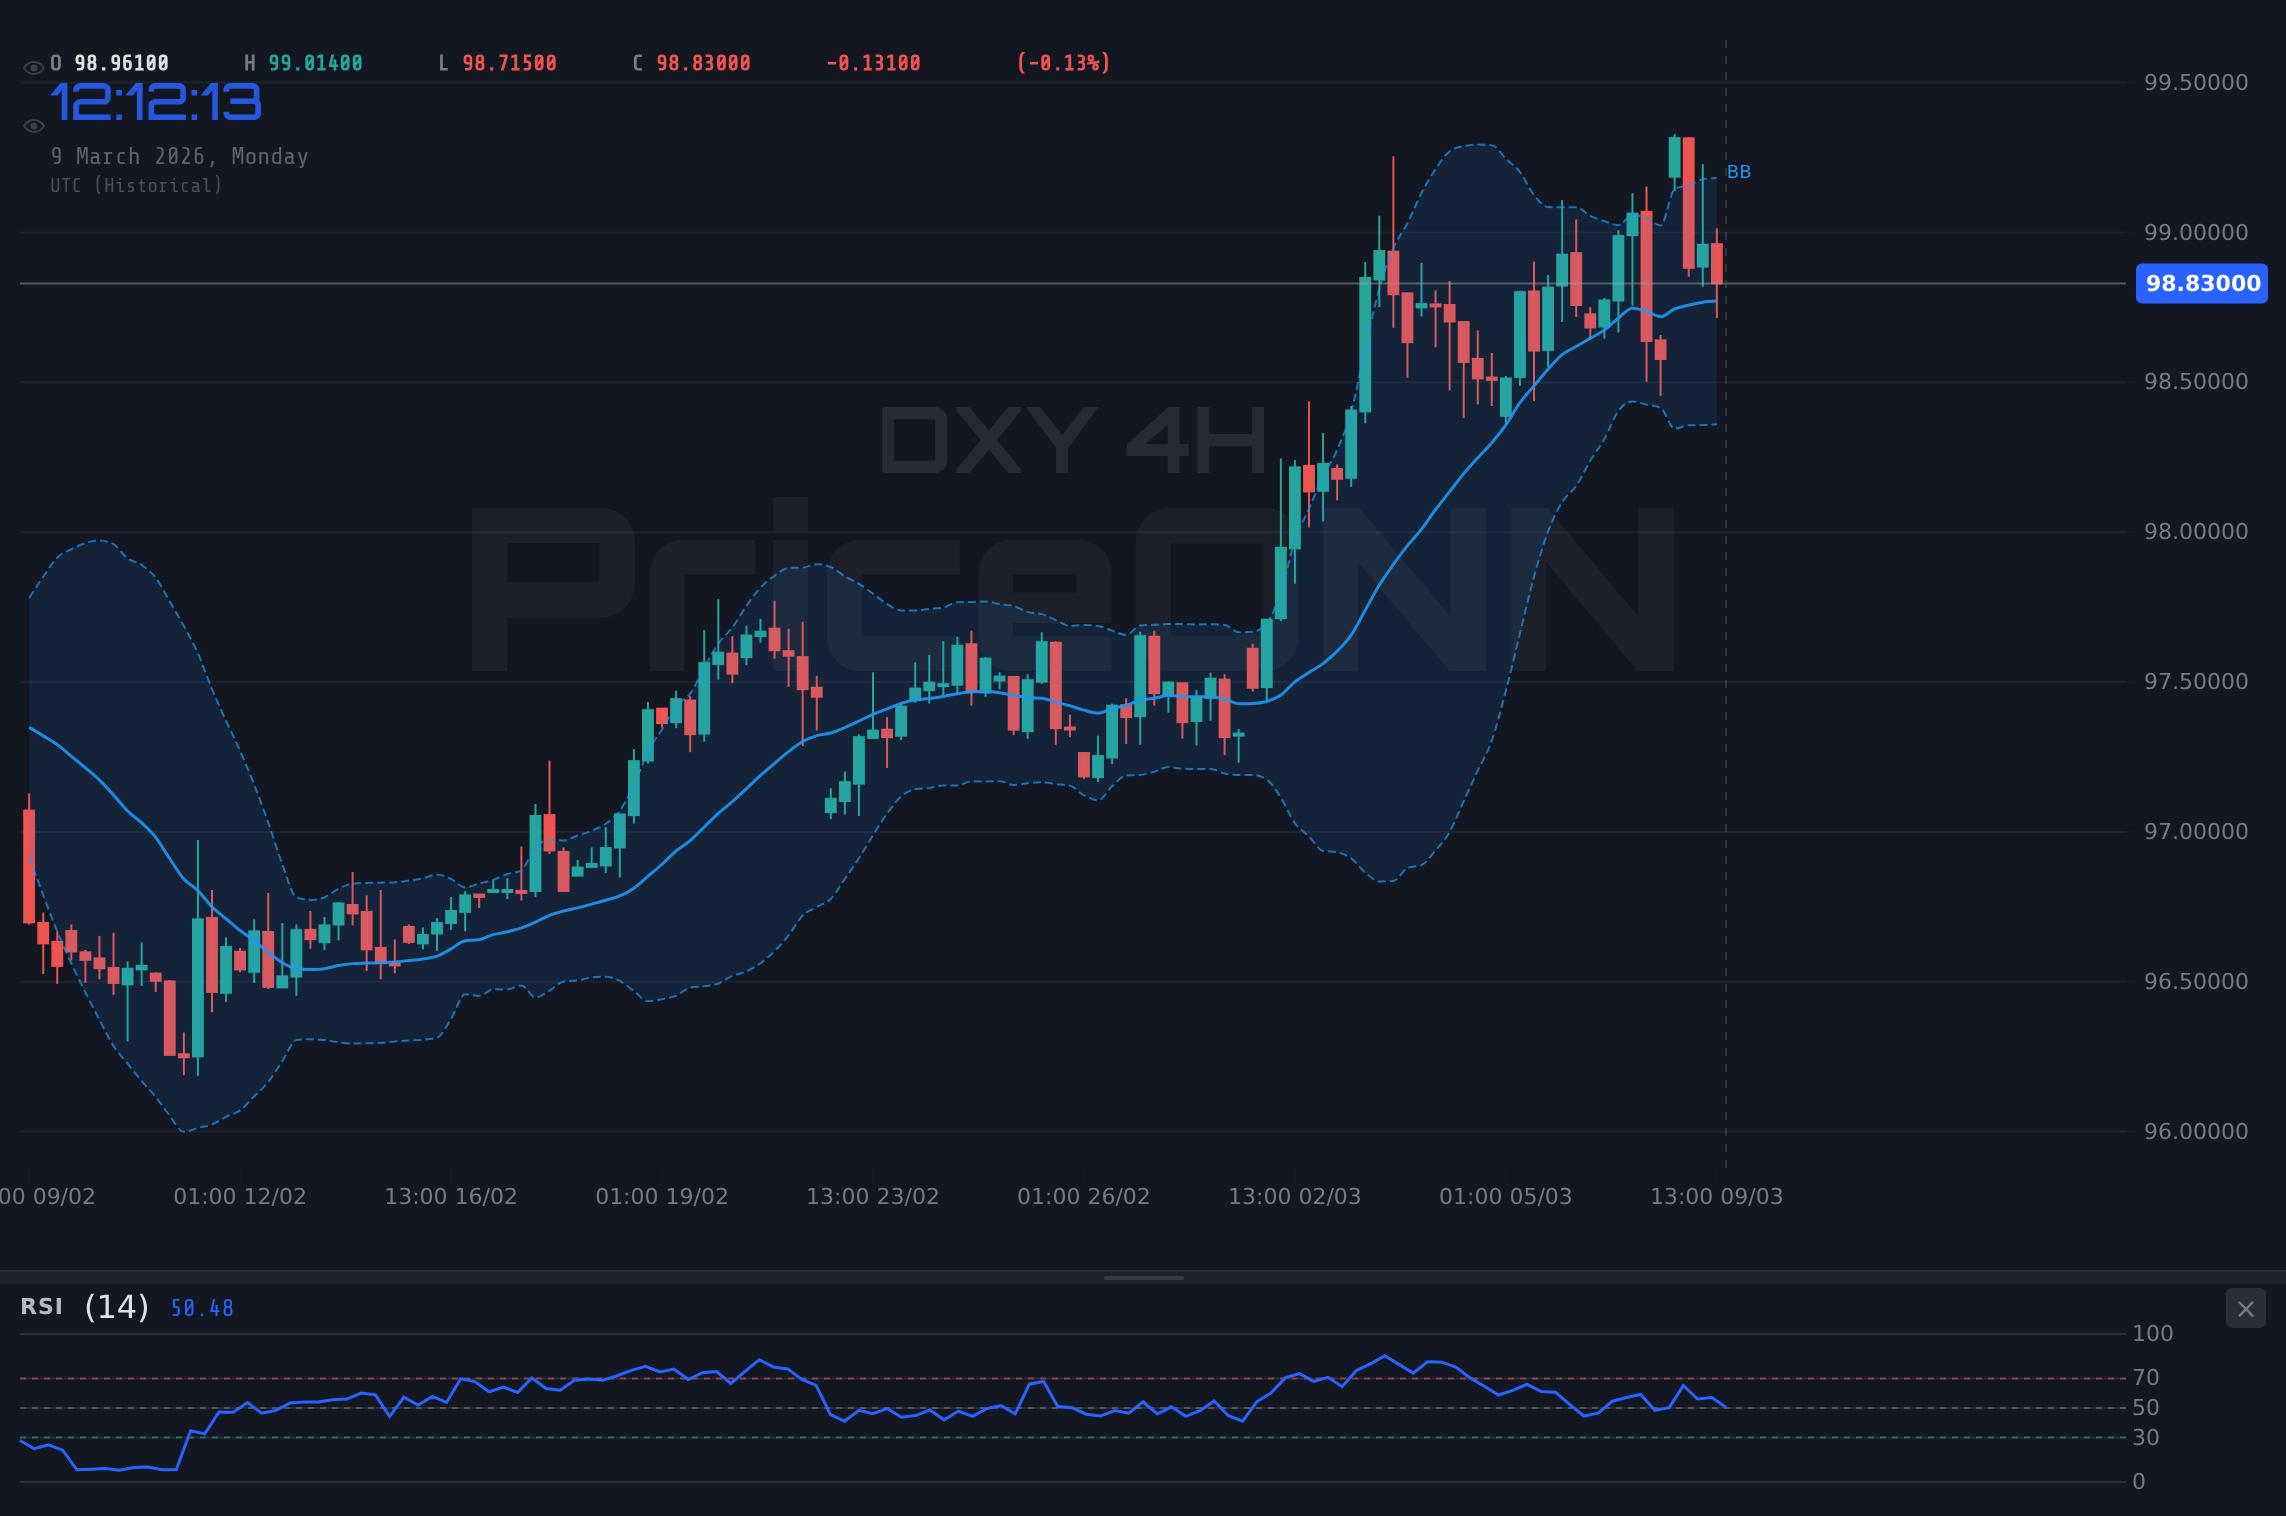
Technically, the DXY's 4H chart presents a compelling case for bullish continuation. With the ADX at 42.54, a strong uptrend is in play. Furthermore, the Stochastic reading of 71.4, while not overbought, suggests that momentum remains positive. The immediate resistance level to watch is $99.18, a break above which could open the door to further gains towards $99.48. Scalpers might look for intraday entries above $99.06, while swing traders would likely wait for a confirmed break above $99.18 to initiate long positions. Long-term investors may see current levels as an attractive entry point, anticipating continued dollar strength driven by fundamental factors.
The Bear Case for DXY: Overbought Conditions and Economic Headwinds
Conversely, the bearish argument highlights potential headwinds facing the dollar. The most immediate concern is the possibility of overbought conditions. While the 4H RSI sits at 57.51, the daily RSI is at 66.86, approaching overbought territory. This suggests that the dollar's recent rally may be running out of steam, setting the stage for a potential correction. The Stochastic on the 1H chart shows a crossover, with %K
Moreover, while the Fed is expected to continue raising rates, the pace and magnitude of these hikes are increasingly uncertain. Weaker economic data, particularly on the retail front, could prompt the Fed to adopt a more dovish stance, weighing on the dollar. If upcoming economic data on Tuesday, March 10th, disappoints, the dollar could face significant downward pressure. Consider that on the daily chart, the MACD shows a potential change in momentum. Short positions are being advised, given current signals.
From a technical perspective, the bears point to the DXY's inability to decisively break above $99.00 in recent sessions. Failure to overcome this level could signal exhaustion and increase the likelihood of a pullback towards the initial support level of $98.87. Swing traders might look for shorting opportunities on a break below $98.99, targeting $98.82 as an initial profit target. Long-term investors may see current levels as an opportunity to reduce dollar exposure, anticipating a potential shift in the macroeconomic landscape.
Technicals as the Tiebreaker: A Multi-Timeframe Analysis
To resolve this bull-bear debate, a multi-timeframe technical analysis is crucial. On the 1H chart, the DXY is trading near the middle of its Bollinger Bands, suggesting neither a clear bullish nor bearish bias. However, the Stochastic oscillator indicates a potential short-term pullback, with %K at 31.03 and %D at 47.61, showing a bearish crossover. This suggests that intraday traders should be cautious about initiating new long positions.
Moving to the 4H chart, the picture becomes more bullish. The ADX at 42.54 signals a strong uptrend. The RSI at 57.51 is not overbought, leaving room for further upside. This suggests that swing traders should be looking for opportunities to join the prevailing uptrend. The key level to watch is $99.18, a decisive break above which could trigger a significant rally.
Finally, on the daily chart, the DXY is trading above its 200-day moving average, a long-term bullish signal. However, the RSI at 66.86 is approaching overbought territory, warranting caution. The Stochastic oscillator is also elevated, suggesting that the dollar's recent rally may be overextended. This implies that long-term investors should be selective about adding to their dollar positions, waiting for a potential pullback to more attractive levels.
Furthermore, the DXY's correlation with other assets is crucial to consider. A rising DXY typically puts downward pressure on gold (XAUUSD) and other major currency pairs like EURUSD, GBPUSD, AUDUSD, and NZDUSD. Conversely, a falling DXY tends to support these assets. The strength of this inverse correlation can vary depending on the underlying drivers of the DXY's movement. For example, if the DXY is rising due to safe-haven demand, the negative correlation with risk assets like equities may be stronger than if the DXY is rising due to expectations of higher U.S. interest rates. The strength of the DXY is also inversely correlated with SP500, Nasdaq100 and DowJones30 which are all down today with daily changes of -0.97%, -1.02%, and -1.08% respectively.
Trade Plan: DXY Long Setup (65% Probability)
Based on the multi-timeframe analysis, a cautious bullish bias is warranted for the DXY. The strong uptrend on the 4H chart, coupled with the overall positive sentiment, suggests that further gains are likely. However, the potential for a short-term pullback on the 1H chart and the approaching overbought conditions on the daily chart warrant a disciplined approach.
DXY breaks above $99.18 resistance, confirming bullish momentum. Targets $99.48 initially, with potential to extend towards $99.65 if momentum sustains.
DXY fails to break $99.18 and retraces below $98.87 support. Targets $98.82 initially, with potential to extend towards $98.72 if selling pressure intensifies.
Entry Trigger: A confirmed break above $99.18, accompanied by increased volume, would signal a high-probability entry point for a long position.
Target 1: $99.48 (previous swing high)
Target 2: $99.65 (key resistance level)
Stop/Invalidation: A close below $98.87 would invalidate the bullish thesis and trigger a stop-loss order.
Probability Estimate: 65%
Upcoming economic data on Tuesday, March 10th, could significantly impact the DXY. Traders should exercise caution and manage their risk accordingly.
Technical Outlook Summary
| Indicator | Value | Signal |
|---|---|---|
| RSI (14) | 53.07 | Neutral |
| MACD Histogram | Negative | Bullish |
| Stochastic | 31.03/47.61 | Bearish |
| ADX (4H) | 42.54 | Strong Trend |
| Bollinger | Middle Band | Watch |
Key Levels
Support Levels
Resistance Levels
Frequently Asked Questions: DXY Analysis
Is DXY a good buy right now?
DXY presents a cautious buy opportunity above $99.18, confirmed by increased volume. With current price at $99.04, wait for the breakout to target $99.48, but set a stop-loss below $98.87 to manage risk.
What is the DXY price forecast for this week?
The DXY price forecast for this week suggests a potential move towards $99.48 if it breaks above $99.18 resistance. However, failure to break above this level could lead to a pullback towards $98.87, with a 65% probability of the bullish scenario playing out.
What are the key support and resistance levels for DXY?
Key support levels for the DXY are at $98.87, $98.82, and $98.75. Resistance levels are at $99.18, $99.48, and $99.65. These levels represent potential areas of buying and selling pressure.
Why is DXY moving today?
DXY is moving today due to a combination of factors, including expectations for continued Fed rate hikes, safe-haven demand stemming from geopolitical tensions, and mixed retail data. The overall signal is AL (Al: 8, Sat: 0, Nötr: 0) on the daily timeframe, supporting upward movement.
Track markets in real-time
AI-powered analysis, technical indicators and real-time price data.
Join Our Telegram Channel
Breaking market news, AI analysis and trading signals instantly.
Join Channel