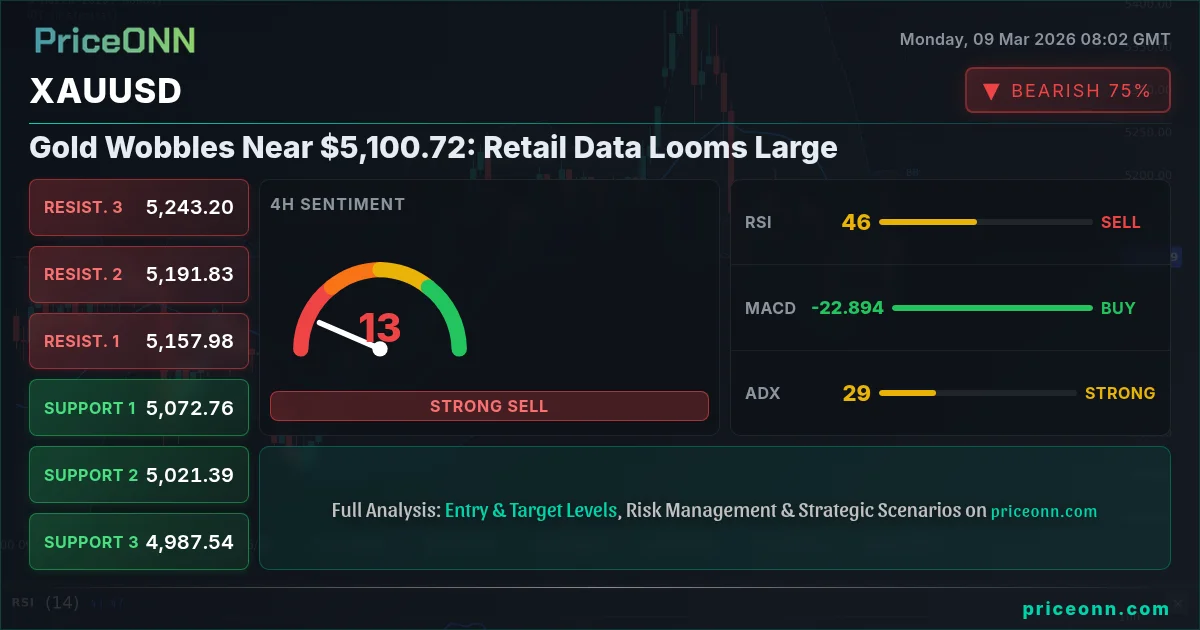
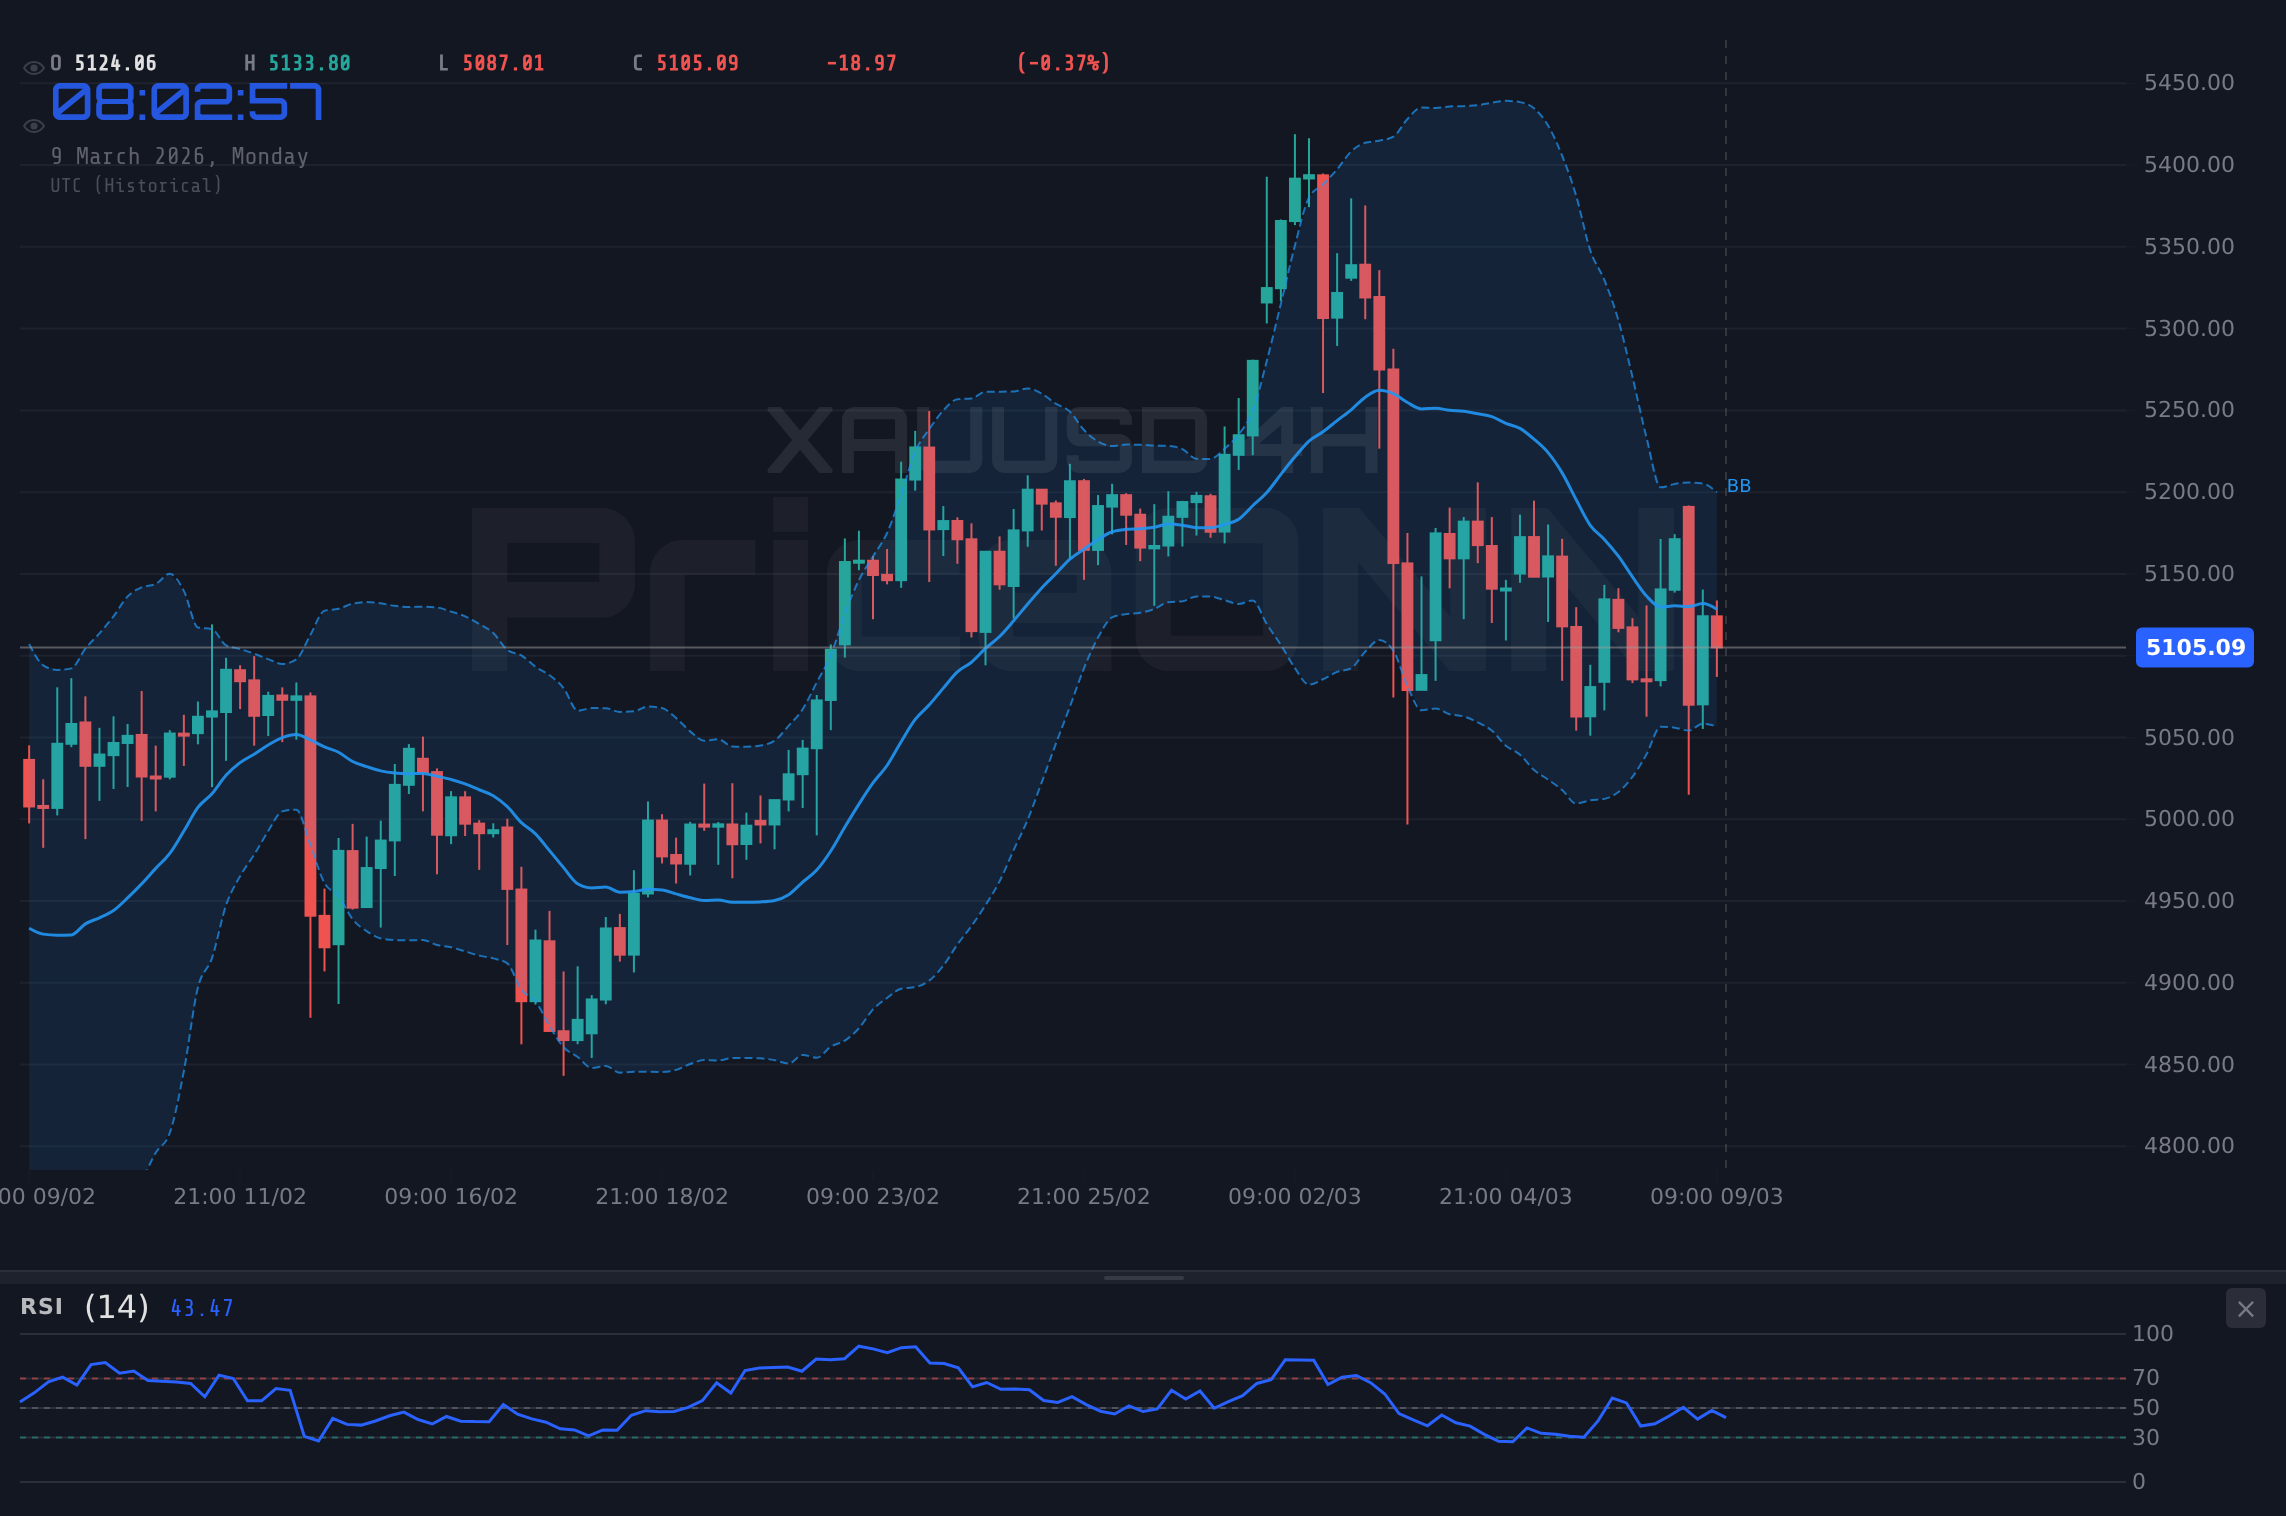
Gold (XAUUSD) finds itself at a critical juncture, currently trading near $5,100.72, a level that's proving to be a significant battleground between bulls and bears. The precious metal is exhibiting signs of weakness, struggling to maintain its upward momentum amid a strengthening dollar and increased market volatility stemming from rising oil prices. The key question is whether this is a temporary pullback or the start of a more sustained correction, and upcoming retail data releases could provide crucial insights.
- RSI at 47.8 on the 1H chart suggests neutral momentum with a slight downward bias.
- Critical support sits at $5,084.97, a break below could trigger further selling.
- MACD shows negative momentum, indicating bearish sentiment is currently prevailing.
- DXY strength is exerting downward pressure on gold, highlighting the gold vs dollar correlation 2026.
The technical picture for gold is mixed across different timeframes. On the hourly chart, the trend is bearish with 86% strength. The Relative Strength Index (RSI) is hovering around 47.8, indicating neutral momentum but with a slight downward bias. This suggests that the recent selling pressure might continue in the short term. The Moving Average Convergence Divergence (MACD) indicator reinforces this bearish sentiment, showing negative momentum and positioning below the signal line. The Bollinger Bands show that the price is below the middle band, suggesting a continuation of the downtrend. However, the Stochastic oscillator presents a contrasting signal, with %K at 58.89 and %D at 45.18, indicating a potential for a bullish reversal. The Average Directional Index (ADX) at 22.33 suggests a moderately strong downtrend, further complicating the outlook.
Stepping back to the 4-hour timeframe, the trend becomes neutral, indicating a period of consolidation. The RSI is at 45.29, again showing neutral momentum but with a downward inclination. While the MACD exhibits positive momentum, the Bollinger Bands still point towards a downtrend, as the price remains below the middle band. The Stochastic oscillator mirrors the hourly chart, signaling a possible bullish reversal with %K at 59.03 and %D at 50.19. The ADX at 27.89 indicates a strong downtrend, providing a conflicting signal that needs to be carefully monitored. This divergence in signals highlights the uncertainty surrounding gold's next move.
Looking at the daily chart, the trend shifts back to neutral, reinforcing the consolidation pattern observed in the 4-hour timeframe. The RSI is at 52.18, indicating a slightly bullish momentum. However, the MACD is still showing negative momentum, and the price is trading above the middle band of the Bollinger Bands, suggesting a possible continuation of the uptrend. The Stochastic oscillator presents a bearish signal, with %K at 28.61 and %D at 49.55. The ADX at 13.98 indicates a weak trend, suggesting that the market is currently lacking a clear direction. From a multi-timeframe perspective, the conflicting signals emphasize the need for patience and confirmation before making any trading decisions.
Key support levels to watch are $5,084.97, $5,072.51, and $5,048.09, as defined by the 1H timeframe. A break below $5,084.97 could trigger further selling pressure, potentially pushing gold towards the $5,000 psychological level. On the upside, resistance levels are identified at $5,121.85, $5,146.27, and $5,158.73. Clearing the $5,121.85 resistance could signal a potential bullish reversal, opening the door for a test of higher levels. These levels are crucial for both short-term scalpers and swing traders to monitor for potential entry and exit points.
The recent weakness in gold can be attributed to several factors. Firstly, the strengthening dollar, as indicated by the DXY currently at 99.02, is putting downward pressure on the precious metal. As the dollar gains strength, gold becomes relatively more expensive for investors holding other currencies, thus reducing demand. This highlights the inverse gold vs dollar correlation 2026. Secondly, rising oil prices, spurred by escalating tensions in the Middle East as reported by several news outlets this past week, are contributing to inflationary pressures, which can sometimes weigh on gold prices as investors seek higher-yielding assets. The forex markets have been shaken by the oil crisis, as evidenced by the EUR/CAD plunge.
The upcoming retail data releases are expected to play a significant role in determining gold's next direction. Strong retail sales figures could signal a robust economy, potentially leading to higher interest rates and further dollar strength, which would likely weigh on gold. Conversely, weak retail data could indicate a slowing economy, potentially prompting the Federal Reserve to adopt a more dovish stance, which could support gold prices. This makes the economic data releases a crucial event for gold traders to watch. The market is pricing in these factors and gold is reacting accordingly.
For scalpers, the hourly chart provides valuable insights for identifying short-term trading opportunities. Look for potential breakouts above $5,121.85 or breakdowns below $5,084.97 to initiate quick trades. Swing traders, on the other hand, should focus on the 4-hour and daily charts to identify more sustained trends. A confirmed break above $5,169.62 on the 4-hour chart could signal a longer-term bullish move, while a break below $4,992.71 could indicate a more significant bearish trend. Long-term investors should pay close attention to the daily chart and monitor the overall macroeconomic environment, including interest rate expectations, inflation data, and geopolitical risks, to make informed investment decisions.
Given the mixed technical signals and the upcoming retail data releases, a cautious approach is warranted. A potential trade plan could involve waiting for a confirmed breakout above $5,121.85 on the hourly chart before entering a long position, with a stop-loss order placed below $5,084.97 to manage risk. The initial target could be $5,146.27, followed by $5,158.73. Alternatively, a confirmed breakdown below $5,084.97 could present an opportunity to enter a short position, with a stop-loss order placed above $5,121.85 and targets set at $5,072.51 and $5,048.09. However, traders should be mindful of the potential for whipsaws and false breakouts due to market volatility.
Having tracked XAUUSD through multiple economic cycles, it's evident that gold's behavior is heavily influenced by both technical factors and fundamental drivers. Historically, when the RSI reaches levels near 50 on the hourly chart, it often signals a period of consolidation before a more decisive move. This pattern last appeared in December 2025, when the price subsequently rallied after a period of sideways trading. Similarly, the MACD crossover on the daily chart has often been a reliable indicator of trend reversals. The oil crisis is making traders nervous, with all eyes on the Middle East. The current industrial demand for gold remains steady, but silver is showing stronger industrial usage. The market is waiting for a catalyst.
The dollar index strengthens by 0.44%, putting pressure on gold. With the SP500 down 1.43%, risk appetite is declining, safe-haven demand may increase. Crude oil is currently trading at $65.73. With RSI at 71.16, bulls are losing steam - not in full reversal territory yet, but worth watching. The ADX at 19.03 is the real story here. A weak-trend reading like this means the breakout hasn't committed yet- it could go either way. The 4H chart shows ADX at 13.59 - trend strength is very weak. The Stochastic oscillator is showing K=68.29, D=44.75, indicating a bullish signal. It is important to note that ADX shows the strength of the trend, and not the direction.
The outlook for gold remains uncertain, with mixed technical signals and upcoming retail data releases adding to the complexity. Traders should exercise caution and wait for clear confirmation before initiating any positions. Manage your risk, wait for your setup- the market always gives a second chance. By combining technical analysis with a thorough understanding of the fundamental drivers, investors can navigate these choppy waters and identify potential opportunities in the gold market.
Frequently Asked Questions: XAUUSD Analysis
Is XAUUSD a good buy right now?
Currently, XAUUSD is trading near $5,100.72, and the mixed technical signals suggest caution. A confirmed breakout above $5,121.85 could signal a potential buying opportunity, but it's prudent to wait for confirmation before initiating a long position.
What is the XAUUSD price forecast for this week?
The XAUUSD price forecast for this week is uncertain, with key levels to watch being $5,121.85 as resistance and $5,084.97 as support. A breakout above resistance could target $5,158.73, while a breakdown below support could lead to a test of $5,048.09.
What are the key support and resistance levels for XAUUSD?
Key support levels for XAUUSD are $5,084.97, $5,072.51, and $5,048.09. Key resistance levels are $5,121.85, $5,146.27, and $5,158.73. These levels represent potential areas where price may find support or encounter resistance.
Why is XAUUSD moving today?
XAUUSD is moving today due to a combination of factors, including a strengthening dollar (DXY at 99.02) putting downward pressure on gold, rising oil prices contributing to inflationary pressures, and anticipation of upcoming retail data releases that could influence the Federal Reserve's monetary policy decisions.
Technical Outlook Summary
| Indicator | Value | Signal |
|---|---|---|
| RSI (14) | 47.8 | Neutral |
| MACD Histogram | Negative Momentum | Bearish |
| Stochastic | K=58.89, D=45.18 | Bullish |
| ADX | 22.33 | Weak Trend |
| Bollinger | Middle Band | Below |
Track markets in real-time
AI-powered analysis, technical indicators and real-time price data.
Join Our Telegram Channel
Breaking market news, AI analysis and trading signals instantly.
Join Channel