BRENT Bullish Momentum Eyes $65.73 Amid CPI Data Watch
BRENT crude oil gains bullish traction, currently trading at $65.73. Traders eye upcoming CPI data as geopolitical tensions add volatility.
BRENT crude oil finds itself at a pivotal juncture, with bulls and bears locked in a tug-of-war around the $65 level. Can the bullish momentum sustain itself, or will bearish pressures prevail? The answer may lie in the upcoming CPI data and the evolving geopolitical landscape.
- BRENT crude oil is currently trading at $65.73, reflecting bullish momentum.
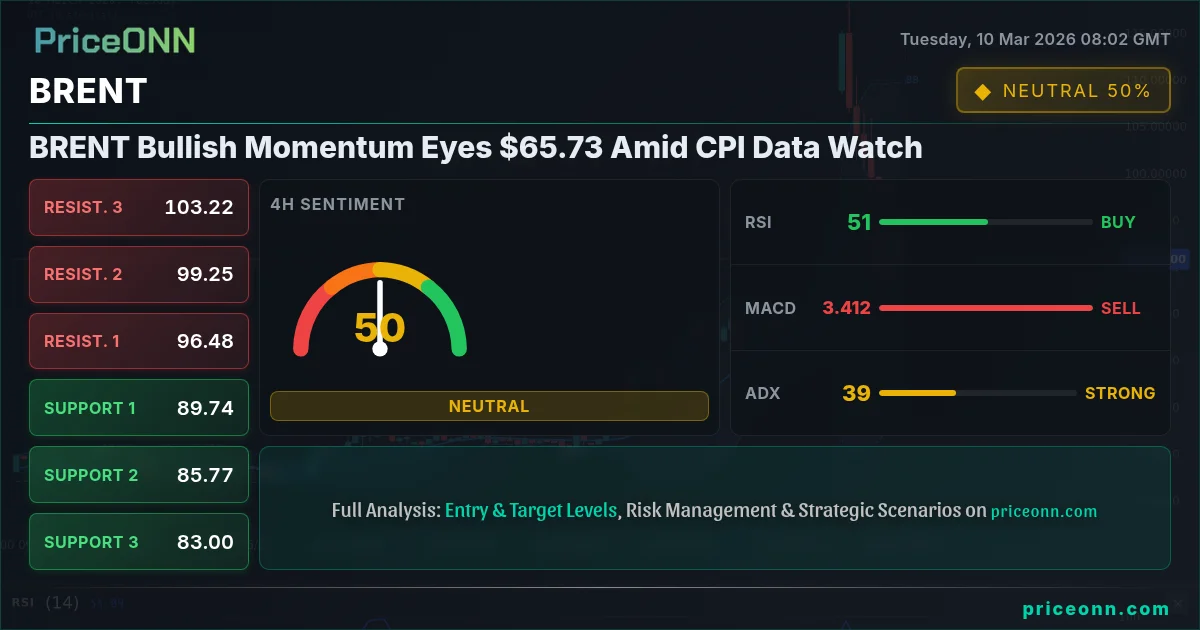
- Immediate resistance is observed at $65.41, with further targets at $65.52 and $65.62.
- The ADX at 19.03 indicates a weak trend, suggesting potential for volatility and range-bound movement.
- Traders are keenly awaiting the upcoming CPI data for potential inflationary signals impacting BRENT.
The Bull Case for BRENT: Geopolitical Tensions and Demand Recovery
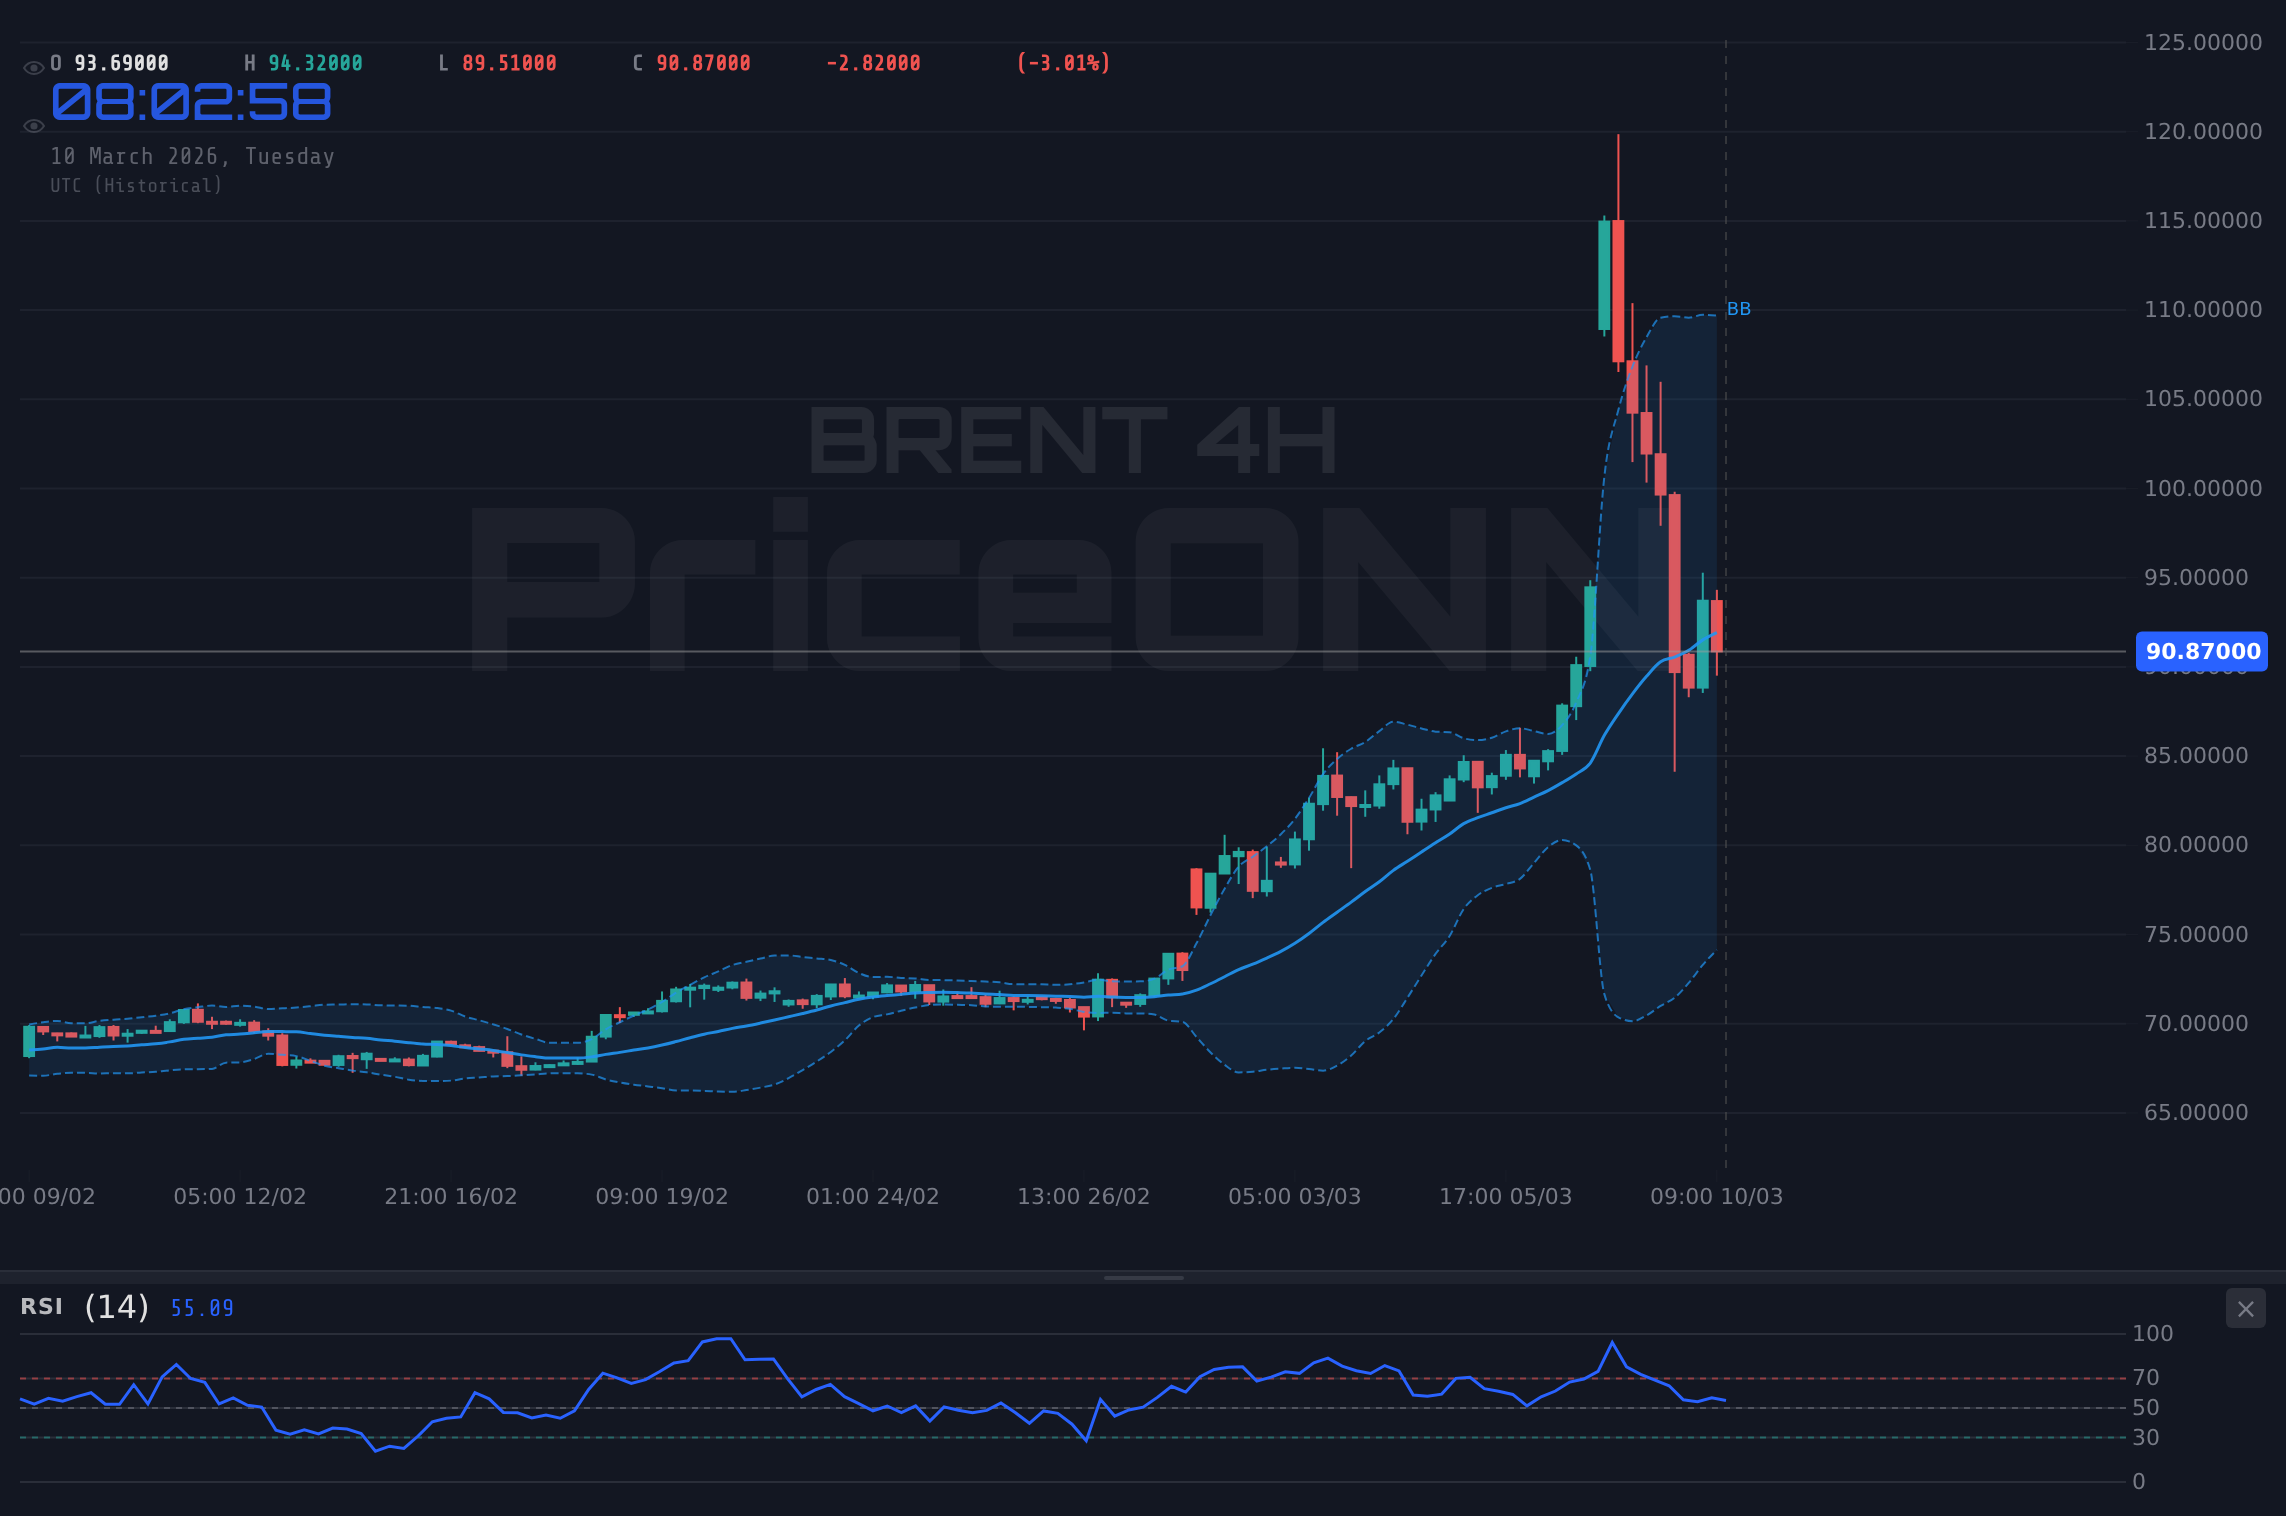
The bullish narrative for BRENT is primarily fueled by escalating geopolitical tensions and expectations of a demand recovery. The recent surge in WTI crude oil prices, briefly exceeding $120 per barrel as reported on March 9th, highlights the sensitivity of the energy market to geopolitical events. Any further escalation could disrupt supply chains, leading to higher prices. From a technical perspective, the 1-hour chart displays a bullish trend with the price above the middle Bollinger Band and RSI at 71.16, indicating buying pressure. The MACD also shows positive momentum.
The global economy continues its slow recovery, with demand for oil expected to rise as travel restrictions ease and industrial activity picks up. Emerging markets, in particular, are expected to drive much of this demand growth. The weaker dollar, with the DXY at 98.28 is providing additional support. A weaker dollar makes oil cheaper for countries using other currencies, increasing demand. The stochastic on the 1H chart shows K=90.49 and D=81.87 signaling overbought conditions. However, the overall trend still points upwards.
Looking back, similar geopolitical events in the past have led to significant spikes in oil prices. The oil crisis in the 1970s and the Gulf War in the 1990s are prime examples. While the current situation is different, the underlying principle remains the same: geopolitical instability can disrupt supply and drive prices higher.
The Bear Case for BRENT: Economic Slowdown and Supply Increases
The bearish case for BRENT rests on concerns about a potential economic slowdown and the possibility of increased supply. High inflation and rising interest rates could dampen economic growth, leading to lower demand for oil. The potential for a recession in major economies like the US and Europe remains a significant risk. Furthermore, the easing of COVID-related restrictions has led to increased production from several countries, potentially creating a supply glut.
From a technical standpoint, the daily chart shows an ADX of 28.64, indicating a strong uptrend, but the stochastic oscillator shows K=54.52 and D=58.52, signaling a potential pullback. The MACD is positive, but momentum may be slowing. This suggests that the recent rally may be running out of steam.
Historically, periods of economic slowdown have always been accompanied by lower oil prices. The global financial crisis in 2008 and the COVID-19 pandemic in 2020 are two recent examples. While the current economic situation is not as dire as those events, the risks of a slowdown are real and could weigh on oil prices. Also, WTI currently at $85.79 shows bearish signals with RSI at 38.35 and MACD indicating negative momentum. This could drag BRENT down as well.
Technicals as the Tiebreaker: A Multi-Timeframe Analysis
To determine which scenario is more likely to play out, let's examine the technical indicators across multiple timeframes. On the 1-hour chart, BRENT shows a bullish trend with an RSI of 71.16. However, the ADX is weak at 19.03, suggesting a lack of strong conviction. The 4-hour chart also shows a bullish trend, with the RSI at 62.33. The ADX is also weak at 13.59. On the daily chart, the RSI is at 59.99, and the MACD is positive, supporting the bullish case. However, the stochastic oscillator shows a potential pullback.
Analyzing the support and resistance levels, immediate resistance is at $65.41, followed by $65.52 and $65.62. Key support levels are at $65.20, $65.10 and $64.99. A break above $65.62 would confirm the bullish trend, while a break below $64.99 would suggest a bearish reversal.
The DXY at 98.28 is showing a bearish trend on the 1H chart which should support BRENT. However, the SP500 at 6812.45 is showing a bullish trend which might signal increased demand for BRENT. NASDAQ100 at 25044.34 is also showing a bullish trend which adds to the demand expectation. This mixed signals from the indices adds complexity to the analysis.
Upcoming CPI Data: A Potential Catalyst
The upcoming CPI data is a key event that could significantly impact BRENT prices. Higher-than-expected inflation data could strengthen the dollar, putting downward pressure on oil prices. Conversely, lower-than-expected inflation data could weaken the dollar, supporting oil prices. Traders should closely monitor the CPI data and be prepared to adjust their positions accordingly. According to the economic calendar, USD CPI data is scheduled to be released on Wednesday, March 11th. Furthermore, the earlier JPY events on Monday, March 9th might also impact the oil prices indirectly.
In addition to the CPI data, traders should also pay attention to other economic indicators, such as GDP growth, employment figures, and manufacturing activity. These indicators can provide valuable insights into the overall health of the global economy and the demand for oil.
The US Dollar Index (DXY) is a crucial factor to consider. Currently at 98.28, its bearish trend is providing some support to BRENT, but any strengthening of the dollar could quickly reverse this dynamic. The market is also closely watching the Dow Jones at 47853.5 which is displaying a bullish trend. The correlation between these indices and BRENT needs to be considered before making any investment decisions.
Scalpers, Swing Traders, and Long-Term Investors: What to Watch
Different types of traders will have different perspectives on BRENT. Scalpers may focus on the short-term volatility and look for quick profits from intraday price swings. Swing traders may look for opportunities to capture larger price movements over several days or weeks. Long-term investors may focus on the fundamental drivers of oil prices and take a longer-term view.
Scalpers should pay close attention to the 1-hour chart and look for technical patterns that indicate potential breakouts or reversals. Swing traders should focus on the 4-hour and daily charts and look for confluence of technical indicators that support a particular trend. Long-term investors should monitor the fundamental drivers of oil prices, such as geopolitical tensions, economic growth, and supply and demand dynamics.
For scalpers, the key levels to watch are the immediate support and resistance levels on the 1-hour chart. Swing traders should pay attention to the key support and resistance levels on the 4-hour and daily charts. Long-term investors should monitor the broader economic and geopolitical landscape.
Correlation Analysis: DXY, Bond Yields, Equities, Oil
Understanding the correlations between BRENT and other asset classes is crucial for making informed trading decisions. The DXY (Dollar Index) typically has an inverse relationship with BRENT, as a stronger dollar makes oil more expensive for countries using other currencies. Bond yields can also influence oil prices, as rising yields can dampen economic growth and reduce demand for oil. Equities, particularly energy stocks, tend to be positively correlated with oil prices.
Currently, the DXY is showing a bearish trend on the 1H chart, which is providing some support to BRENT. However, any strengthening of the dollar could quickly reverse this dynamic. The SP500 and NASDAQ100 are showing bullish trends, which might signal increased demand for BRENT. However, these signals are mixed, and traders should exercise caution.
WTI's signals need to be considered as well. The 1H chart has WTI at $85.79 showing bearish signals with RSI at 38.35 and MACD indicating negative momentum. This could drag BRENT down as well.
Frequently Asked Questions: BRENT Analysis
What happens if BRENT breaks above $65.62 resistance?
A break above the $65.62 resistance level would likely confirm the bullish trend for BRENT, potentially opening the door for further gains towards higher resistance levels at $66.36. This scenario would be supported by continued positive momentum in the MACD and a weaker dollar.
Should I buy BRENT at current levels of $65.73 given RSI at 71.16?
With the RSI at 71.16 on the 1-hour chart, BRENT is approaching overbought territory, suggesting a potential pullback. While the overall trend is bullish, traders might consider waiting for a dip before entering a long position to improve their risk-reward ratio. Look for support at $65.20.
Is the positive MACD signal on the 1-hour chart a reliable indicator for BRENT?
The positive MACD signal on the 1-hour chart indicates bullish momentum for BRENT. However, traders should also consider other factors, such as the weak ADX reading and the overbought RSI, before making a trading decision. A confluence of positive signals across multiple timeframes would provide stronger confirmation.
How will the upcoming CPI data affect BRENT this week?
The upcoming CPI data could have a significant impact on BRENT prices. Higher-than-expected inflation data could strengthen the dollar, putting downward pressure on oil prices. Conversely, lower-than-expected inflation data could weaken the dollar, supporting oil prices. Traders should monitor the data closely and be prepared to adjust their positions accordingly.
Volatility creates opportunity - those prepared will be rewarded. Markets are cyclical; every downturn plants seeds for the next rally. Risk management is key!
Track markets in real-time
AI-powered analysis, technical indicators and real-time price data.
Join Our Telegram Channel
Breaking market news, AI analysis and trading signals instantly.
Join Channel