

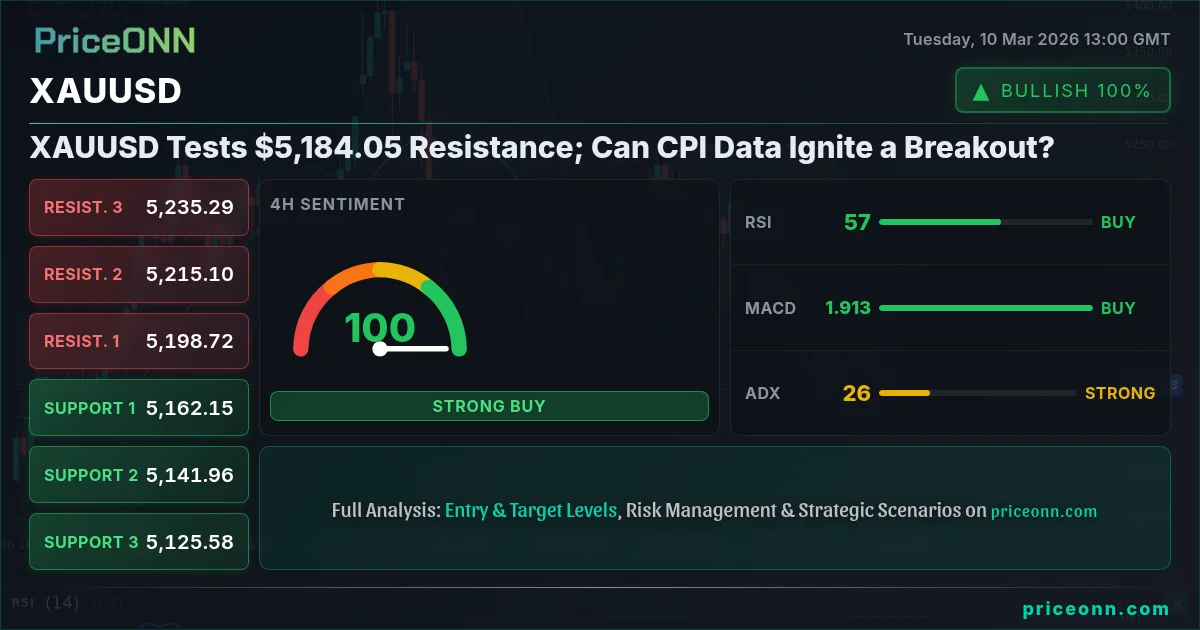
Gold just did something the bulls have been waiting months for- a sustained test of the $5,184.05 resistance level. The question now is whether this rally has legs, or if it's just another false dawn. With geopolitical tensions simmering and inflation data looming, the stakes couldn't be higher.
- XAUUSD is testing major resistance at $5,184.05, a level not consistently seen since early February.
- The 1-hour chart shows a strong bullish trend with ADX at 45.23, suggesting continued upward momentum.
- Upcoming CPI data on Wednesday is the primary catalyst that could trigger a breakout or rejection.
- A break above $5,213.97 could open the door to $5,291.37, while failure to hold $5,161.06 could lead to a retest of $5,145.02.
Geopolitical Tensions and Safe-Haven Demand
The current geopolitical climate is providing a significant tailwind for gold. As reported by Reuters, escalating tensions in the Middle East are driving investors toward safe-haven assets. Gold, traditionally seen as a store of value during times of uncertainty, is benefiting from this increased demand. The SP500 is showing a daily decline of -0.13%, adding to the risk-off sentiment. This risk aversion is further evidenced by the rise in the DXY, which is currently at 98.45, putting pressure on other currencies and commodities.
The Inflation Wildcard
However, geopolitical factors are only part of the story. Inflation data, particularly the upcoming CPI release on Wednesday, is expected to play a crucial role in determining gold's next move. If the CPI data comes in higher than expected, it could fuel further inflation concerns, potentially driving gold prices even higher. Conversely, a weaker-than-expected CPI could temper inflation fears and lead to a pullback in gold. According to the economic calendar, the previous CPI was 3.91. The markets will be closely watching to see if this number has increased, decreased, or remained the same. The market's reaction is already being priced in, to some extent, with gold hovering near the $5,184.05 resistance level.
Technical Signals: A Mixed Bag
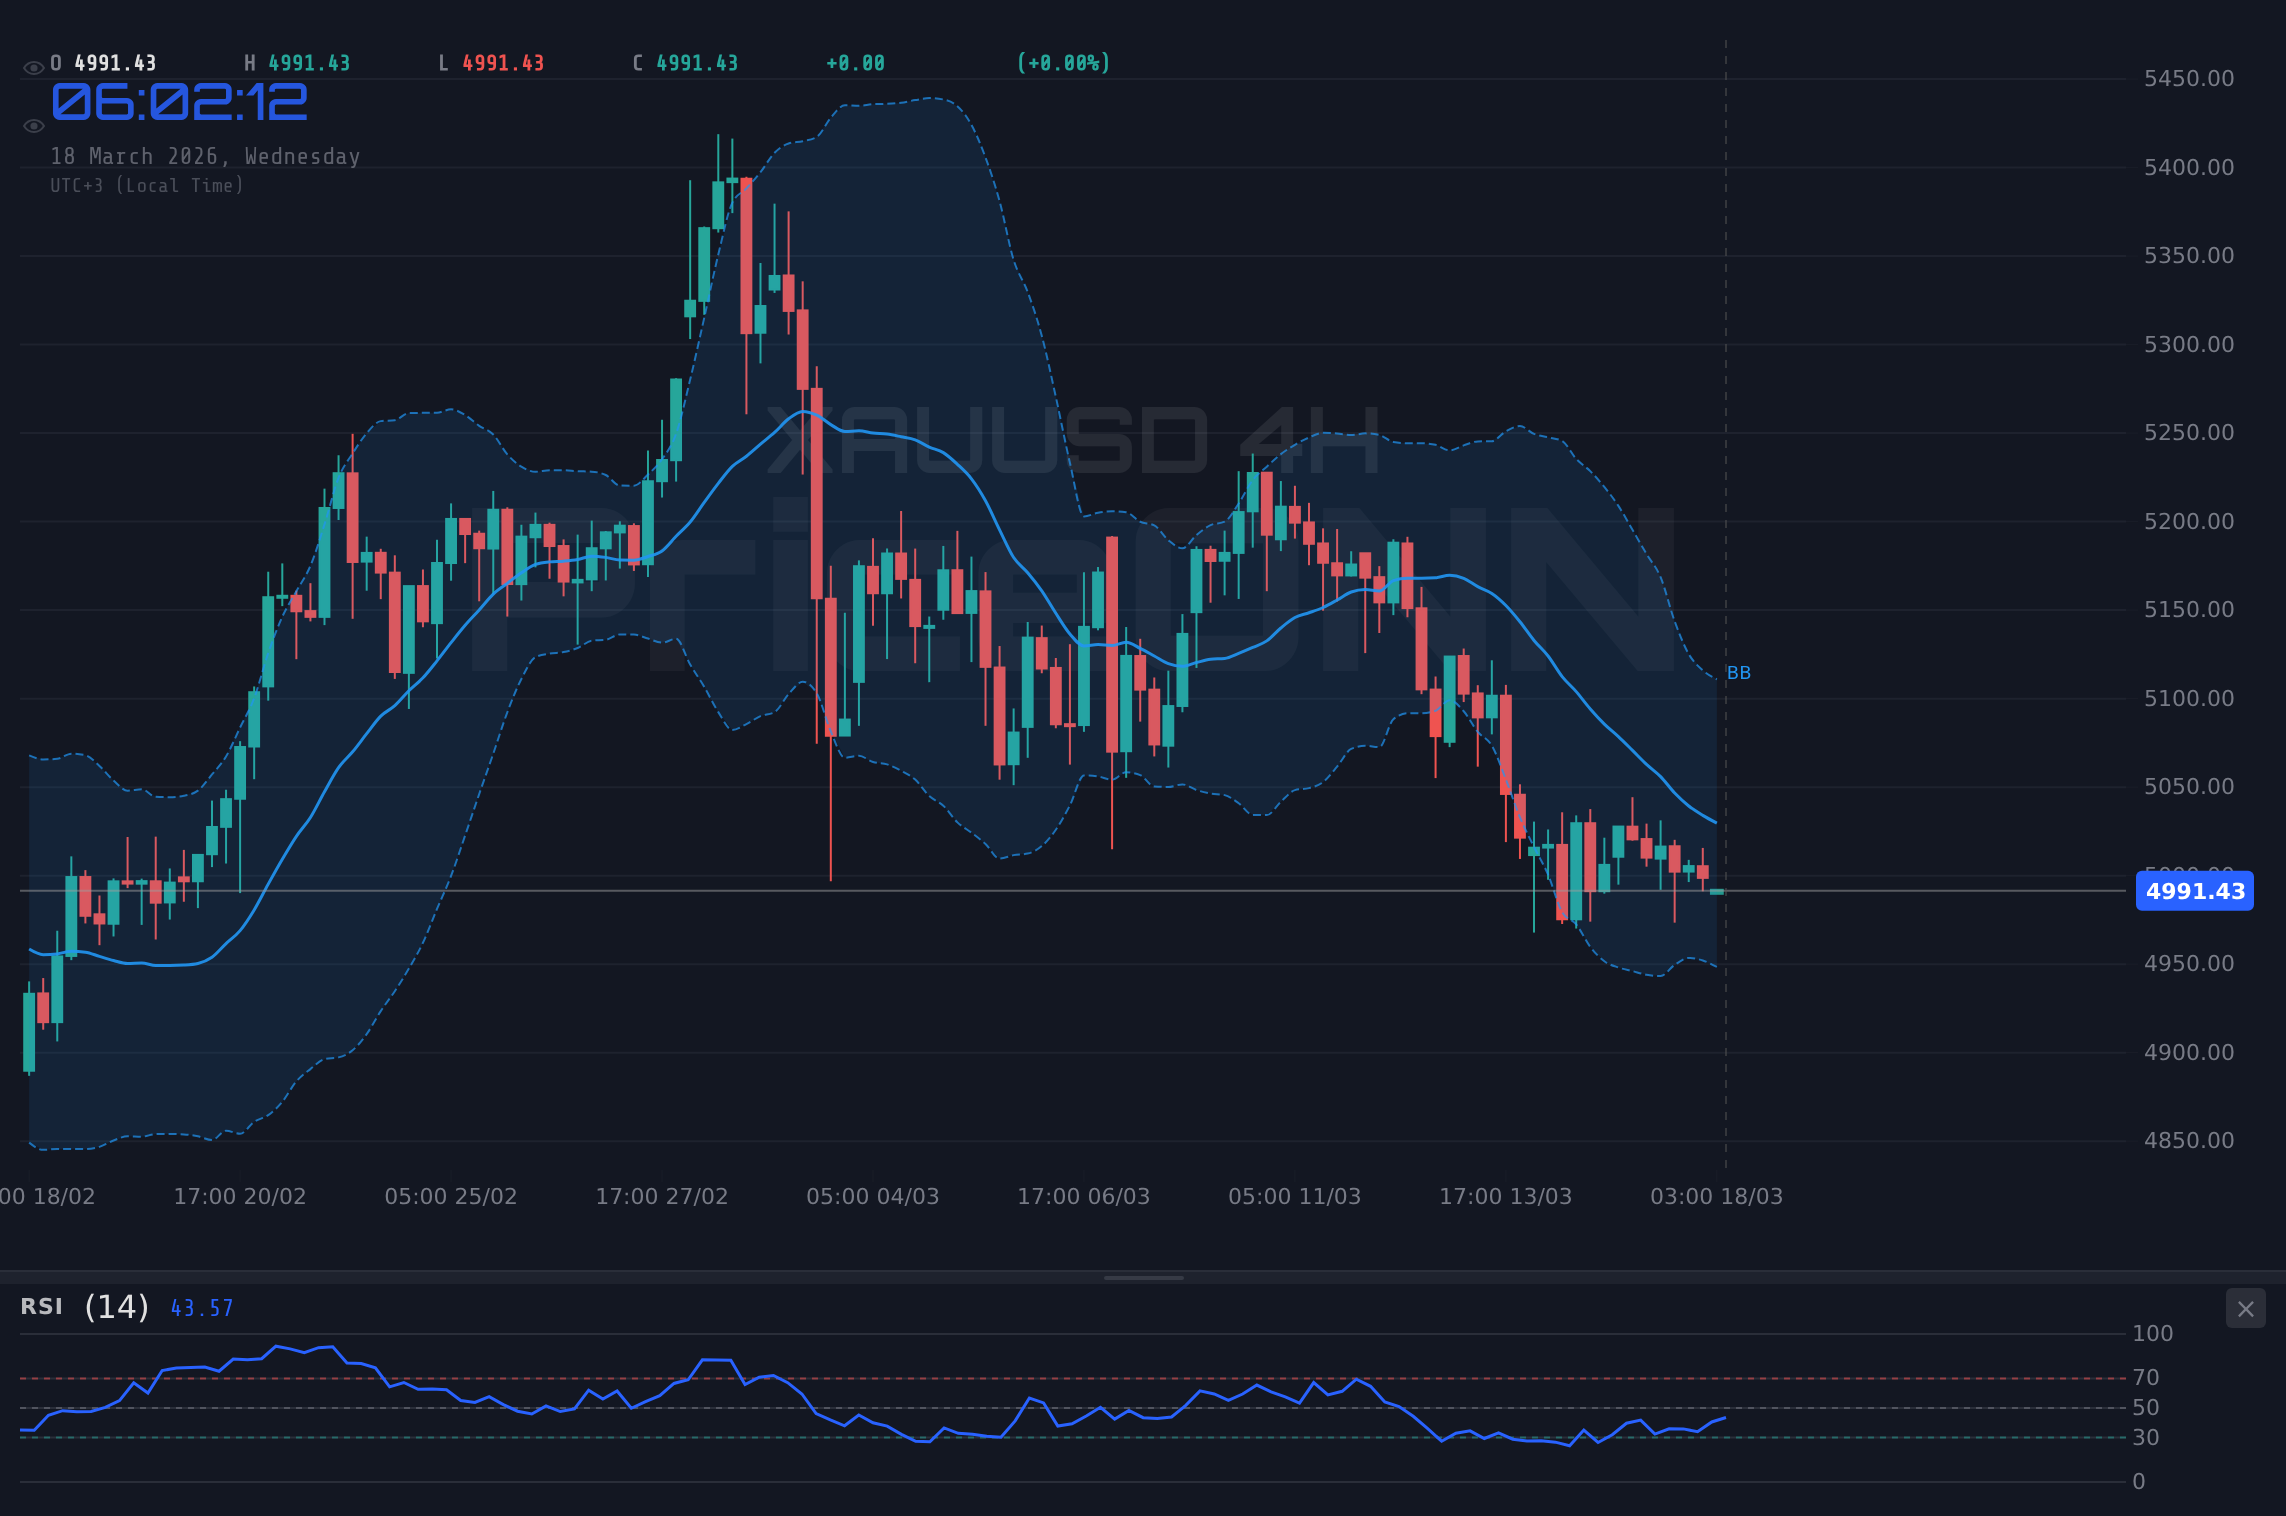
A look at the technical indicators reveals a mixed picture. On the 1-hour chart, the RSI is at 62.17, suggesting that the market is neither overbought nor oversold, indicating there's room for further upside. However, the Stochastic indicator on the 1-hour chart shows K=70.55 and D=80.47 suggesting a potential pullback. The 4-hour chart paints a more bullish picture, with the Stochastic showing K=93.85 and D=65.1, indicating strong upward momentum. The ADX on the 4H chart is at 27.81, signaling a strong trend. However, the daily chart shows a weakening trend with the ADX at 13.33. This divergence across timeframes highlights the uncertainty in the market.
Key Levels to Watch
From a technical perspective, several key levels warrant close attention. Immediate support lies at $5,161.06, followed by $5,145.02. A break below these levels could trigger a deeper correction towards $5,133.72. On the upside, the first resistance level to watch is $5,188.4, followed by $5,199.7. A decisive break above $5,213.97, as indicated by the daily resistance, could pave the way for a test of $5,291.37. These levels are critical for both bulls and bears, and the market's reaction to these levels will likely dictate the short-term direction of gold.
The Bear Case: A Potential Pullback?
Despite the bullish momentum, there are reasons to be cautious. The DXY, as mentioned earlier, is strengthening, which typically puts downward pressure on gold. The SP500, although slightly down, is still relatively elevated, suggesting that risk appetite hasn't completely vanished. Furthermore, as highlighted by Foreks Haber, gold experienced selling pressure last week, dropping below $5,100 as the oil spike lifted the US Dollar. The 1-day chart shows a negative MACD histogram, signaling that sellers are not only present, but actively gaining momentum.
The Bull Case: A Breakout on the Horizon?
On the other hand, the bullish case remains compelling. Geopolitical risks aren't going away anytime soon, and inflation concerns could easily resurface if the CPI data disappoints. Moreover, central banks continue to buy gold, providing a strong underlying bid. The overall signal is still a buy, with 6 of the 8 indicators suggesting a buy on the 1D timeframe. The rising support levels on the 1H timeframe suggest that buyers are stepping in on pullbacks. The combination of these factors suggests that a breakout above $5,213.97 is a distinct possibility.
Trade Plan: Riding the Momentum
Given the technical and fundamental backdrop, here's a potential trade plan for XAUUSD:
If XAUUSD breaks and holds above $5,188.4, look for a continuation towards $5,199.7 and then $5,213.97. A sustained move above $5,213.97 could open the door to $5,291.37. This scenario is supported by the overall bullish trend and ongoing geopolitical tensions.
If XAUUSD fails to hold above $5,161.06, a retest of $5,145.02 becomes likely. A break below $5,145.02 could lead to a deeper correction towards $5,133.72. This scenario is supported by the strengthening DXY and potential for weaker-than-expected CPI data.
Risk/Reward: Patience is Key
Ultimately, the decision to buy or sell XAUUSD depends on your risk tolerance and investment horizon. However, one thing is clear: patience will be rewarded. The market is currently at a critical juncture, and the next few days will likely determine the short-term direction of gold. By waiting for a clear signal – a decisive break above $5,188.4 or a breakdown below $5,161.06 – traders can significantly improve their odds of success. Remember, manage your risk, wait for your setup-the market always gives a second chance.
Frequently Asked Questions: XAUUSD Analysis
What happens if XAUUSD breaks above $5,188.4 resistance?
If XAUUSD breaks above $5,188.4, we could see a continuation towards $5,199.7 and then $5,213.97. The daily resistance at $5,213.97 could open the door to $5,291.37 if broken.
Should I buy at current $5,184.05 levels given RSI at 62.17 on the 1H chart?
While the RSI at 62.17 on the 1H chart suggests there is room for further upside, it's crucial to wait for confirmation. A decisive break above $5,188.4 would provide a stronger signal. Managing your risk is crucial.
Is a Stochastic reading of K=70.55 and D=80.47 on the 1H a sell signal for XAUUSD?
The Stochastic reading of K=70.55 and D=80.47 on the 1H chart suggests a potential pullback. However, it's important to consider the overall trend. Waiting for confirmation from other indicators, such as a break below $5,161.06, would be prudent.
How will the CPI data on Wednesday affect XAUUSD this week?
The CPI data on Wednesday is a major catalyst that could significantly impact XAUUSD. Higher-than-expected CPI could fuel inflation concerns and drive gold prices higher, while weaker-than-expected CPI could lead to a pullback. Be prepared for increased volatility.
Track markets in real-time
AI-powered analysis, technical indicators and real-time price data.
Join Our Telegram Channel
Breaking market news, AI analysis and trading signals instantly.
Join Channel