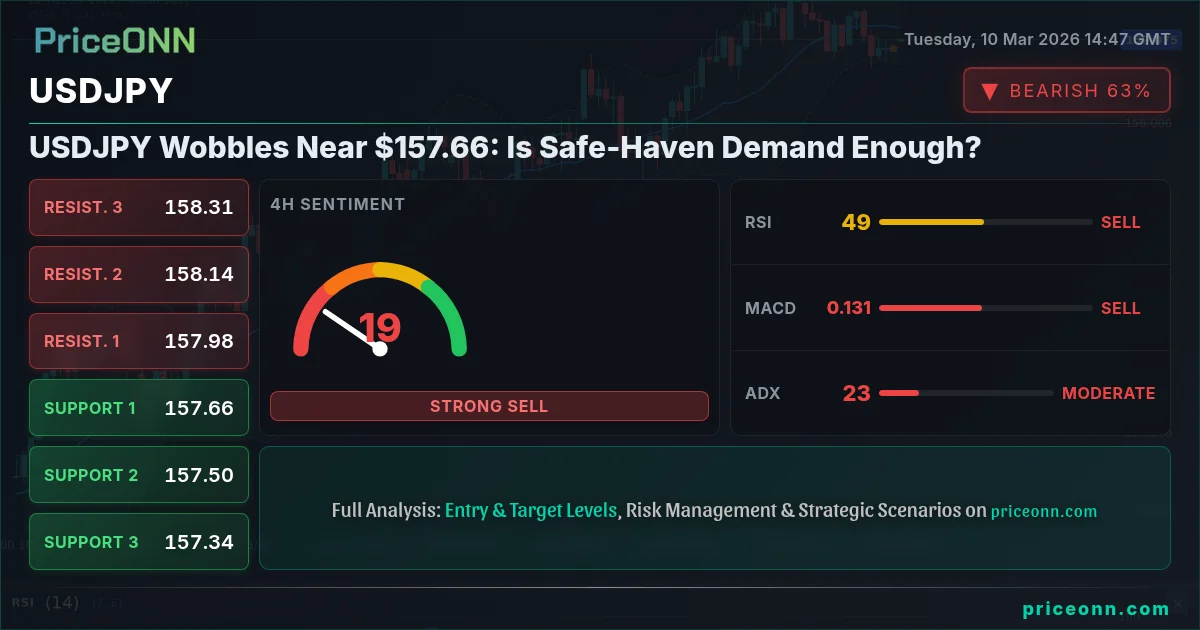
The USDJPY pair finds itself at a crucial juncture, currently trading near $157.66, as escalating geopolitical tensions in the Middle East stoke safe-haven demand for the Japanese Yen. This dynamic clashes with mixed US economic data, leaving traders uncertain about the pair's next move. The question now is whether safe-haven flows can overcome the underlying strength of the US Dollar.
- USDJPY currently trades near $157.66, caught between safe-haven demand and Dollar strength.
- The 1-hour chart shows a downtrend with ADX at 23.01, indicating moderate trend strength.
- Key resistance sits at $157.929, a break above which could signal further upside.
- Stochastic on the 1D chart shows K=73.55 and D=83.87, indicating a potential pullback.
The Yen's Safe-Haven Appeal
Escalating tensions in the Middle East are driving investors towards safe-haven assets, with the Japanese Yen benefiting significantly. As reported earlier today, "Yen Gains as Middle East Tensions Dent EUR/JPY Momentum Near 183.20," highlighting the currency's appeal during times of uncertainty. This geopolitical backdrop is creating a tug-of-war in the USDJPY pair, as the Dollar also benefits from safe-haven flows, albeit to a lesser extent.
Technical Overview: A Battleground of Signals
A multi-timeframe analysis reveals a mixed technical picture for USDJPY. On the 1-hour chart, the trend is bearish with a strength of 87%, as indicated by the provided market data. The ADX stands at 23.01, suggesting a moderate downtrend. However, the RSI at 45.01 is neutral, leaving room for further downside or a potential reversal. Key support levels on this timeframe are identified at $157.713, $157.627, and $157.497. Resistance levels to watch are $157.929, $158.059, and $158.145. Scalpers should watch for a break of these immediate levels for quick profit-taking opportunities.
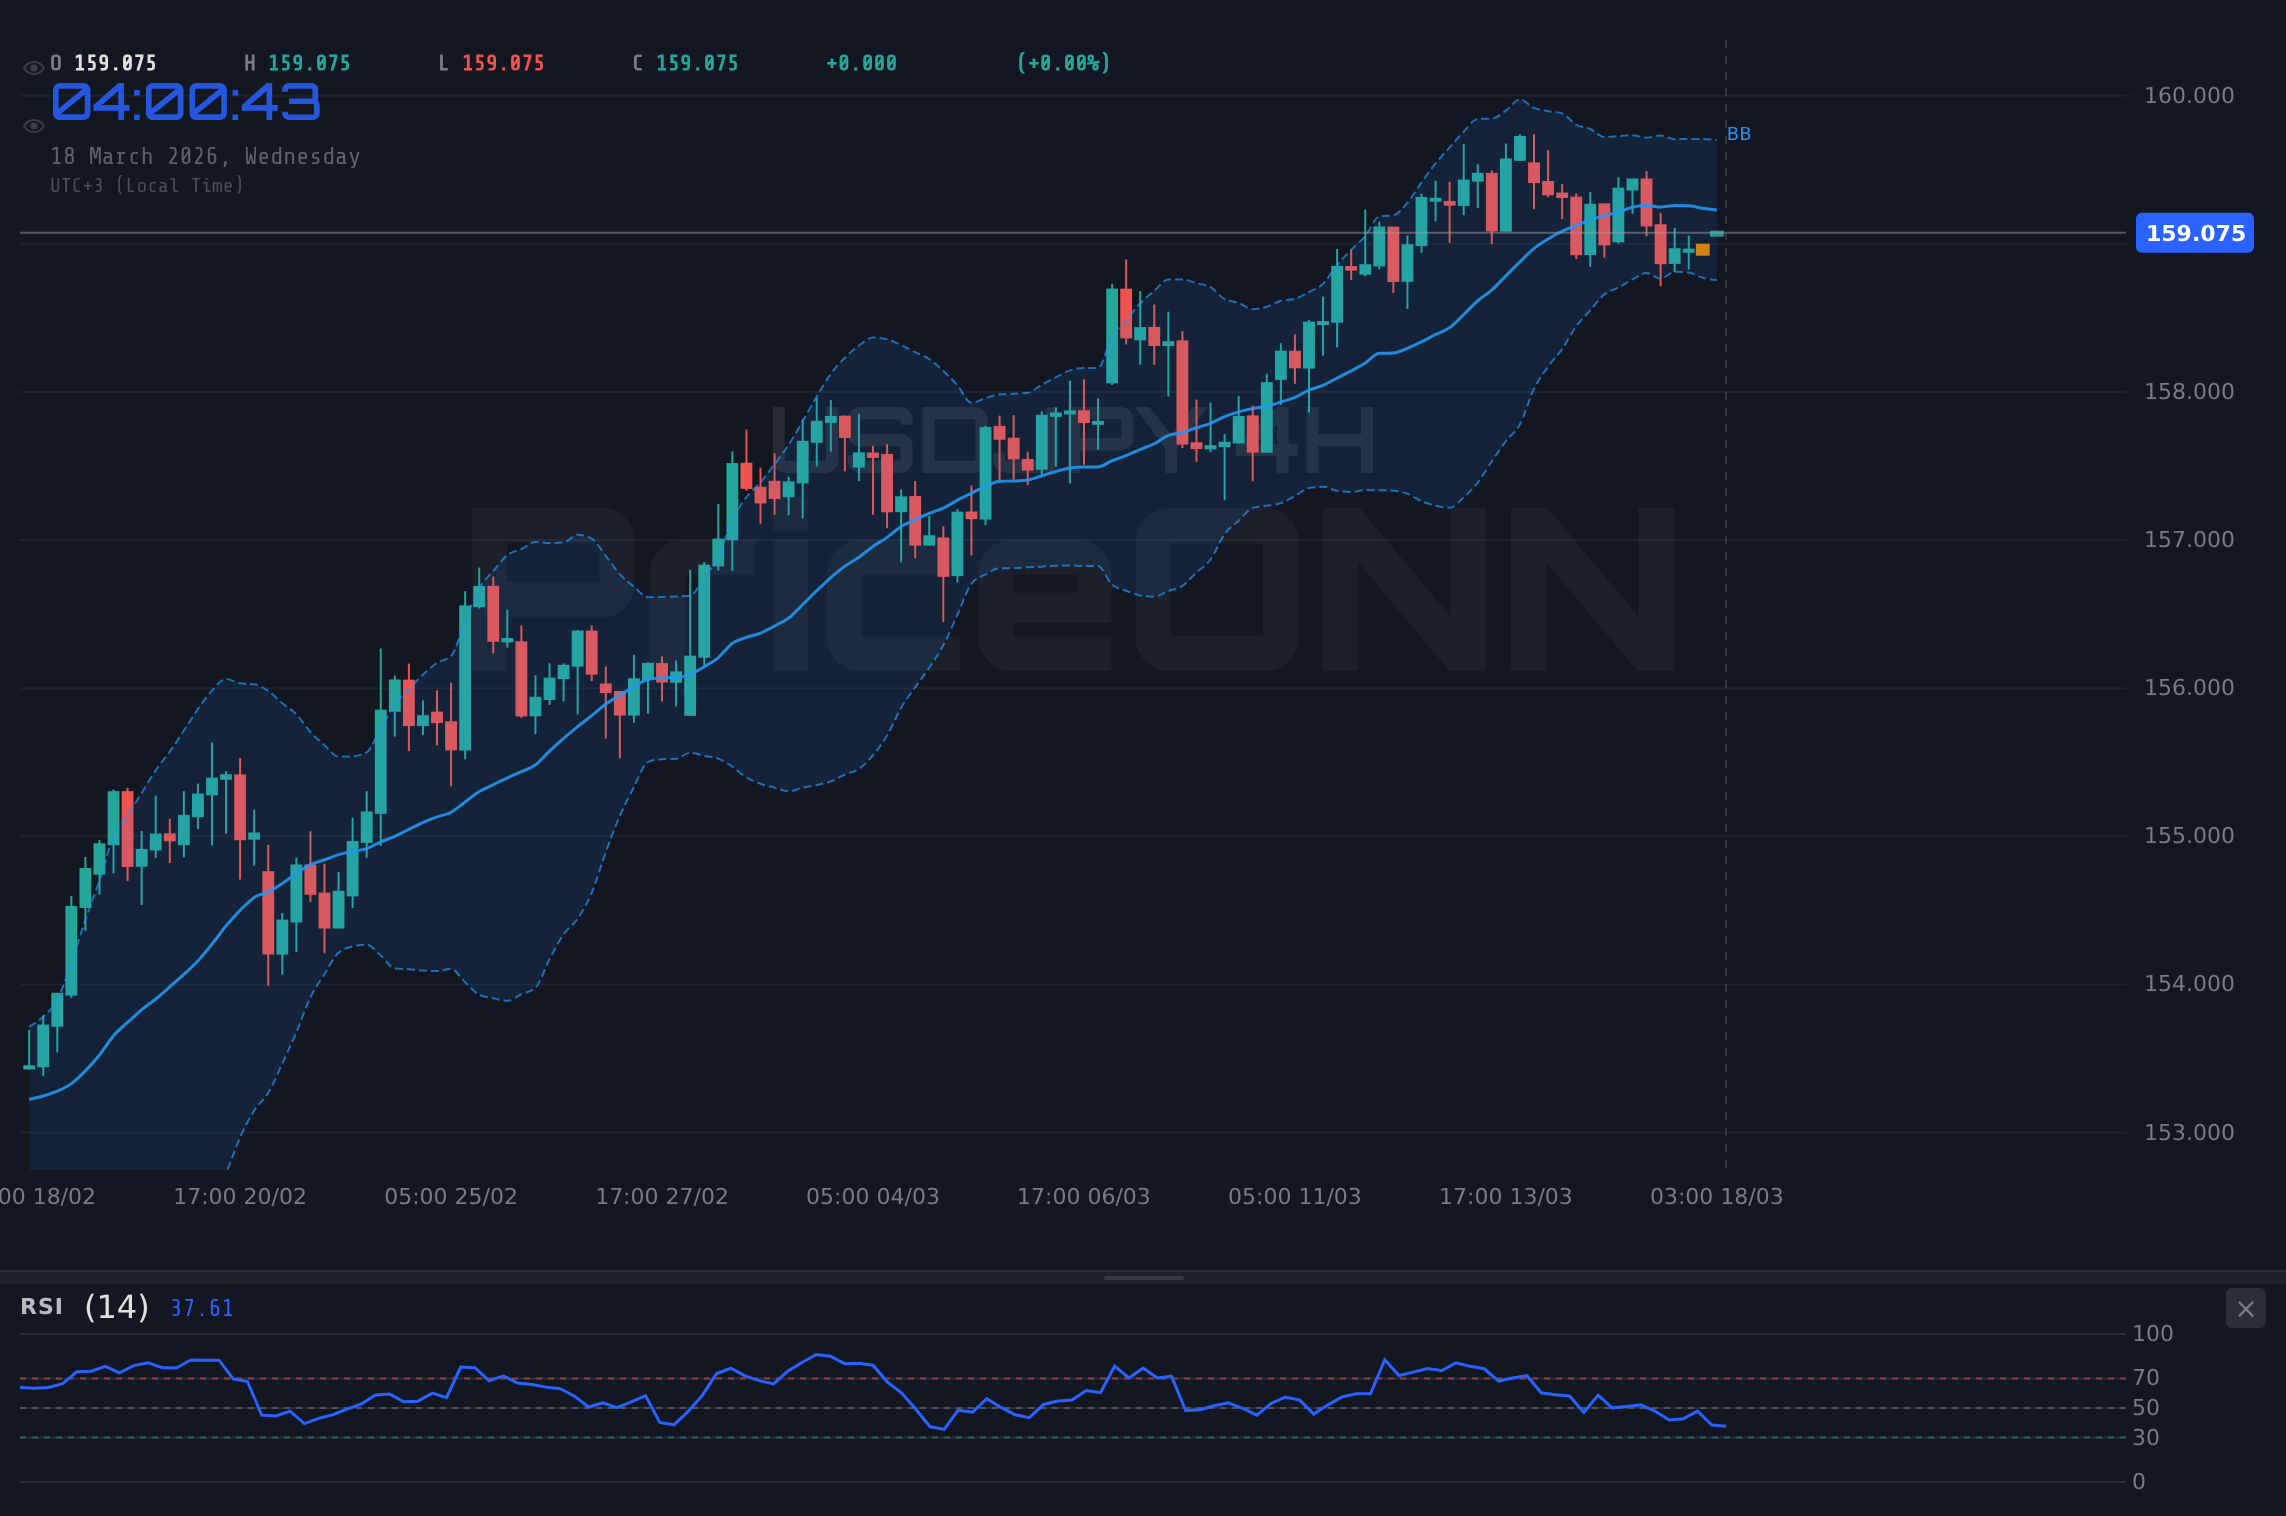
Zooming out to the 4-hour chart, the trend shifts to neutral. The RSI at 49.96 mirrors the 1-hour chart, suggesting indecision in the market. However, the ADX is at 24.22, indicating a moderate uptrend. Key support on this timeframe is at $157.379, $157.102, and $156.934, while resistance lies at $157.824, $157.992, and $158.269. The Stochastic indicator, with K=18.57 and D=30.85, suggests the pair may be oversold on this timeframe, potentially setting the stage for a bounce. Swing traders might look for a confirmed break above $157.824 to initiate long positions.
On the daily chart, the trend remains neutral. The RSI at 60.65 signals a potential bullish bias, while the MACD is positive, suggesting upward momentum. However, the Stochastic oscillator, with K=73.55 and D=83.87, indicates overbought conditions, suggesting a potential pullback. Key support levels on the daily timeframe are $157.216, $156.781, and $155.942, while resistance levels are $158.49, $159.329, and $159.764. Long-term investors should monitor these longer-term levels to assess the overall health of the uptrend.
The Bull's Roadmap: A Break Above $157.929
For the bullish scenario to unfold, USDJPY needs to decisively break above the immediate resistance at $157.929 on the 1-hour chart. If this level is cleared, the next target becomes $158.059. A sustained move above $158.059 could pave the way for a test of the $158.49 resistance level on the daily chart. A key trigger for this scenario would be a weakening of risk aversion, leading to a decline in safe-haven demand for the Yen. The overall signal is AL (Al: 6, Sat: 1, Nötr: 0) on the 1D timeframe. This scenario could play out within the week, with a high probability for the pair to test $159.329.
Where Bears Take Control: Below $157.627
Conversely, the bearish scenario hinges on USDJPY breaking below the $157.627 support level on the 1-hour chart. A sustained move below this level could trigger a sell-off towards the next support at $157.497. If the bears maintain control, the pair could then target the $157.216 support on the daily chart. A strengthening US Dollar, driven by hawkish comments from the Federal Reserve, could act as a catalyst for this scenario. The overall signal is SAT (Al: 3, Sat: 5, Nötr: 0) on the 1H timeframe, suggesting bearish sentiment. This scenario has a moderate probability of playing out, especially if geopolitical tensions continue to escalate.
The Waiting Game: Stuck in a Range
A neutral or range-bound scenario is also plausible, especially if the conflicting forces of safe-haven demand and Dollar strength remain in equilibrium. In this case, USDJPY could oscillate between the $157.627 support and the $157.929 resistance on the 1-hour chart. The ADX at 18.22 on the daily chart indicates a weak trend, supporting this scenario. Traders should watch for a sustained break of either of these levels to signal a clear directional move. This scenario could persist throughout the week, with no clear breakout until further clarity emerges on the geopolitical front or from US economic data.
If USDJPY breaks above $157.929, it could target $158.059 and potentially reach $158.49. This scenario relies on weakening risk aversion and a decline in safe-haven demand for the Yen.
If USDJPY breaks below $157.627, it could trigger a sell-off towards $157.497 and potentially reach $157.216. A stronger US Dollar, driven by hawkish Fed comments, could fuel this move.
Most Likely Scenario: A Cautious Downtrend (50% Probability)
Given the current technical picture and the prevailing geopolitical risks, the most likely scenario is a cautious downtrend for USDJPY. The bearish signals on the 1-hour chart, combined with the potential for a stronger US Dollar, suggest that the pair could break below $157.627 and test lower support levels. However, the safe-haven demand for the Yen could limit the downside, preventing a sharp sell-off. I assign this scenario a probability of 50%, reflecting the balance of conflicting forces. The strong USD has been a constant factor, with the DXY currently sitting at 98.34.
Correlation Analysis: DXY and USDJPY
The Dollar Index (DXY) plays a crucial role in the movements of USDJPY. Currently, the DXY is at 98.34, showing a downtrend on the 1H timeframe. This downtrend in the DXY could provide some support for USDJPY, limiting the potential for a sharp sell-off. However, if the DXY reverses its course and begins to strengthen, it could exert significant downward pressure on USDJPY. Traders should closely monitor the DXY for clues about the future direction of USDJPY. Historically, there has been an inverse relationship between the two, where a strengthening DXY weakens USDJPY and vice versa.
Bond yields can also influence USDJPY. Rising US Treasury yields typically support the US Dollar, putting upward pressure on USDJPY. Conversely, falling yields can weaken the Dollar, leading to a decline in USDJPY. Traders should monitor the 10-year Treasury yield for insights into the direction of USDJPY. Equities can also play a role, but the relationship is less direct. A risk-off environment, characterized by falling equity prices, can boost safe-haven demand for both the Dollar and the Yen, leading to choppy trading in USDJPY.
With US economic data releases scheduled for Wednesday and Friday, volatility in USDJPY is likely to increase. Traders should exercise caution and manage their risk accordingly.
What I'm Watching
I'm closely monitoring the following triggers this week:
- A sustained break above $157.929, which could signal a bullish reversal.
- A break below $157.627, which could trigger a bearish sell-off.
- Developments in the Middle East, which could further fuel safe-haven demand for the Yen.
Frequently Asked Questions: USDJPY Analysis
What happens if USDJPY breaks above $157.929 resistance?
If USDJPY breaks above the $157.929 resistance, it could trigger a bullish move towards $158.059 and potentially $158.49. This scenario is contingent on risk aversion easing and a decline in safe-haven Yen demand.
Should I buy USDJPY at current levels of $157.66 given the bearish signals on the 1H chart?
While the 1H chart shows bearish signals, the longer-term charts are neutral, indicating a potential range-bound scenario. Buying at current levels carries risk, and traders should wait for a confirmed breakout above $157.929 or a breakdown below $157.627 before initiating a position.
Is RSI at 60.65 on the daily chart a sell signal for USDJPY?
An RSI of 60.65 on the daily chart suggests a potential bullish bias, but it's not an outright sell signal. It's important to consider other indicators and price action before making a trading decision. The Stochastic Oscillator signals overbought conditions.
How will the US economic data releases this week affect USDJPY?
US economic data releases, scheduled for Wednesday and Friday, could significantly impact USDJPY. Strong data could strengthen the Dollar, putting downward pressure on the pair, while weak data could weaken the Dollar, providing support for USDJPY.
Technical Outlook Summary
| Indicator | Value | Signal |
|---|---|---|
| RSI (14) | 45.01 | Neutral |
| MACD Histogram | Positive | Positive |
| Stochastic | 70.13/58.81 | Bearish |
| ADX | 23.01 | Strong Downtrend |
| Bollinger | Middle Band | Watch |
Key Levels
Support Levels
Resistance Levels
Track markets in real-time
AI-powered analysis, technical indicators and real-time price data.
Join Our Telegram Channel
Breaking market news, AI analysis and trading signals instantly.
Join Channel