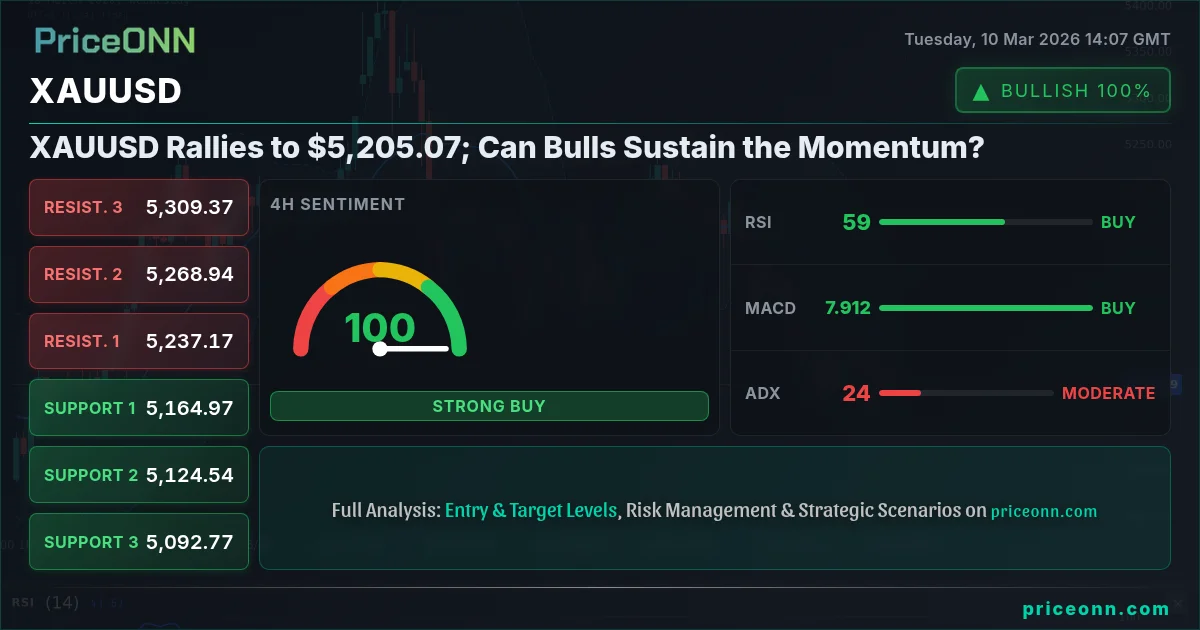
XAUUSD is currently trading at $5,205.07, a level that has traders and analysts closely watching for a potential breakout or a continuation of the bullish trend. The question now is whether the bulls can sustain this momentum amid conflicting technical signals and looming economic data.
- RSI at 67.04 on the 1H chart suggests bullish momentum, but not yet overbought.
- Critical resistance lies at $5,213.97 on the daily timeframe, a break above which could signal further gains.
- MACD histogram on the daily timeframe indicates negative momentum, suggesting potential pullback.
- Geopolitical tensions and DXY weakness are currently supporting XAUUSD, but upcoming USD data could shift the balance.
The Bull's Roadmap: Targeting $5,291
The bullish scenario for XAUUSD hinges on its ability to maintain its position above the immediate support at $5,169.65 on the 1H chart. A sustained break above the $5,206.39 resistance could pave the way for a move towards the next target at $5,213.97 (daily resistance). A successful breach of this level could open the door to the $5,291.37 resistance on the daily timeframe, representing a significant upside potential. This scenario is supported by the overall positive trend on the 1H timeframe, with the ADX at 41.05 indicating a strong uptrend. However, the Stochastic indicator on the 1H chart signals a potential pullback, suggesting that caution is warranted.
For swing traders, the 4H timeframe provides additional insights. A break above the $5,198.72 resistance could confirm the bullish momentum, with a potential target at $5,215.1. The RSI on the 4H chart stands at 56.9, indicating room for further upside. The key trigger to watch for is a confirmed breakout above the $5,206.39 level, accompanied by increased trading volume. This scenario plays out within the next week.
"Gold's rally is supported by geopolitical tensions," one analyst noted. "Continued instability could drive further safe-haven demand, pushing XAUUSD higher."
Where Bears Take Control: A Drop Below $5,162
The bearish scenario for XAUUSD would unfold if the price fails to hold above the $5,169.65 support on the 1H chart. A sustained break below this level could trigger a decline towards the next support at $5,162.15 on the 4H timeframe. Further weakness could then target the $5,141.96 support, also on the 4H chart. A breach of this level would likely lead to a test of the $5,125.58 support, potentially signaling a more significant correction. This scenario is supported by the negative momentum on the daily MACD histogram, suggesting that selling pressure may be building. The Stochastic indicator on the 1H chart also points to a potential pullback, reinforcing the bearish outlook.
The DXY is currently at 98.49, which is putting downward pressure on gold. If the DXY continues to increase, we could see the bearish scenario play out. According to Reuters, the Fed is expected to maintain its hawkish stance, which could boost the dollar and weigh on gold.
The Waiting Game: Range-Bound Trading Between $5,169 and $5,206
A neutral scenario could emerge if XAUUSD remains range-bound between the $5,169.65 support and the $5,206.39 resistance on the 1H timeframe. In this case, traders may look for short-term opportunities within this range, buying near the support and selling near the resistance. The ADX on the 1H chart is at 13.54, indicating a weak trend and suggesting that the price may lack the momentum to break out of the range. The RSI on the 1H chart is at 67.04, hovering in the neutral zone and further supporting the possibility of range-bound trading. In this scenario, patience and disciplined risk management are key, as the market awaits a clear catalyst to trigger a sustained breakout or breakdown.
Most Likely Scenario and Key Triggers
Based on the current technical picture and market context, the most likely scenario is a short-term pullback followed by a potential bullish continuation (50% probability). The negative momentum on the daily MACD histogram and the Stochastic indicator on the 1H chart suggest that a temporary correction is likely. However, the overall positive trend on the 1H and 4H timeframes, combined with geopolitical tensions and DXY weakness, supports the possibility of a bullish continuation in the medium term.
Key triggers to watch this week include:
- A confirmed breakout above the $5,206.39 resistance on the 1H chart, signaling a potential move towards the $5,213.97 resistance on the daily timeframe.
- A sustained break below the $5,169.65 support on the 1H chart, triggering a decline towards the $5,162.15 support on the 4H timeframe.
- Upcoming U.S. economic data releases, including the March 11th release, which could influence the direction of the USD and impact XAUUSD.
Technical Outlook Summary
| Indicator | Value | Signal |
|---|---|---|
| RSI (14) | 67.04 | Neutral |
| MACD Histogram | Negative | Bearish |
| Stochastic | K=66.28, D=72.9 | Bearish |
| ADX | 13.54 | Weak Trend |
| Bollinger | Middle Band | Neutral |
Key Levels
Support Levels
Resistance Levels
If XAUUSD breaks above $5,206.39 with strong volume, the next target is $5,213.97. A sustained move above this level could lead to $5,291.37 within the next week. The bullish trend is supported by the ADX, but watch for Stochastic pullback.
If XAUUSD fails to hold $5,169.65, a decline towards $5,162.15 is likely. A break below this level could trigger a sharper correction towards $5,141.96 and potentially $5,125.58. This scenario is supported by negative momentum on the MACD.
Frequently Asked Questions: XAUUSD Analysis
What happens if XAUUSD breaks above $5,206.39 resistance?
If XAUUSD breaks above $5,206.39, the next target is $5,213.97, which is the daily resistance. A sustained move above $5,213.97 could then lead to $5,291.37.
Should I buy at current $5,205.07 levels given RSI at 67.04?
With the RSI at 67.04, the market is approaching overbought conditions, so a pullback is possible. Wait for confirmation of the breakout above $5,206.39 to ensure momentum before entering a long position.
Is MACD histogram negative momentum a sell signal for XAUUSD?
The negative MACD histogram suggests the bullish momentum is fading. It's not a definitive sell signal but a warning sign. Look for confirmation with a break below $5,169.65 before considering a short position.
How will the March 11th USD data affect XAUUSD this week?
The March 11th USD data release could influence the dollar's strength, impacting XAUUSD. Strong data could boost the USD and put downward pressure on XAUUSD, while weak data could weaken the USD and support XAUUSD.
Track markets in real-time
AI-powered analysis, technical indicators and real-time price data.
Join Our Telegram Channel
Breaking market news, AI analysis and trading signals instantly.
Join Channel