

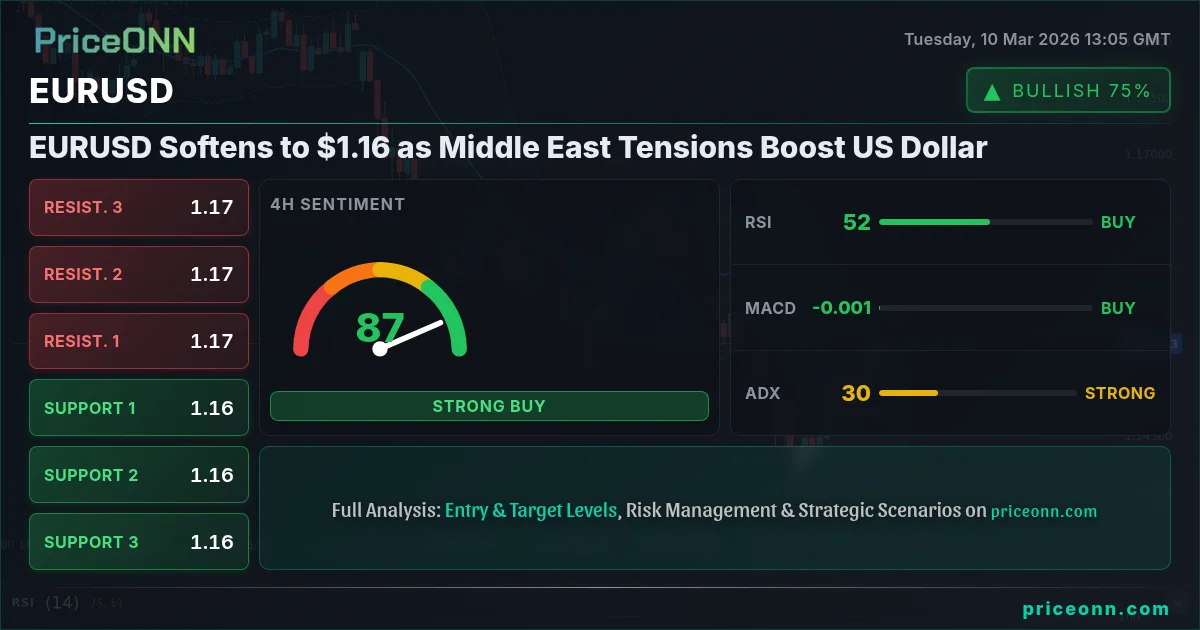
EURUSD today analysis reveals a key tension point around the $1.16 level, where bulls and bears are locked in a fierce battle. Will the bulls manage to defend this critical support, or are we poised for a deeper correction? The answer lies in understanding the interplay of technical indicators, macroeconomic factors, and geopolitical risks currently influencing the pair.
- EURUSD currently trades around $1.16, a pivotal level where bullish and bearish forces are clashing.
- Key support level to watch sits at 1.15488, a break below which could trigger further downside.
- The MACD on the daily chart shows negative momentum, indicating potential for further declines.
- Geopolitical tensions in the Middle East and DXY strength are key drivers impacting EURUSD.
The Bull Case for EURUSD
Despite the overall bearish sentiment, there are arguments to be made for a potential bullish reversal. The 1-hour and 4-hour timeframes show a bullish trend with strong momentum, as indicated by the ADX readings of 28.74 and 31.88 respectively. The Relative Strength Index (RSI) on both timeframes is in neutral territory (57.07 and 55.54), suggesting that there is room for further upside before the pair becomes overbought. Additionally, the Stochastic oscillator on the daily chart is displaying a bullish signal, with %K at 36.18 and %D at 29.9, indicating that the pair may be oversold in the short term. A potential catalyst for a bullish move could be weaker-than-expected US economic data, as the market has already priced in a hawkish stance from the Federal Reserve.
Moreover, the recent news of GBP/JPY advancing as markets scale back BoE rate-cut expectations could indirectly bolster the EUR, as both currencies are influenced by European economic conditions. The first resistance level to watch is 1.16481, a break above which could open the door for a test of higher levels. A key level to watch is 1.1679, as breaking this resistance could signal a shift in momentum. The bulls will be looking for a sustained move above this level to confirm the bullish thesis. A weaker DXY could also provide a boost to EURUSD. The dollar index is currently at 98.43 and is showing signs of weakness on the hourly chart, with the RSI at 45.31 and ADX at 28.31, indicating a strong downtrend.
The Bear Case for EURUSD
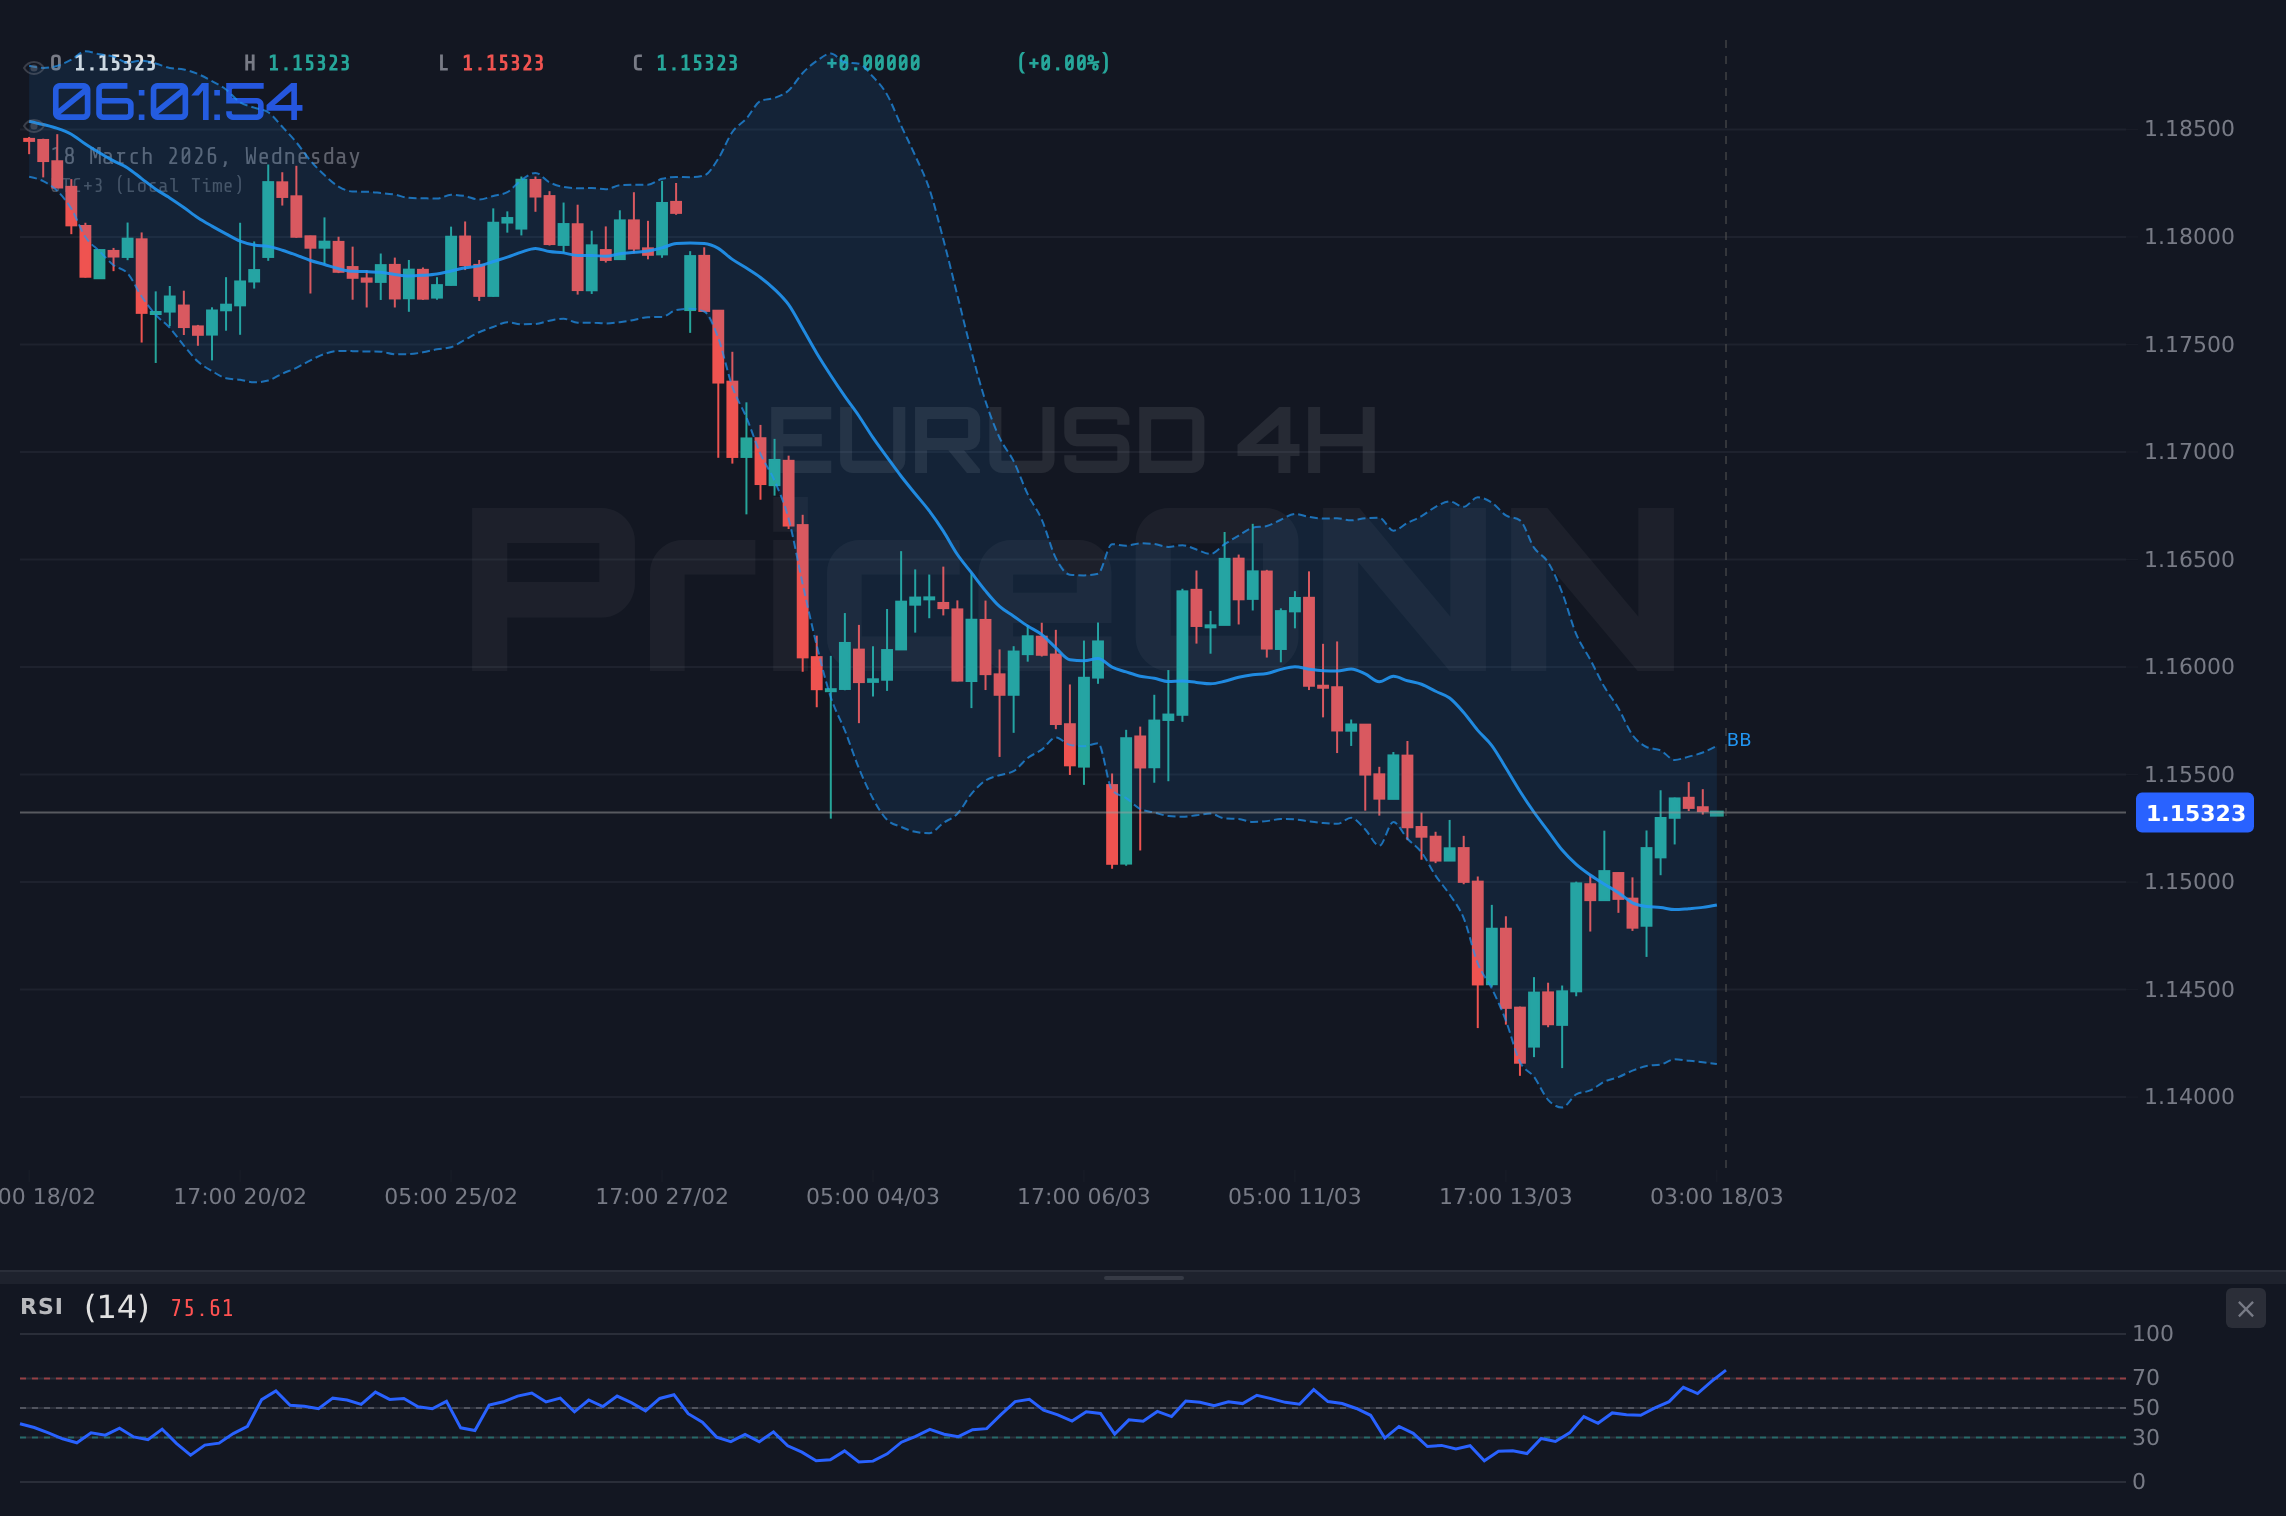
The bearish case for EURUSD is primarily driven by the strength of the US Dollar and the ongoing geopolitical tensions in the Middle East. The daily chart paints a bearish picture, with a strong downtrend indicated by an ADX of 27.76. The RSI at 38.01 suggests that there is still room for further downside before the pair becomes oversold. The MACD histogram is also negative, indicating that bearish momentum is dominant. As reported by several news outlets, the turmoil in the Middle East is boosting the US Dollar, putting pressure on EURUSD. According to Reuters, the Fed is likely to maintain its hawkish stance, which could further strengthen the dollar.
From a technical perspective, a break below the key support level of 1.15488 could trigger a sharp sell-off, with the next support level to watch at 1.14624. The EURUSD macroeconomic factors continue to weigh on the pair, with concerns about the Eurozone's economic outlook and the potential for further interest rate hikes by the European Central Bank. The pair is trading below the middle band of the Bollinger Bands on the daily chart, further confirming the bearish trend. The first support level to watch is 1.16314, a break below which could open the door for a test of lower levels. The bears will be looking for a sustained move below this level to confirm the bearish thesis.
Technicals as a Tiebreaker: What the Indicators Say
Analyzing the technical indicators across multiple timeframes provides a more nuanced picture of the EURUSD market. On the 1-hour chart, the RSI is at 57.07, suggesting that the pair is neither overbought nor oversold. However, the Stochastic oscillator is displaying a bearish signal, with %K at 53.95 and %D at 67.96. This indicates that the bullish momentum may be fading. The MACD is showing signs of convergence, which could signal a potential trend reversal. On the 4-hour chart, the RSI is at 55.54, also suggesting that the pair is in neutral territory. The Stochastic oscillator, however, is displaying a bullish signal, with %K at 85.01 and %D at 72.24. This indicates that there may be some upward momentum in the short term. The ADX is at 31.88, indicating a strong uptrend.
Looking at the daily chart, the RSI is at 38.01, suggesting that the pair is approaching oversold territory. The Stochastic oscillator is displaying a bullish signal, with %K at 36.18 and %D at 29.9. However, the MACD histogram is negative, indicating that the bearish momentum is still dominant. The ADX is at 27.76, indicating a strong downtrend. Overall, the technical indicators are providing mixed signals, making it difficult to definitively call the direction of the EURUSD pair. This highlights the importance of combining technical analysis with fundamental analysis and risk management.
Trade Plan: Riding the Bearish Momentum (65% Probability)
Given the overall bearish sentiment and the strong downtrend on the daily chart, a short trading strategy appears to be the more probable scenario. The ADX at 27.76 supports a strong trend, while the MACD histogram confirms the negative momentum. The Stochastic oscillator is providing a bullish signal, but this could be a temporary pullback before the downtrend resumes.
Enter short if EURUSD breaks below 1.16314, targeting 1.15488 and then 1.14624. This scenario relies on continued USD strength driven by geopolitical tensions and hawkish Fed expectations.
A surprise dovish shift from the Fed could trigger a rally. Watch for a break above 1.16481, targeting 1.1679 and then 1.17228. However, this scenario is less likely given the current market conditions.
Entry Trigger: A confirmed break below 1.16314 would serve as the entry trigger for a short position. This level has acted as a key support in the short term, and a break below it would signal further downside potential.
Target 1: The first target would be 1.15488, which is the next significant support level on the daily chart. This level has previously acted as a strong support, and a break below it could trigger a sharp sell-off.
Target 2: The second target would be 1.14624, which is the next major support level on the daily chart. This level has acted as a strong support in the past, and a break below it could signal a deeper correction.
Stop/Invalidation: The stop-loss level would be placed above 1.16481, which is the first resistance level on the hourly chart. This level has acted as a key resistance in the short term, and a move above it would invalidate the bearish thesis.
Upcoming US economic data releases on Wednesday and Friday could significantly impact the EURUSD pair. Be prepared for increased volatility and adjust your risk management accordingly.
Frequently Asked Questions: EURUSD Analysis
What happens if EURUSD breaks below 1.16314 support?
A break below the 1.16314 support level could trigger a sharp sell-off, with the next target being the 1.15488 level. This scenario is supported by the bearish momentum on the daily chart and the strength of the US Dollar.
Should I short EURUSD at current $1.16 levels given the RSI at 38?
While the RSI at 38 suggests the pair is approaching oversold territory, it is not yet a definitive buy signal. A more conservative approach would be to wait for a confirmed break below the 1.16314 support level before entering a short position.
Is the negative MACD histogram on the daily chart a reliable sell signal for EURUSD?
The negative MACD histogram indicates that bearish momentum is dominant, which supports the bearish thesis. However, it is important to combine this signal with other technical indicators and fundamental analysis before making a trading decision.
How will the upcoming US economic data on Wednesday affect EURUSD this week?
Stronger-than-expected US economic data could further strengthen the US Dollar, putting downward pressure on EURUSD. Conversely, weaker-than-expected data could weaken the dollar and provide a boost to the pair.
Technical Outlook Summary
| Indicator | Value | Signal |
|---|---|---|
| RSI (14) | 38.01 | Neutral |
| MACD Histogram | Negative | Bearish |
| Stochastic | K=36.18, D=29.9 | Bullish |
| ADX | 27.76 | Strong Downtrend |
| Bollinger | Middle Band | Below |
Key Levels
Support Levels
Resistance Levels
Track markets in real-time
AI-powered analysis, technical indicators and real-time price data.
Join Our Telegram Channel
Breaking market news, AI analysis and trading signals instantly.
Join Channel