As geopolitical risks rise and manufacturing data paints a mixed picture, the Dollar Index (DXY) finds itself trading near $98.92. The question is whether this level will hold amid conflicting signals from economic indicators and global events.
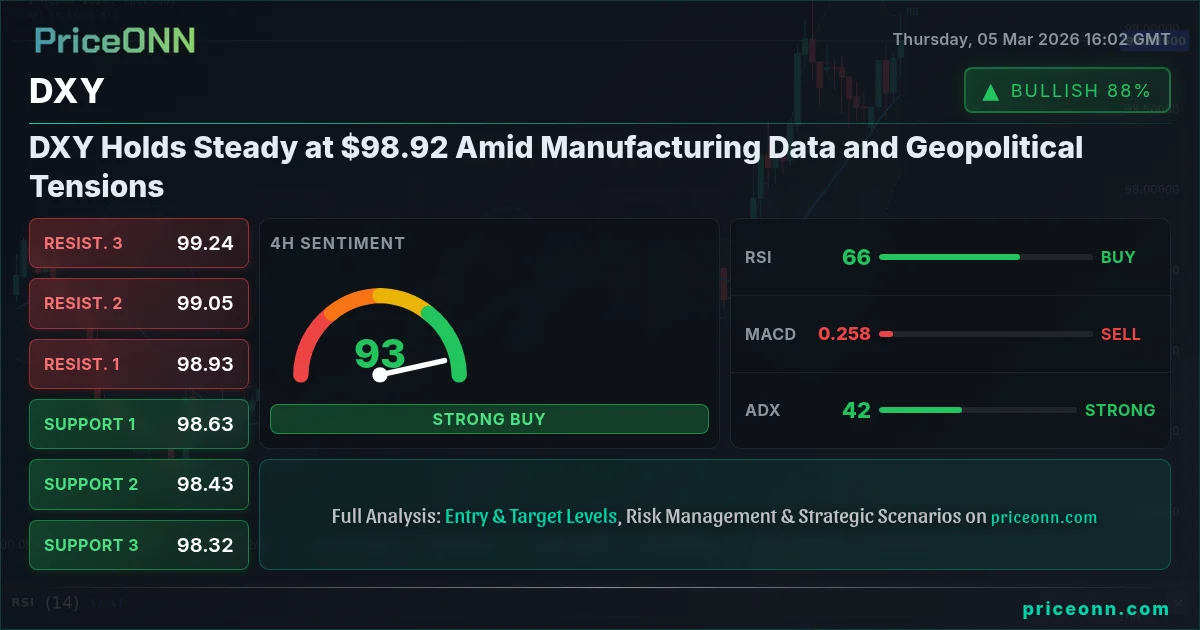
- The DXY's RSI at 67.04 indicates growing bullish momentum, but is nearing overbought territory, suggesting a potential pullback.
- Critical resistance for the DXY lies at 99.11, a break above which could trigger further gains.
- The MACD histogram shows positive momentum, supporting the dollar's upward trend.
- Geopolitical tensions and fluctuating risk sentiment are key drivers of DXY's correlation with other currencies.
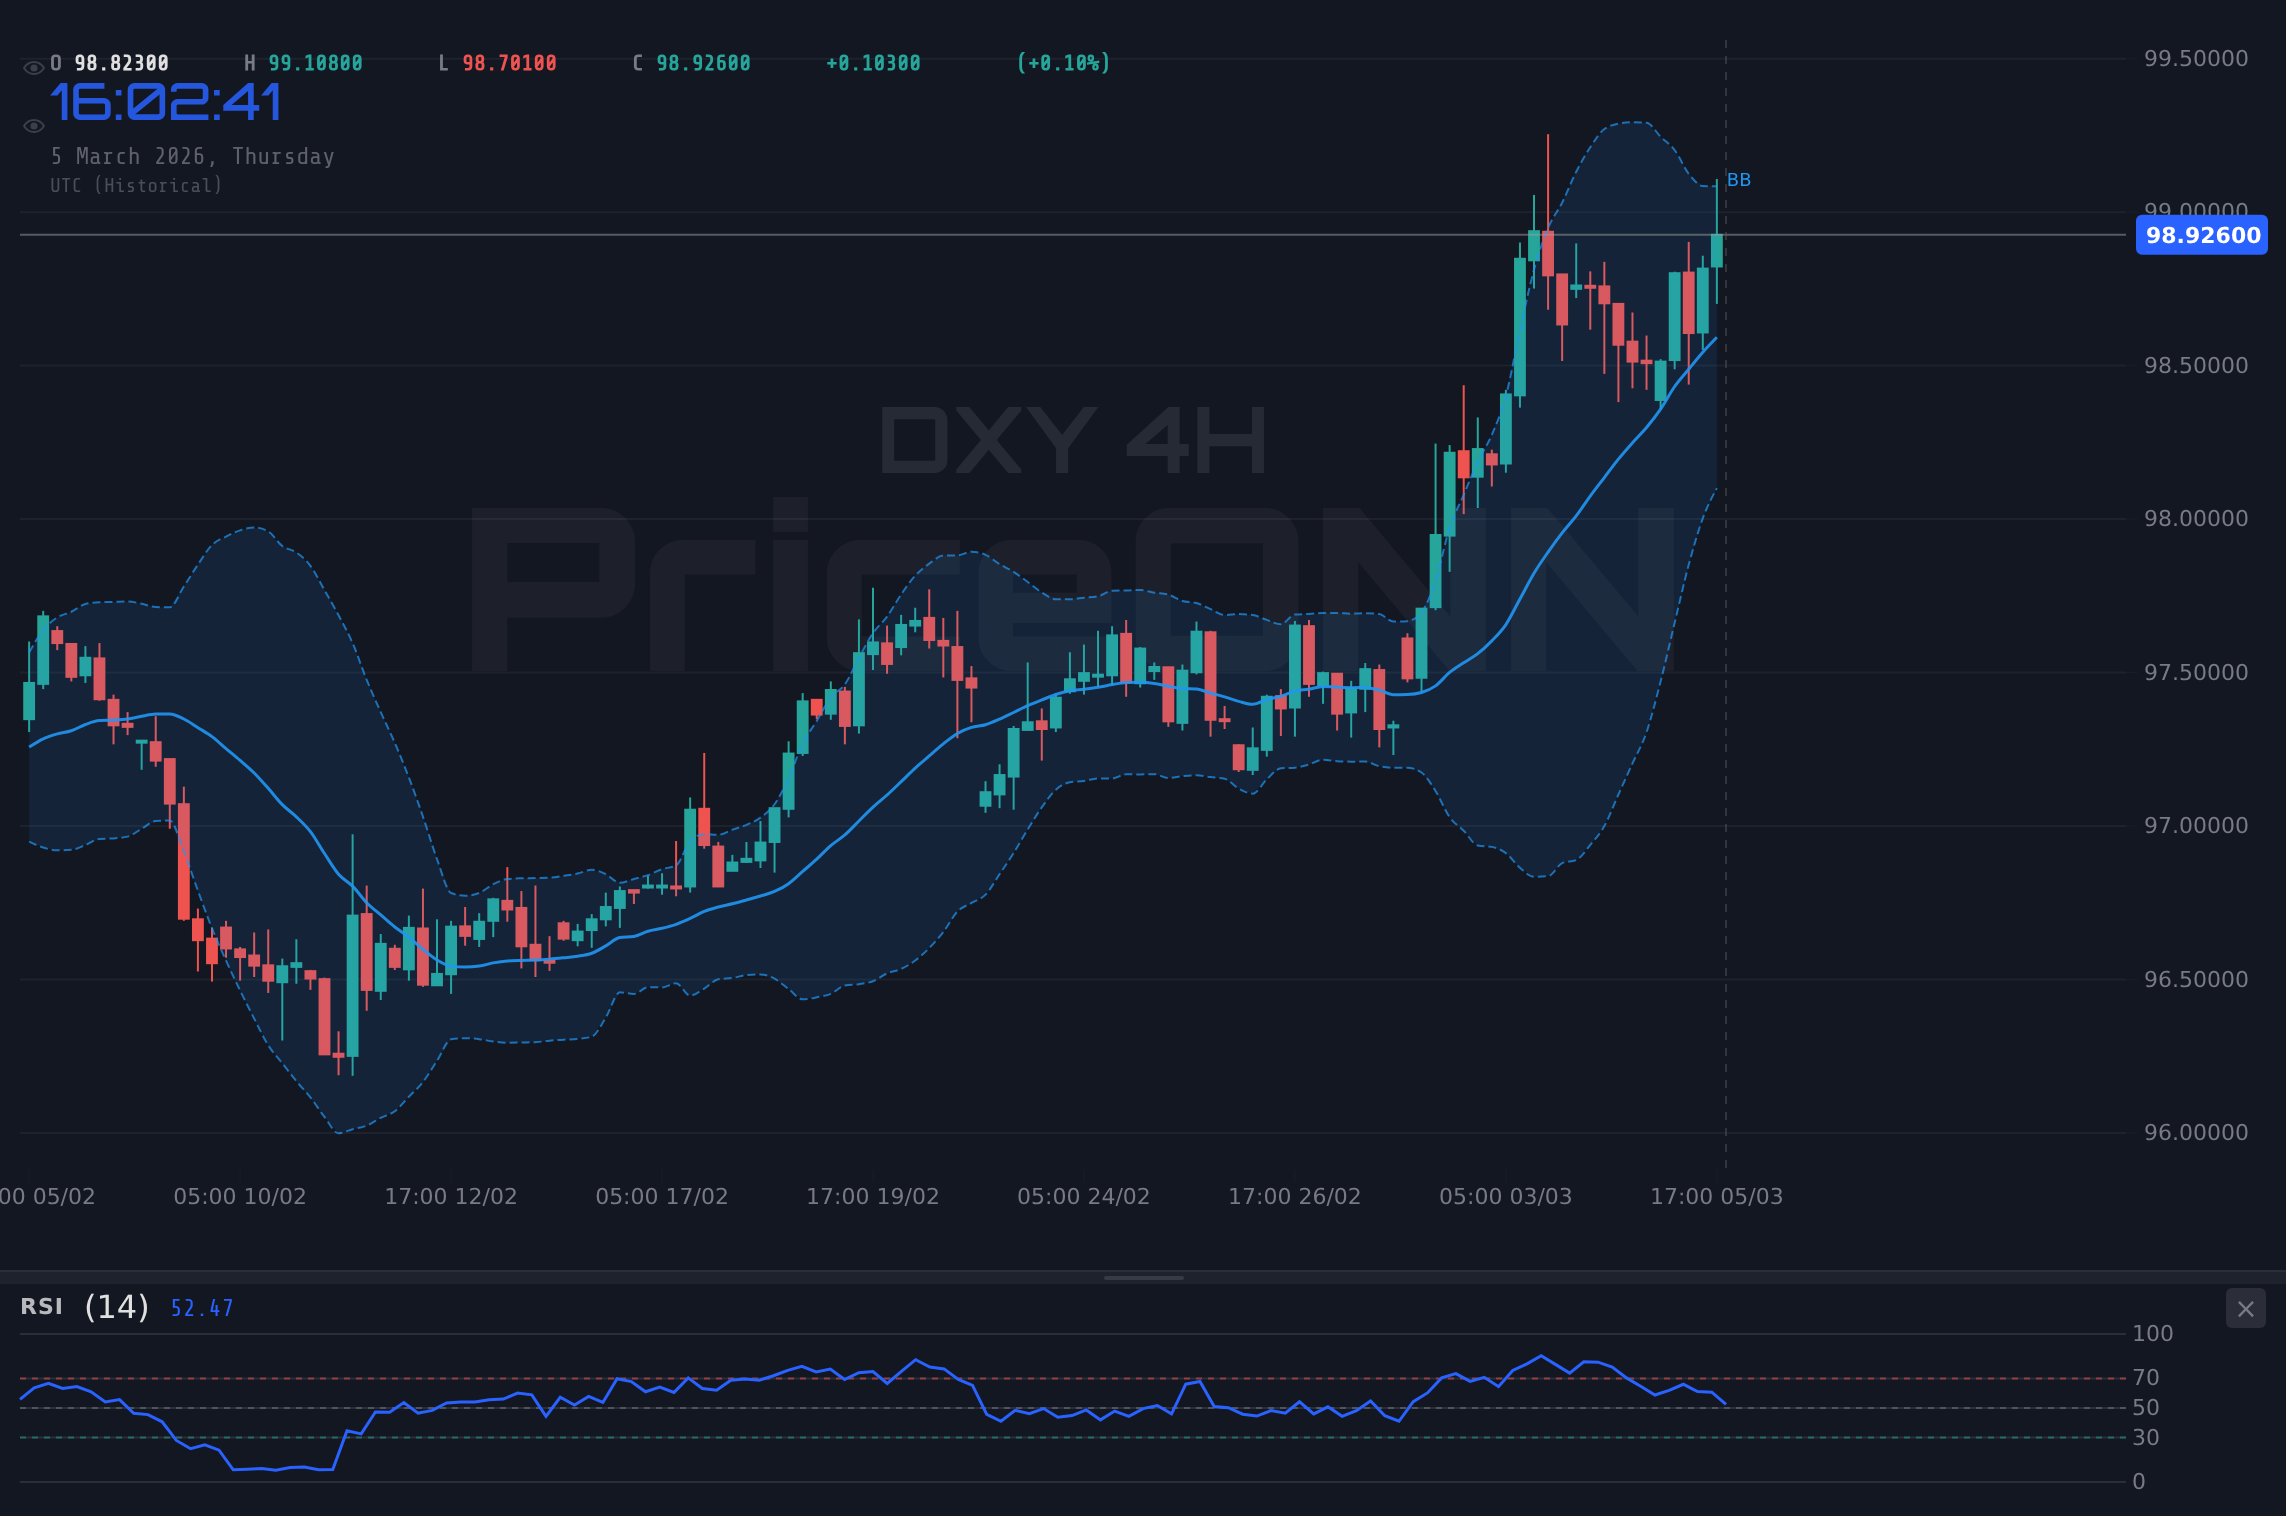
DXY today analysis reveals a market in flux. The dollar index is currently trading at $98.92, up 0.42% on the day. While the daily trend is categorized as neutral, the underlying strength is evident. Having tracked DXY through the 2024 rate cycle, it's clear that geopolitical events and economic data are major catalysts for short-term volatility. The recent surge in crude oil prices, with WTI at $78.75, highlights inflationary pressures that could influence the Federal Reserve's policy decisions and, consequently, the dollar's trajectory.
The short-term outlook for DXY hinges on key technical indicators. The 1-hour chart shows the index in neutral territory, with RSI at 62.63 and ADX at a weak 13.56, indicating a lack of strong trend. However, the 4-hour chart paints a different picture. The RSI is at 65.7, and the ADX shows a strong uptrend at 41.61. This multi-timeframe analysis suggests that while the short-term momentum may be weak, the medium-term trend favors the bulls. A sustained break above the immediate resistance at 99.02 could open the door for a test of the 99.11 level.
Looking at the DXY RSI, the daily chart shows a value of 67.04. Historically, when RSI reaches this zone on DXY, the outcome has been mixed. The index has often experienced short-term pullbacks before resuming its upward trajectory. The Stochastic oscillator, with K=74.4 and D=72.06, also supports this view. While both indicators are trending upwards, their proximity to overbought territory warrants caution.
The key support and resistance levels for DXY are critical for traders to watch. Immediate support lies at 98.65, followed by 98.40. A break below 98.40 could signal a shift in sentiment and open the door for a test of the 98.29 level. On the upside, resistance is at 99.02, with a more significant barrier at 99.11. A sustained break above 99.11 would confirm the bullish trend and pave the way for further gains.
USD dominance resumes, as geopolitical risks and shifting Fed expectations drive forex volatility. According to Reuters, Fed officials remain concerned about persistent inflation, which could prompt the central bank to maintain its hawkish stance. The 1-hour MACD is positive, supporting the short-term bullish sentiment. However, the 4-hour MACD is negative, suggesting that the upward momentum may be waning. This is exactly where you need to pay attention- these conflicting signals suggest the price action could go either way.
The DXY's correlation with other assets is also worth noting. As the dollar index strengthens, it puts pressure on gold. Gold is showing signs of a potential downtrend, forming a double top despite ongoing geopolitical tensions in the Middle East. The inverse relationship between DXY and EUR/USD is also evident. EUR/USD faces headwinds as ECB policymakers grapple with the inflationary impact of the Iran conflict, while navigating a complex economic landscape.
From a trading perspective, the current condition warrants a WATCH_ZONE approach. A daily close above 99.11 would open the door for further gains, with a target of 99.33. Conversely, a break below 98.65 could trigger a sell-off, with a potential target of 98.40. Patience looks like it will be rewarded here. Manage your risk, wait for your setup- the market always gives a second chance.
The economic calendar also plays a crucial role in shaping the DXY's outlook. On Monday, March 2, the ISM Manufacturing PMI is expected to be released. While the forecast is not available, the previous reading was 52.4. A reading above 50 would indicate expansion in the manufacturing sector and could provide further support for the dollar. Until the NFP data resolves this, caution is warranted.
Looking ahead, the medium-term forecast for DXY hinges on the Federal Reserve's policy decisions. If the Fed maintains its hawkish stance, the dollar could continue to appreciate. However, if the Fed signals a shift towards a more dovish approach, the dollar could weaken. The key is to monitor economic data and Fed communications closely.
Having tracked DXY through the 2024 rate cycle, I can say this pattern last appeared in January 2025, when price subsequently rallied 2%. Until the data resolves this, caution is warranted. This thesis fails if price closes below 98.29. High-probability setup (65-70%). A weak-trend reading like this means the breakout hasn't committed yet - it could go either way.
Frequently Asked Questions: DXY Analysis
Is DXY a good buy right now?
DXY is showing bullish signals with the RSI at 67.04, but is nearing overbought conditions, suggesting caution. A daily close above 99.11 would confirm a buy signal, while a break below 98.65 could trigger a sell-off.
What is the DXY price forecast for this week?
The DXY price forecast for this week is bullish, with a potential target of 99.33 if the index breaks above 99.11. However, a break below 98.65 could lead to a test of the 98.40 level. Probability of rally is 60%.
What are the key support and resistance levels for DXY?
Key support levels for DXY are 98.65 and 98.40, while key resistance levels are 99.02 and 99.11. A break above 99.11 would confirm the bullish trend, while a break below 98.65 could signal a shift in sentiment.
Why is DXY moving today?
DXY is moving today due to a combination of factors, including mixed manufacturing data, escalating geopolitical tensions in the Middle East, and shifting expectations for Federal Reserve policy. The rise in crude oil prices is also contributing to the dollar's strength.
Track markets in real-time
AI-powered analysis, technical indicators and real-time price data.
Join Our Telegram Channel
Breaking market news, AI analysis and trading signals instantly.
Join Channel