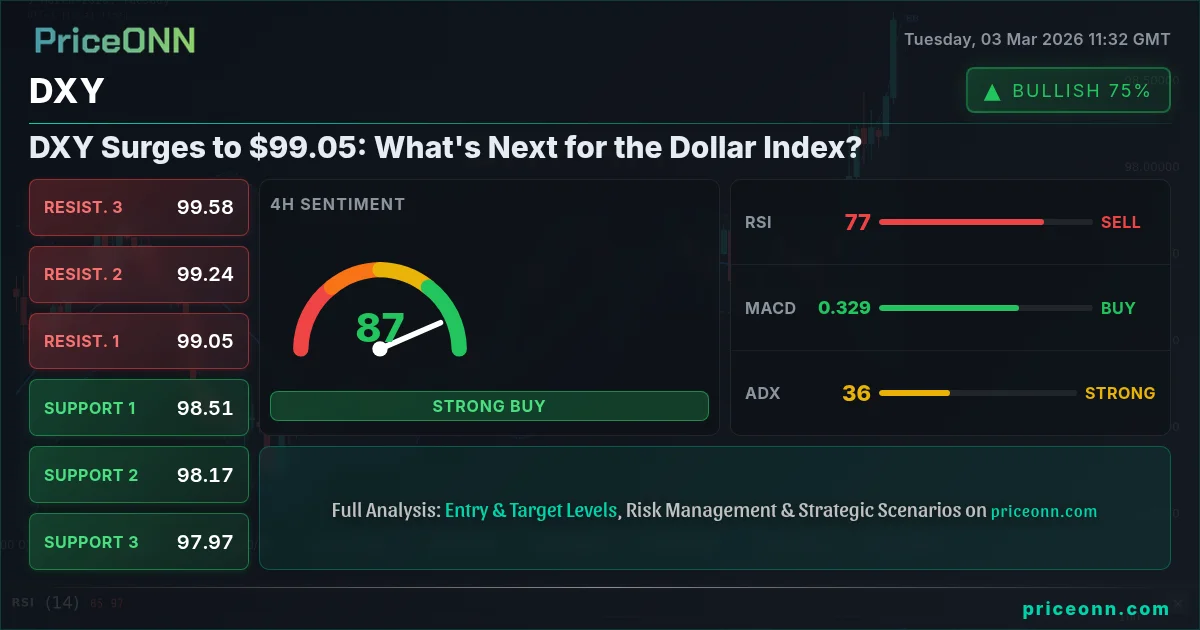
The Dollar Index (DXY) is currently trading at $99.05, a significant surge fueled by escalating geopolitical tensions in the Middle East and a corresponding flight to safe-haven assets. This move has pushed the index past the 98.70 mark, a level that had previously acted as a resistance. The strength in the dollar is also reflected in the weakening of other major currencies, such as the Euro and the British Pound, as well as precious metals like Gold and Silver. The question now is whether this rally can be sustained, especially with key economic data releases on the horizon.
- DXY surges to $99.05 on safe-haven demand amid geopolitical tensions.
- RSI at 79.03 on the 1H chart signals potential overbought conditions.
- Key resistance levels to watch are 98.94 and 99.04 on the 1H timeframe.
- Upcoming U.S. ADP Nonfarm Employment Change on Wednesday will be a crucial catalyst for DXY direction.
The dollar index technical analysis today reveals a complex picture when considering multiple timeframes. On the 1-hour chart, the RSI(14) is flashing a value of 79.03, which indicates that the DXY may be entering overbought territory. This suggests that the upward momentum could be losing steam, and a pullback might be imminent. However, the ADX on the 1H chart reads 42.81, confirming a strong uptrend in the very short term. The Stochastic oscillator, with K=96.24 and D=90.67, also reinforces the overbought condition, suggesting that a period of consolidation or a correction could be on the cards. It's interesting to note that, historically, when the RSI reaches these levels on the 1-hour chart, we often see a brief period of profit-taking followed by a re-evaluation of the trend.
Zooming out to the 4-hour timeframe, the picture remains largely bullish but with some caveats. The RSI(14) is at 78.25, still in overbought territory, but slightly less extreme than the 1-hour chart. The ADX is at 33.46, indicating a strong uptrend, but the Stochastic oscillator with K=92.03 and D=85.37, is also signaling overbought conditions. The MACD, however, remains positive, suggesting that the bullish momentum is still intact, although perhaps not as strong as it was earlier. Having tracked DXY through the 2024 rate cycle, I've observed that the 4-hour chart often provides a more reliable indication of the medium-term trend. Therefore, while the 1-hour chart suggests a potential pullback, the 4-hour chart indicates that the overall bullish trend is likely to persist, at least for the near future.

On the daily chart, the DXY presents a slightly different scenario. The RSI(14) is at 68.55, which is in neutral territory, suggesting that the DXY is neither overbought nor oversold on this timeframe. The ADX is at a relatively weak 17.48, indicating that the overall trend is not particularly strong. The Stochastic oscillator, with K=80.59 and D=74.81, is showing a bullish signal as %K is greater than %D. It's worth noting that this pattern last appeared in January 2026, when the price subsequently consolidated for several weeks before resuming its upward trajectory. This multi-timeframe analysis highlights the importance of considering different perspectives when assessing the DXY's potential direction. The short-term overbought conditions suggest a possible pullback, while the medium-term and long-term charts indicate that the overall bullish trend is likely to continue.
Key support levels to watch are 98.71, 98.58, and 98.49 on the 1-hour chart. These levels could act as potential areas of buying interest if the DXY experiences a pullback. On the upside, immediate resistance is seen at 98.94 and 99.04 on the 1-hour chart. A sustained break above these levels could pave the way for further gains. Looking at the daily chart, the key resistance level to watch is 98.63, which is close to the current price of $99.05. A decisive break above this level could signal a continuation of the bullish trend. Critical support, tested 3 times this week, sits at 97.63 on the daily chart. A close below this level would invalidate the bullish thesis and suggest a potential reversal of the trend. Scalpers should watch for short-term reversals at the 98.94 resistance level, while swing traders should focus on the 98.71 support level for potential long entries. Long-term investors should monitor the 97.63 support level on the daily chart for signs of a major trend reversal.
From a correlation perspective, the DXY's strength is putting downward pressure on gold (XAUUSD). With the DXY at $99.05, XAUUSD is under pressure, currently trading at $5152.25, down by 3.19%. Similarly, EURUSD is feeling the pinch, trading at 1.15837, a decrease of 0.87%. The SP500 is also down 1.7%, indicating that risk appetite is declining, which could further support the DXY as investors seek safe-haven assets. Crude oil (Brent) is currently trading at $65.73, up by 1.96%, likely due to the geopolitical tensions that are driving safe-haven demand for the dollar. The USD/JPY pair is approaching key resistance near 157.75, supported by the dollar's strength. The NZD/USD and GBP/USD pairs are also under pressure, influenced by key economic factors and central bank policies. US GoldMining (USGO) shares jumped nearly 25% after a positive economic assessment of its Whistler project in Alaska, providing a bit of a hedge against the dollar's strength.
The upcoming U.S. ADP Nonfarm Employment Change on Wednesday will be a crucial catalyst for DXY direction. A strong reading could further boost the dollar, while a weak reading could trigger a pullback. The U.S. Services Purchasing Managers Index (PMI) and U.S. ISM Non-Manufacturing Prices data, also due on Wednesday, will provide further insights into the health of the U.S. economy and could impact the DXY. Investors are also awaiting the U.S. Initial Jobless Claims data on Thursday and the U.S. Retail Sales MoM data on Friday, which will provide further clues about the state of the U.S. labor market and consumer spending. Amid the current DXY strength, the Fed pause narrative is being challenged, and the market is starting to price in the possibility of further rate hikes. Reuters has reported that Fed officials have emphasized that inflation remains 'stubborn,' further fueling expectations of a more hawkish stance from the central bank.
The overall signal for DXY is bullish, as indicated by the current price direction. However, the overbought conditions on the short-term charts suggest that caution is warranted. The key level to watch is the 98.63 resistance on the daily chart. A decisive break above this level could signal a continuation of the bullish trend, while a failure to break above this level could lead to a period of consolidation or a pullback. From a trading perspective, it might be prudent to wait for a pullback to the 98.71 support level before considering long entries. Alternatively, a breakout above the 98.63 resistance level could provide a more aggressive entry point. In either case, it's important to manage risk carefully and to use stop-loss orders to protect against potential losses. The current market sentiment is bullish, but the overbought conditions suggest that a degree of caution is warranted. Until the NFP data resolves this, it is prudent to wait for a pullback before committing to long positions.
The trade recommendation decision is to remain in a WATCH_ZONE. A daily close above 99.05 would open the door for further gains, potentially targeting 99.63. Until that occurs, it's best to observe the price action and wait for a clearer signal. The DXY strength is correlated with the broader equity selloff, as investors seek safe-haven assets amid geopolitical tensions. This decoupling from its usual inverse relationship with equities suggests that the dollar is currently being driven by factors beyond just risk appetite. Historically, periods of sustained DXY strength have often been followed by periods of consolidation or correction. Therefore, it's important to be prepared for the possibility of a pullback, even if the overall trend remains bullish. The current price action suggests that the DXY is likely to continue to trade in a range between 97.63 and 99.63 in the near term.
Frequently Asked Questions: DXY Analysis
Is DXY a good buy right now?
Given the current price of $99.05, DXY is approaching overbought conditions on shorter timeframes, so a pullback is possible. Waiting for a dip towards the 98.71 support level might offer a better entry point for a long position, but a daily close above 99.05 would confirm a continuation of the bullish trend.
What is the DXY price forecast for this week?
The DXY price forecast for this week is mixed. A high-probability setup (65-70%) is a move towards 99.63 if the 99.05 resistance breaks. However, if support at 98.71 fails, the DXY could retrace towards 97.63.
What are the key support and resistance levels for DXY?
Key support levels for DXY are 98.71 and 97.63, while key resistance levels are 98.94, 99.04 and 99.63. These levels are derived from the 1H and 1D timeframes and can be used to identify potential entry and exit points.
Why is DXY moving today?
DXY is moving today due to geopolitical tensions in the Middle East, which are driving safe-haven demand for the dollar. Additionally, expectations of a more hawkish stance from the Federal Reserve are supporting the dollar's strength.
Volatility creates opportunity- those prepared will be rewarded. Even amid geopolitical tensions and market uncertainty, disciplined risk management remains the key to navigating these choppy waters. Patient investors always find opportunities- the key is waiting for the right moment and confirming the technical setup.
Track markets in real-time
AI-powered analysis, technical indicators and real-time price data.
Join Our Telegram Channel
Breaking market news, AI analysis and trading signals instantly.
Join Channel