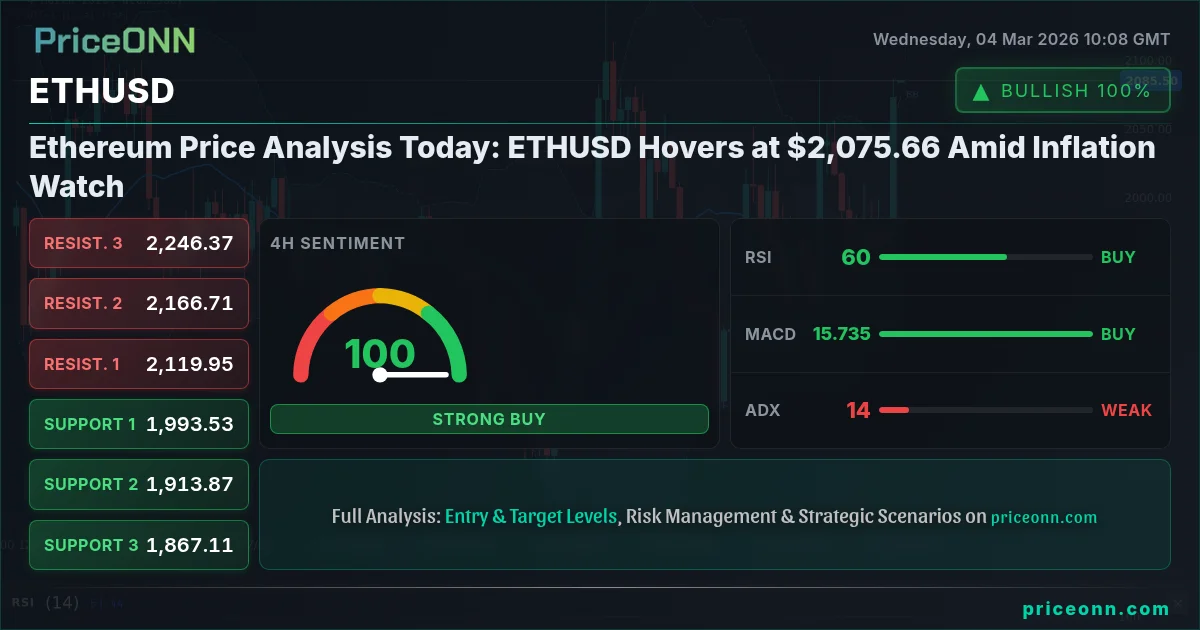
Ethereum (ETHUSD) is trading around $2,075.66 today, reflecting a 5.59% daily increase and a wide trading range between $1,942.37 and $2,087.06. As the cryptocurrency market navigates a landscape influenced by both technical factors and broader economic concerns, the key question is whether this rally can sustain itself or if it's a temporary bounce within a larger consolidation phase.
- RSI(14) at 73.51 on the 1H chart indicates overbought conditions, potentially signaling a near-term pullback.
- Key resistance lies at $2,085, with a break above potentially targeting $2,108.36.
- Stochastic K=94.66, D=59.98 on the 1H chart shows bullish momentum; however, overbought conditions suggest caution.
- Geopolitical tensions and rising energy prices in the Eurozone may indirectly influence crypto market sentiment.
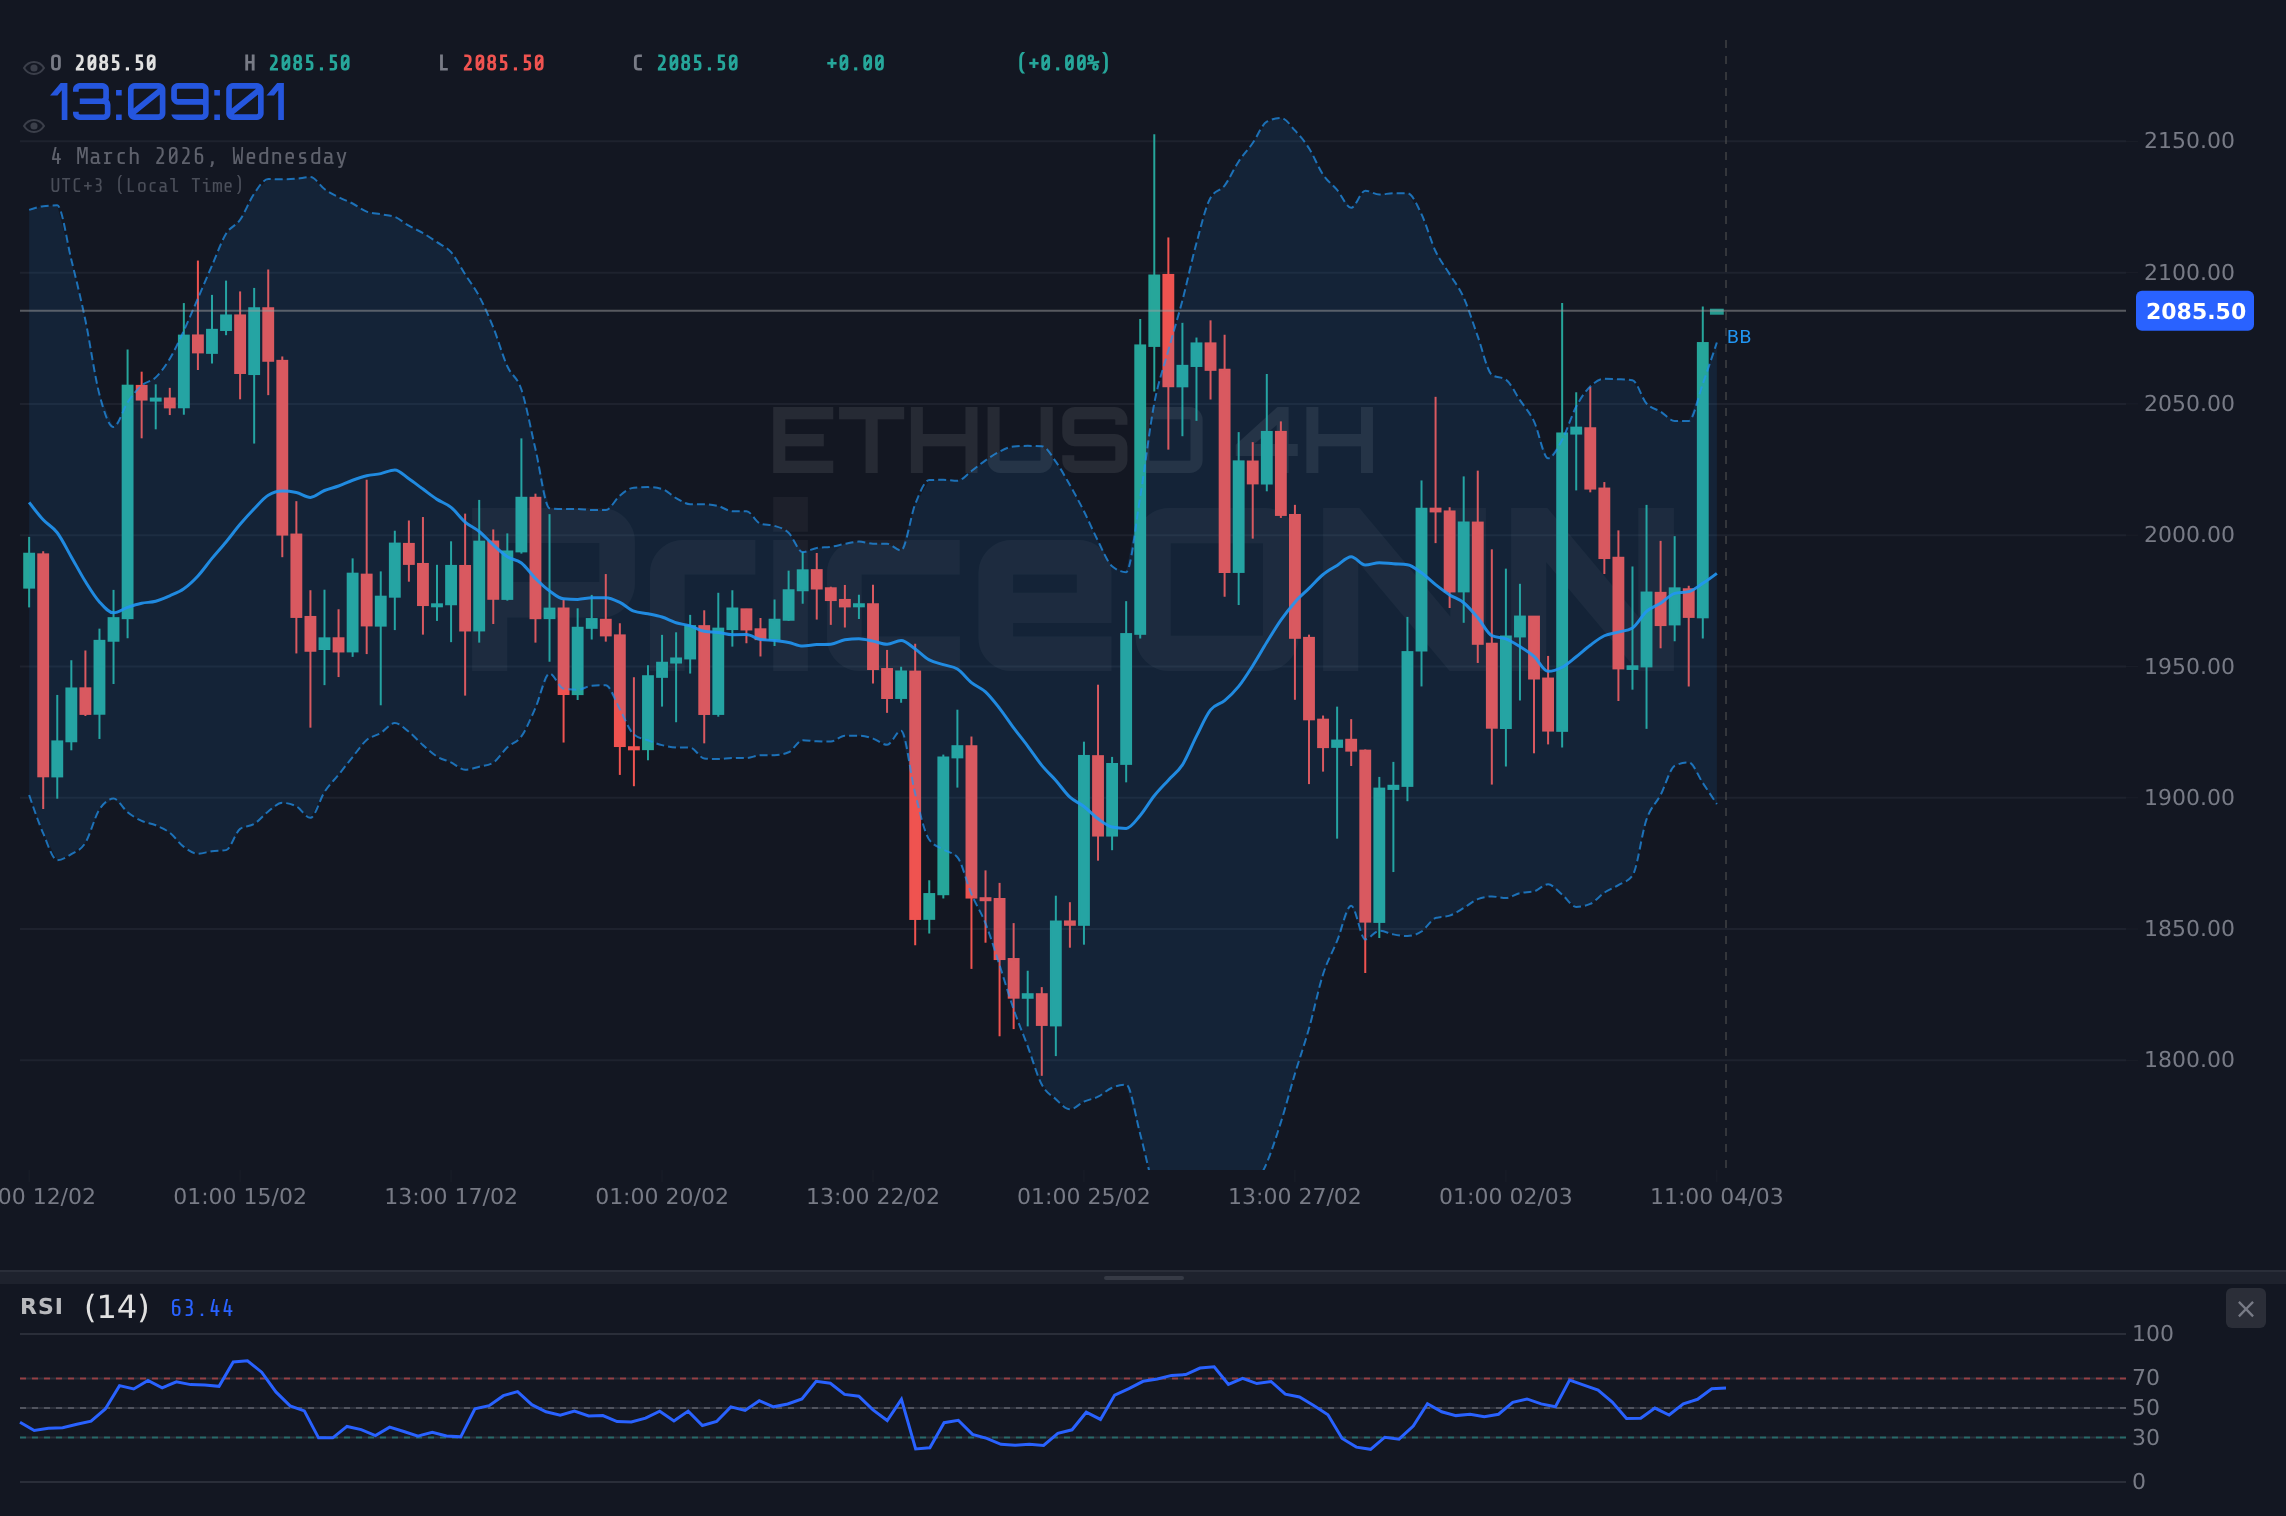
Ethereum's current price action presents a mixed picture when viewed across different timeframes. On the 1-hour chart, the trend appears neutral, but the Relative Strength Index (RSI) is hovering at 73.51, indicating overbought conditions. This suggests that the recent upward momentum might be losing steam, and a short-term pullback could be in the cards. The Moving Average Convergence Divergence (MACD) shows positive momentum, with the MACD line above the signal line, but the overbought RSI warrants caution. The Stochastic oscillator, with %K at 94.66 and %D at 59.98, confirms the bullish sentiment but also highlights the potential for a reversal. It's worth noting that the Average Directional Index (ADX) is at 15.44, indicating a weak trend, which further complicates the near-term outlook. The price action is currently testing the upper Bollinger Band, which often acts as a resistance level. A decisive break above the $2,085 resistance could signal further upside, while failure to do so could lead to a retest of the $2,017.93 support.
Stepping back to the 4-hour timeframe, the trend shifts to bearish, with a strength rating of 99%. The RSI is at 61.79, still in neutral territory but trending downward, suggesting increasing selling pressure. The MACD also shows negative momentum, with the MACD line below the signal line. The Stochastic oscillator tells a different story, with %K at 53.82 and %D at 33.49, indicating a potential bullish crossover. The ADX is at 13.32, indicating a weak trend, which means the market lacks a clear directional bias. Key support on this timeframe is at $1,947.25, while resistance is at $1,985.62. A break below support could open the door to further downside, while a move above resistance could signal a shift in momentum.
The daily chart paints a more neutral picture, with the trend strength at 50%. The RSI is at 49.51, in neutral territory, suggesting neither bullish nor bearish dominance. The MACD shows positive momentum, but the Stochastic oscillator has %K at 65.07 and %D at 52.6, indicating a potential bearish crossover. The ADX is at 38.17, suggesting a strong downtrend, which contradicts the neutral overall signal. Key support on this timeframe is at $1,909.18, while resistance is at $2,039.42. The mixed signals across different timeframes highlight the current uncertainty in the market. Investors are likely waiting for a catalyst to provide a clearer direction.
From a fundamental perspective, the broader macroeconomic environment and geopolitical risks are playing a significant role. According to recent news, geopolitical tensions and rising energy prices are fueling inflation concerns in the Eurozone, impacting the EURUSD pair. While ETHUSD is not directly correlated with the Euro, market sentiment and risk appetite are often influenced by global economic conditions. The upcoming economic data releases, including the U.S. data scheduled for today, will be closely watched for clues about the Federal Reserve's monetary policy. Strong economic data could lead to expectations of higher interest rates, which could put downward pressure on risk assets like cryptocurrencies. Conversely, weak economic data could support the case for continued monetary stimulus, which could boost crypto prices.
The DXY (Dollar Index) is currently at 98.66, showing a 0.02% daily increase and a strong uptrend on the 4-hour chart. A stronger dollar often puts downward pressure on cryptocurrencies, as it makes them more expensive for international investors. The SP500 is trading at 6815.55, up 0.16% for the day, indicating a slight improvement in risk appetite. However, the overall trend on the 4-hour and daily charts remains bearish, suggesting that the market is still cautious. Brent crude oil is at $65.73, up 1.96%, reflecting rising energy prices. Higher oil prices can contribute to inflation, which could lead to more hawkish monetary policy from central banks.
Having tracked ETHUSD through the 2024 rate cycle, it's clear that the cryptocurrency's performance is closely tied to broader market sentiment and macroeconomic factors. Historically, when the RSI reaches the current zone on ETHUSD, the outcome has been a period of consolidation followed by either a breakout or a breakdown. This pattern last appeared in June 2025, when the price consolidated for several weeks before eventually breaking to the downside. The current market conditions suggest that a similar period of consolidation may be in store. Scalpers should focus on short-term trading opportunities within the current range, while swing traders should wait for a decisive breakout or breakdown before taking a position. Long-term investors should remain patient and accumulate ETHUSD at lower levels, as the long-term outlook for Ethereum remains positive due to its continued adoption and technological advancements.
The NZD/USD pair is testing 0.5900 amid China data and geopolitical risks, which could indirectly impact the broader crypto market sentiment. According to Reuters, Fed officials emphasized that inflation remains 'stubborn'. This reinforces the expectation of continued hawkish monetary policy, which could weigh on risk assets like ETHUSD. Bloomberg data shows that the Chinese central bank is continuing to increase its gold reserves, reflecting a broader trend of diversification away from the U.S. dollar. This trend could also support the long-term outlook for cryptocurrencies as an alternative store of value.
The ADX at 15.44 on the 1-hour chart is the real story here. A weak-trend reading like this means the breakout hasn't committed yet-it could go either way. The stochastic oscillator, with %K at 94.66 and %D at 59.98, confirms the bullish sentiment but also highlights the potential for a reversal. It's worth noting that the Average Directional Index (ADX) is at 15.44, indicating a weak trend, which further complicates the near-term outlook. The price action is currently testing the upper Bollinger Band, which often acts as a resistance level. A decisive break above the $2,085 resistance could signal further upside, while failure to do so could lead to a retest of the $2,017.93 support.
Frequently Asked Questions: ETHUSD Analysis
Is ETHUSD a good buy right now?
Given the neutral trend and conflicting signals across timeframes, ETHUSD may not be a strong buy right now. The overbought RSI on the 1H chart suggests a potential pullback, and a better entry point may present itself near the $2,017.93 support level.
What is the ETHUSD price forecast for this week?
The ETHUSD price forecast for this week is uncertain, with potential for both upside and downside movement. A break above the $2,085 resistance could target $2,108.36, while a break below the $2,017.93 support could lead to further losses.
What are the key support and resistance levels for ETHUSD?
Key support levels for ETHUSD are $2,017.93, $1,947.25, and $1,909.18. Key resistance levels are $2,085, $2,108.36, and $2,039.42. These levels should be closely monitored for potential trading opportunities.
Why is ETHUSD moving today?
ETHUSD is moving today due to a combination of technical factors and broader market sentiment. The 5.59% daily increase reflects a potential rebound from recent losses, but the neutral trend and conflicting signals suggest that the move may not be sustainable without a clear catalyst.
Technical Outlook Summary
| Indicator | Value | Signal |
|---|---|---|
| RSI (14) | 73.51 | Overbought |
| MACD Histogram | Positive | Bullish |
| Stochastic | 94.66/59.98 | Overbought |
| ADX | 15.44 | Weak Trend |
| Bollinger | Upper Band | Watch |
Key Levels
Support Levels
Resistance Levels
Track markets in real-time
AI-powered analysis, technical indicators and real-time price data.
Join Our Telegram Channel
Breaking market news, AI analysis and trading signals instantly.
Join Channel