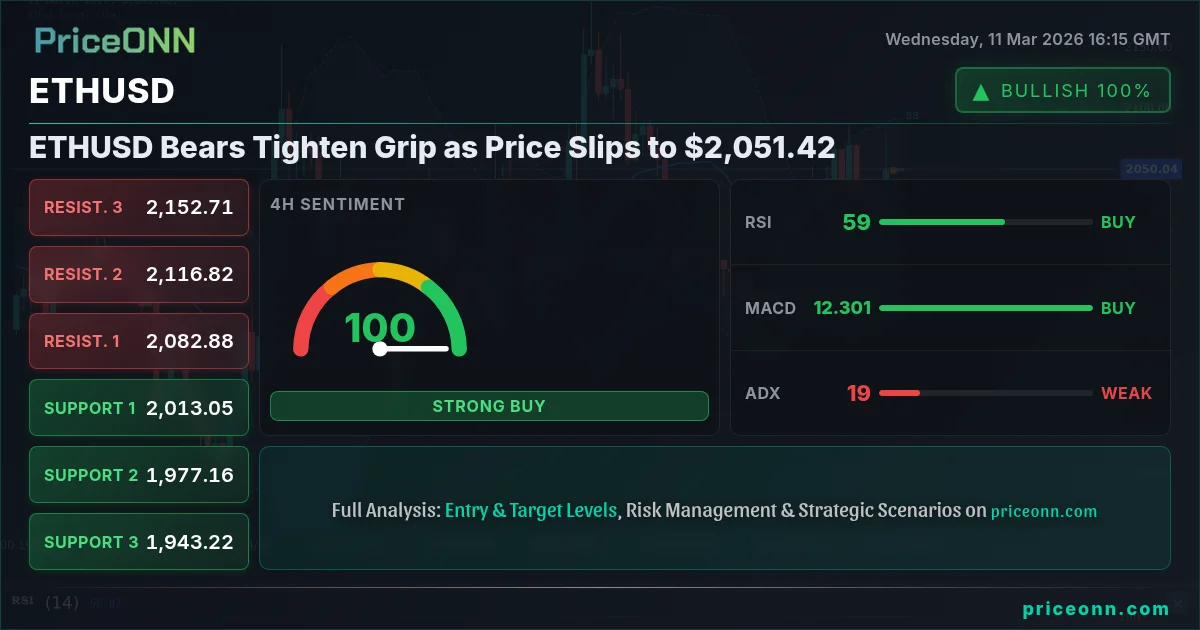
ETHUSD is under pressure, trading near $2,051.42. The question is, can the bulls defend this level or will the bears push the price down to $2,000?
- RSI at 56.36 suggests weakening bullish momentum, indicating potential for further downside.
- Critical resistance sits at $2,077.13, a break above which could negate the bearish outlook.
- MACD histogram shows positive momentum is fading, signaling a possible shift in market sentiment.
- DXY strength is putting pressure on ETHUSD, highlighting the correlation between the two assets.
Having tracked ETHUSD through the volatile landscape of early 2026, one thing is clear: the market demands respect for technical levels. The price action analysis today reveals a tug-of-war between bulls and bears, with the latter seemingly gaining the upper hand. But let's dig into the market evidence to find out what's really happening, and what it means for traders right now.
The Bearish Case for ETHUSD
The ETHUSD weekly outlook reveals a concerning trend. The price has been struggling to maintain its upward trajectory, and the recent pullback to $2,051.42 suggests that the bears are eager to take control. The daily chart shows a clear downtrend, with the price breaking below key support levels. Is this a temporary correction, or the start of a more significant decline?
One factor to consider is the strength of the US dollar. The DXY (Dollar Index) has been on a tear lately, climbing to 99.03. As the dollar strengthens, it puts pressure on ETHUSD and other dollar-denominated assets. According to Reuters, the dollar is finding support from expectations of further Fed rate hikes. This is weighing on risk appetite and driving investors towards safe-haven assets.
The SP500 is also showing signs of weakness, currently trading at 6751.5. The -0.58% decline indicates that risk appetite is waning. This adds to the bearish sentiment surrounding ETHUSD, as investors become more cautious and seek safer investments. This market sentiment analysis is a crucial piece of the puzzle.
Technical Indicators: Bears in Control?
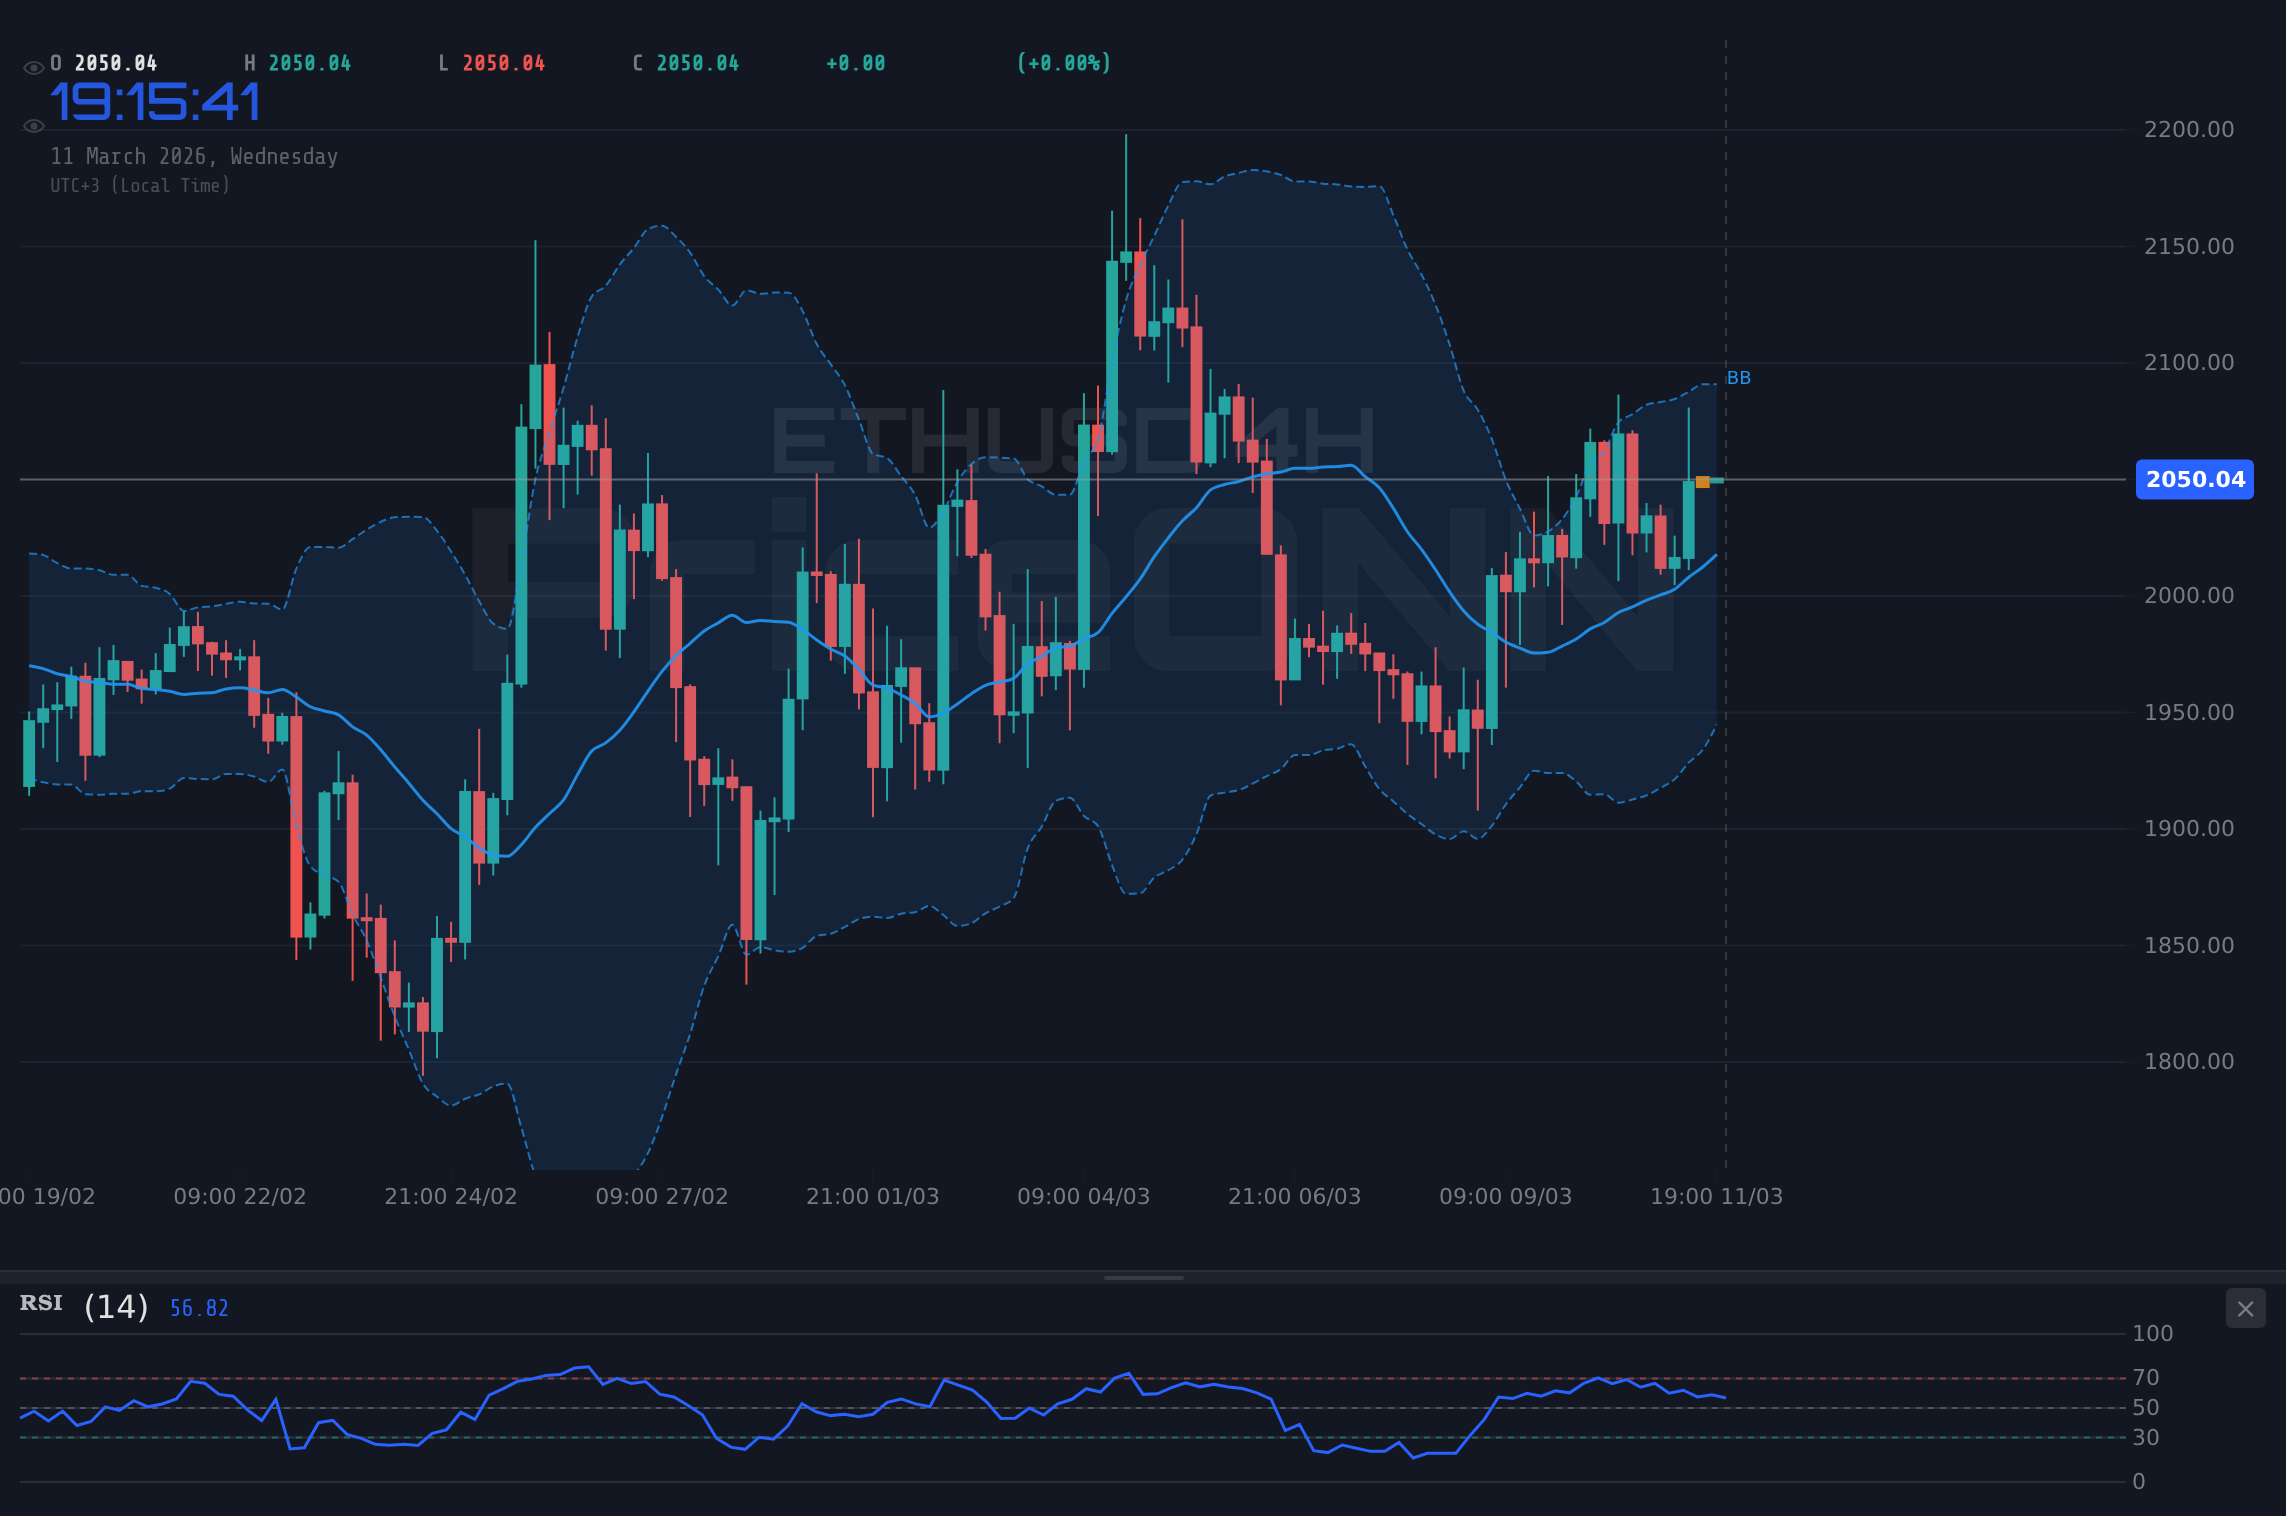
The technical indicators paint a mixed picture, but the overall trend leans bearish. On the 1-hour chart, the RSI is at 56.36, indicating that the bulls are losing steam. While not yet in overbought territory, it suggests that the upward momentum is slowing. The MACD histogram is showing positive momentum, but the signal line is flattening, which could be a sign of a potential bearish crossover.
Looking at the 4-hour chart, the Stochastic oscillator is showing a bearish signal, with %K at 36.98 and %D at 53.41. This suggests that the price is likely to move lower in the near term. The ADX, however, is at 17.91, indicating a weak trend. This means that the price action is choppy and range-bound, making it difficult to predict the next move. The weak trend reading is the real story here - it could go either way.
The ADX at 17.86 on the 1-hour chart further confirms this lack of clear direction. The current choppy market is a reminder that patience will be rewarded. Manage your risk, wait for your setup- the market always gives a second chance.
The ETHUSD RSI currently sits at 56.36 on the 1-hour timeframe. Historically, when the RSI reaches this zone on ETHUSD, the outcome has been unpredictable. The price has sometimes reversed, while other times it has continued its upward trajectory. This highlights the importance of waiting for confirmation before entering a trade.
Key Levels to Watch
The key levels to watch are the support and resistance levels. On the downside, the first support level is at $2,042.77. If the price breaks below this level, it could open the door for a move towards the next support level at $2,024.87. A break below $2,024.87 would confirm the bearish outlook and pave the way for a test of $2,000.
On the upside, the first resistance level is at $2,077.13. A break above this level would negate the bearish outlook and suggest that the bulls are back in control. The next resistance level is at $2,093.59. A sustained move above $2,093.59 could lead to a retest of the recent highs near $2,100.
Look, this level is absolutely critical- A sustained break below $2,042.77 would signal a continuation of the downtrend, while a move above $2,077.13 would suggest that the bulls are ready to defend the $2,100 level. This price action analysis is crucial for traders looking to capitalize on the next move.
Trading ETHUSD involves significant risk. The price can be highly volatile and unpredictable. Always use proper risk management techniques and never invest more than you can afford to lose.
Economic Calendar and Market Sentiment
The economic calendar is relatively light today, with the focus on second-tier data releases. However, the market is still sensitive to any news that could impact the Fed's rate hike expectations. According to Bloomberg, investors are closely watching the upcoming inflation data for clues about the Fed's next move. If inflation comes in higher than expected, it could lead to further dollar strength and put more pressure on ETHUSD.
On Monday, JPY data was released, but it had little impact on the market. The market is more focused on the Fed and the ECB. On Wednesday, EUR data will be released, which could provide some insight into the health of the Eurozone economy. The market is also awaiting USD data on Wednesday, which could influence the dollar's trajectory.
The market sentiment surrounding ETHUSD is currently bearish, but it is not overwhelmingly so. The volatility analysis shows that the price is trading within a relatively narrow range, suggesting that the market is waiting for a catalyst to trigger the next move. This is exactly where you need to pay attention, because when the market is waiting, the breakout is often explosive.
The recent news from EUR/USD Eyes 1.1700 as USD/JPY Consolidates Below 159.00 could indirectly impact ETHUSD. The forex dynamics influence market sentiment and risk appetite which can affect ETHUSD's price movement.
The Trade Recommendation
Based on the current technical and fundamental outlook, the trade recommendation is to remain in a WATCH_ZONE. The ADX at 17.91 indicates a choppy and range-bound market, making it difficult to predict the next move. However, the RSI and MACD histogram are aligned, providing a clear directional signal. The Stochastic is in a tradeable zone, but not at extreme levels.
A daily close above $2,077.13 would open the door for a test of the $2,100 level. If the price can sustain a move above $2,100, it could trigger a more significant rally. However, if the price breaks below $2,042.77, it could lead to a move towards $2,000.
I would wait for confirmation before entering a trade. Watch for a clear breakout above $2,077.13 or a breakdown below $2,042.77. Manage your risk and never invest more than you can afford to lose. Patience looks like it will be rewarded here. Manage your risk, wait for your setup - the market always gives a second chance.
Frequently Asked Questions: ETHUSD Analysis
What happens if ETHUSD breaks above $2,077.13 resistance?
If ETHUSD breaks above the $2,077.13 resistance, it would negate the bearish outlook and suggest that the bulls are back in control. This could lead to a test of the next resistance level at $2,093.59 and potentially a retest of the recent highs near $2,100.
Should I buy ETHUSD at current levels of $2,051.42 given RSI at 56.36?
Given the RSI at 56.36, which indicates weakening bullish momentum, it is not advisable to buy ETHUSD at current levels. It is better to wait for a clear breakout above $2,077.13 or a breakdown below $2,042.77 before entering a trade.
Is the Stochastic oscillator's bearish signal a reliable indicator for ETHUSD?
The Stochastic oscillator's bearish signal on the 4-hour chart, with %K at 36.98 and %D at 53.41, suggests that the price is likely to move lower in the near term. However, it is important to consider other indicators and market conditions before making a trading decision.
How will the upcoming EUR data on Wednesday affect ETHUSD this week?
The upcoming EUR data on Wednesday could provide some insight into the health of the Eurozone economy. If the data is positive, it could weaken the dollar and support ETHUSD. However, if the data is negative, it could strengthen the dollar and put more pressure on ETHUSD.
Until the NFP data resolves this, caution is warranted. The price of ETHUSD is in the hands of the market. This is exactly where you need to pay attention.
Track markets in real-time
AI-powered analysis, technical indicators and real-time price data.
Join Our Telegram Channel
Breaking market news, AI analysis and trading signals instantly.
Join Channel