

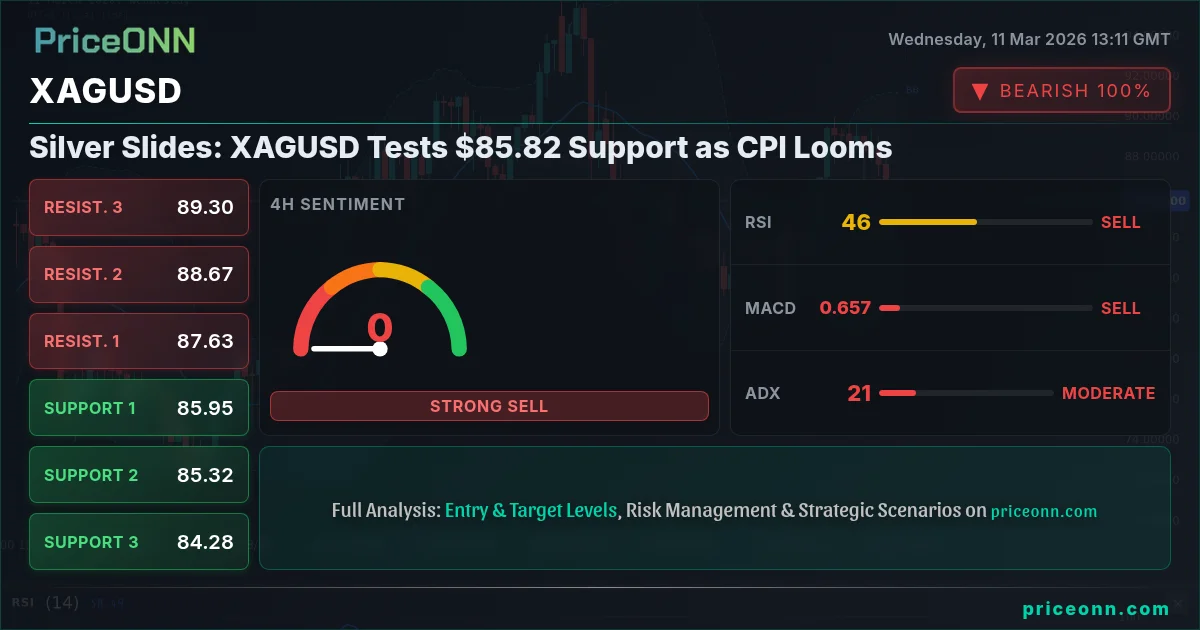
Silver is under pressure, currently testing the $85.82 level, as market participants brace for the upcoming CPI data release. The direction of the US Dollar Index (DXY) and broader risk sentiment are key factors influencing XAGUSD's price action.
- XAGUSD tests $85.82 support amid USD strength and falling risk appetite.
- Hourly RSI at 32.9 suggests potential oversold bounce but downtrend dominates.
- A break below $85.80 could trigger further losses towards $84.77 support.
- Upcoming CPI data and DXY direction will be crucial catalysts for XAGUSD.
Silver's Downtrend: What's Driving the Sell-Off?
XAGUSD is currently trading at $85.82, down 2.81% on the day. The stronger US Dollar Index (DXY), currently at 98.91, is weighing on silver prices. The DXY's 0.38% daily gain reflects increased demand for the dollar as a safe-haven asset, further pressuring XAGUSD. The SP500 is down 0.25% at 6773.6, signaling declining risk appetite among investors. As the SP500 falls, safe-haven assets such as the US dollar tend to strengthen, negatively impacting precious metals like silver.
The recent decline in XAGUSD can also be attributed to profit-taking after a volatile run. As the keyword analysis highlights, "silver price volatile run" has been a significant search term, reflecting the market's recent price swings. Traders who profited from the earlier surge are now locking in gains, contributing to the current selling pressure. The drop in oil prices, with Brent crude at $65.73, adds to the downward pressure on silver. Declining oil prices can ease inflation concerns, reducing the appeal of precious metals as inflation hedges.
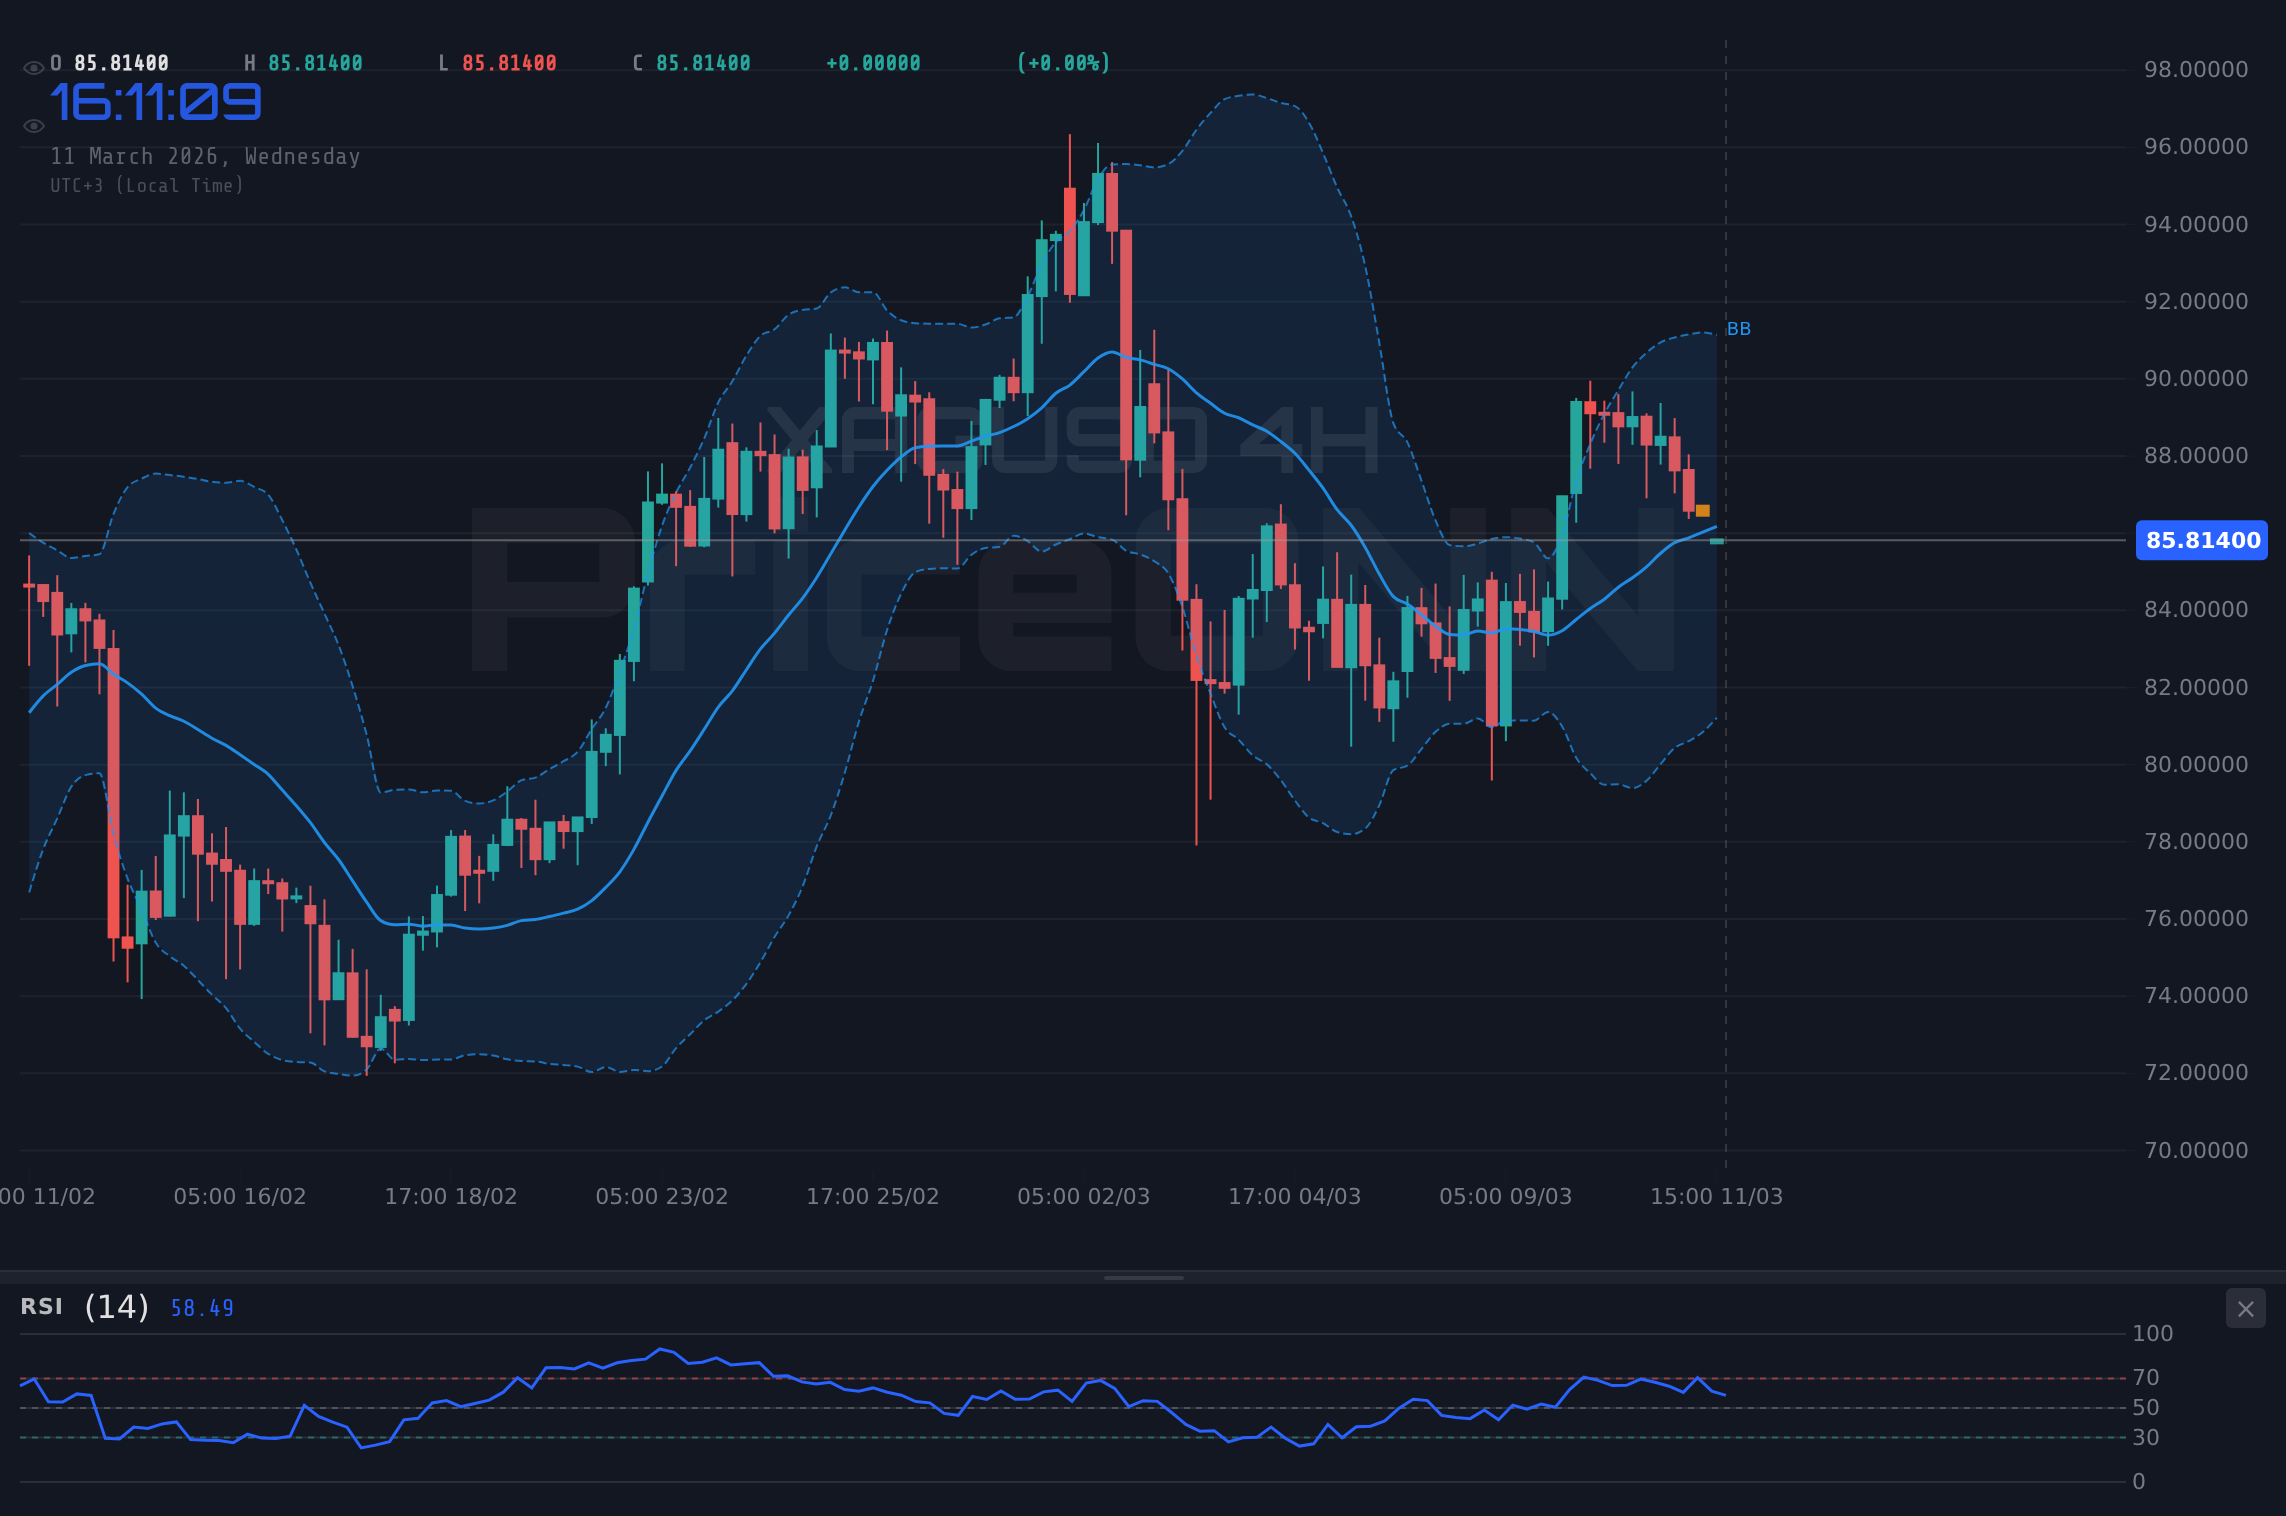
Technical Breakdown: Key Levels to Watch
From a technical perspective, XAGUSD's hourly chart indicates a neutral trend with 50% strength. The hourly RSI is at 32.9, suggesting the asset is approaching oversold territory, which could lead to a short-term bounce. However, the overall trend remains bearish, as indicated by the MACD, which is showing negative momentum below its signal line. The hourly Stochastic is in the oversold region at K=11.47, D=14.63, signaling potential for a reversal. However, the ADX at 21.55 suggests a moderate downtrend, indicating that the bearish momentum still has some room to run.
Key support levels to watch on the hourly timeframe are $85.80, $85.36, and $84.77. A break below the current support at $85.80 could trigger further losses towards $85.36 and $84.77. On the upside, immediate resistance lies at $86.83, followed by $87.42 and $87.86. The 4-hour chart also shows a neutral trend with 50% strength, but the RSI is at 48.3, indicating more room for downside before reaching oversold conditions.
Intermarket Dynamics: Gold and the Dollar's Influence
The performance of gold (XAUUSD) and the dollar index (DXY) are crucial for understanding XAGUSD's price action. Gold is currently trading at $5179.99, down 0.24% on the day. The DXY's strength is putting downward pressure on gold, which in turn is affecting silver. Silver tends to be more volatile than gold, amplifying the impact of DXY and risk sentiment. Investors often view gold as a safe haven during times of economic uncertainty or geopolitical instability. When risk aversion increases, demand for gold rises, pushing its price higher. However, the relationship between gold and silver can vary depending on market conditions and investor sentiment.
Another factor to consider is the gold/silver ratio, which measures the number of ounces of silver required to purchase one ounce of gold. A rising ratio suggests that gold is outperforming silver, while a falling ratio indicates that silver is outperforming gold. Monitoring this ratio can provide insights into the relative strength of each metal and potential trading opportunities. The "gold vs silver industrial demand percentage" is also a key search term, highlighting the market's interest in the industrial uses of both metals. Silver has more industrial applications than gold, making its price more sensitive to economic growth and industrial production.
XAGUSD is known for its volatility. Traders should exercise caution and use appropriate risk management techniques, such as stop-loss orders, to protect their capital. The leverage offered by forex brokers can amplify both profits and losses, making it crucial to understand the risks involved.
CPI Looms: A Potential Catalyst for XAGUSD
The upcoming CPI data release is a significant event that could trigger a sharp move in XAGUSD. As the news highlights, "Will US CPI Data Box In the Incoming Fed Chair?" The market expects February's CPI data to hold steady at 2.4%, but persistent inflation above the Fed's 2% target could lead to a more hawkish monetary policy stance. A higher-than-expected CPI reading could strengthen the dollar and further depress silver prices. Conversely, a lower-than-expected CPI reading could weaken the dollar and support silver prices.
The economic calendar also shows several other key events that could impact XAGUSD. The [EUR] event on Wednesday, March 11, and the [USD] events also on Wednesday, March 11, could provide further clues about the economic outlook and monetary policy expectations. The [GBP] event on Friday, March 13, and the [USD] events on Friday, March 13, will also be closely watched by market participants. These events could introduce volatility into the market and create trading opportunities for those who are prepared.
Trading Strategy: Patience is Key
Given the current market conditions and the upcoming CPI data release, patience is key for XAGUSD traders. The ADX at 20.38 indicates a moderate downtrend, while the Stochastic is in the oversold zone. This suggests that the market could be poised for a short-term bounce, but the overall trend remains bearish. A daily close above the $86.83 resistance level would open the door for a potential rally towards $87.42 and $87.86. Conversely, a break below the $85.80 support level could lead to further losses towards $85.36 and $84.77.
Traders should wait for a clear signal before entering a position. The "partial indicator alignment" and the Stochastic in the "extreme zone" suggest that entry timing is uncertain. It's crucial to monitor price action closely and use appropriate risk management techniques. Manage your risk, wait for your setup - the market always gives a second chance. The intraday volatility creates opportunity - those prepared will be rewarded.
Frequently Asked Questions: XAGUSD Analysis
What happens if XAGUSD breaks below $85.80 support?
If XAGUSD breaks below the $85.80 support level, as indicated by the hourly chart, it could trigger further losses towards the next support levels at $85.36 and $84.77. This scenario would likely be driven by continued strength in the US Dollar Index (DXY) and risk-off sentiment in the broader market.
Should I buy XAGUSD at current levels of $85.82 given the oversold Stochastic?
While the oversold Stochastic (K=11.47, D=14.63) suggests a potential bounce, it's prudent to wait for confirmation before buying. The overall trend remains bearish, and a break below $85.80 could negate any short-term gains. Consider waiting for a bullish reversal pattern or a break above $86.83 resistance.
Is RSI at 32.9 a sell signal for XAGUSD right now?
An RSI of 32.9 indicates that XAGUSD is approaching oversold territory on the hourly chart. While this doesn't automatically trigger a sell signal, it suggests that the downtrend may be losing momentum. Look for signs of bullish divergence or a break above the $86.83 resistance level before considering a long position.
How will the upcoming CPI data affect XAGUSD this week?
The upcoming CPI data release is a key catalyst for XAGUSD. A higher-than-expected CPI reading could strengthen the dollar and further depress silver prices. Conversely, a lower-than-expected CPI reading could weaken the dollar and support silver prices. Monitor the data closely and be prepared for increased volatility.
Track markets in real-time
AI-powered analysis, technical indicators and real-time price data.
Join Our Telegram Channel
Breaking market news, AI analysis and trading signals instantly.
Join Channel