As GBPUSD navigates choppy waters around $1.35, the currency pair finds itself at a pivotal juncture. The strength of the US Dollar, fueled by Middle East tensions and anticipation of US CPI data, is weighing on the pound. However, all eyes are now on the forthcoming retail data, which could potentially shift the tide in favor of the bulls.
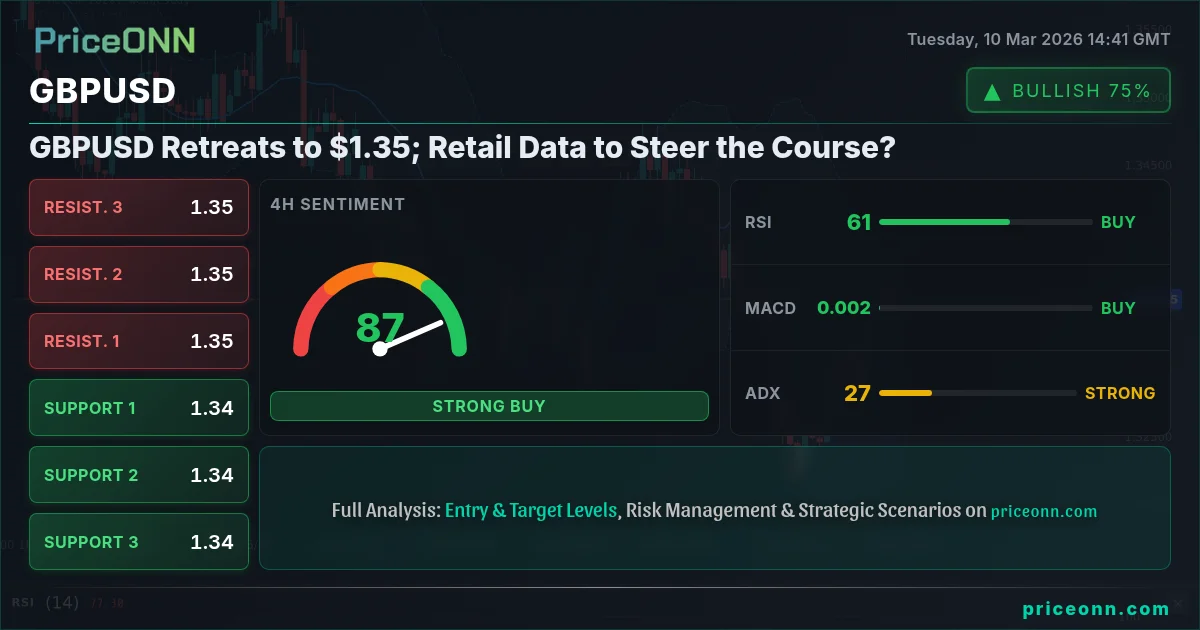
- GBPUSD currently trades at $1.35, struggling against a strengthening US Dollar.
- Immediate resistance lies at 1.34912, a level bulls need to breach for upward momentum.
- Stochastic on the daily timeframe signals a potential bullish reversal, with %K at 54.88 crossing above %D at 38.69.
- Upcoming UK GDP data and US CPI this week will be crucial catalysts for GBPUSD direction.
The British Pound has been under pressure amid a confluence of factors. The US Dollar Index (DXY), currently trading around 98.39, has gathered strength due to geopolitical uncertainties and the looming US CPI data. This has created a headwind for GBPUSD, as the pair typically exhibits an inverse correlation with the DXY. According to recent reports, Middle East tensions are contributing to the dollar's safe-haven appeal, further exacerbating the pressure on the pound. Adding to the mix, the market is scaling back expectations for aggressive rate cuts from the Bank of England (BoE), which has limited the pound's upside potential.
From a technical standpoint, GBPUSD is exhibiting a mixed picture across different timeframes. On the 1-hour chart, the pair shows an upward trend with a strength of 100%, supported by an ADX reading of 41.05, indicating a strong uptrend. The RSI(14) sits at 60.34, suggesting neutral conditions with a bullish inclination. However, the Stochastic indicator presents a bearish signal, with %K at 41.48 falling below %D at 59.61, hinting at a potential pullback. This divergence in signals underscores the current market indecision.
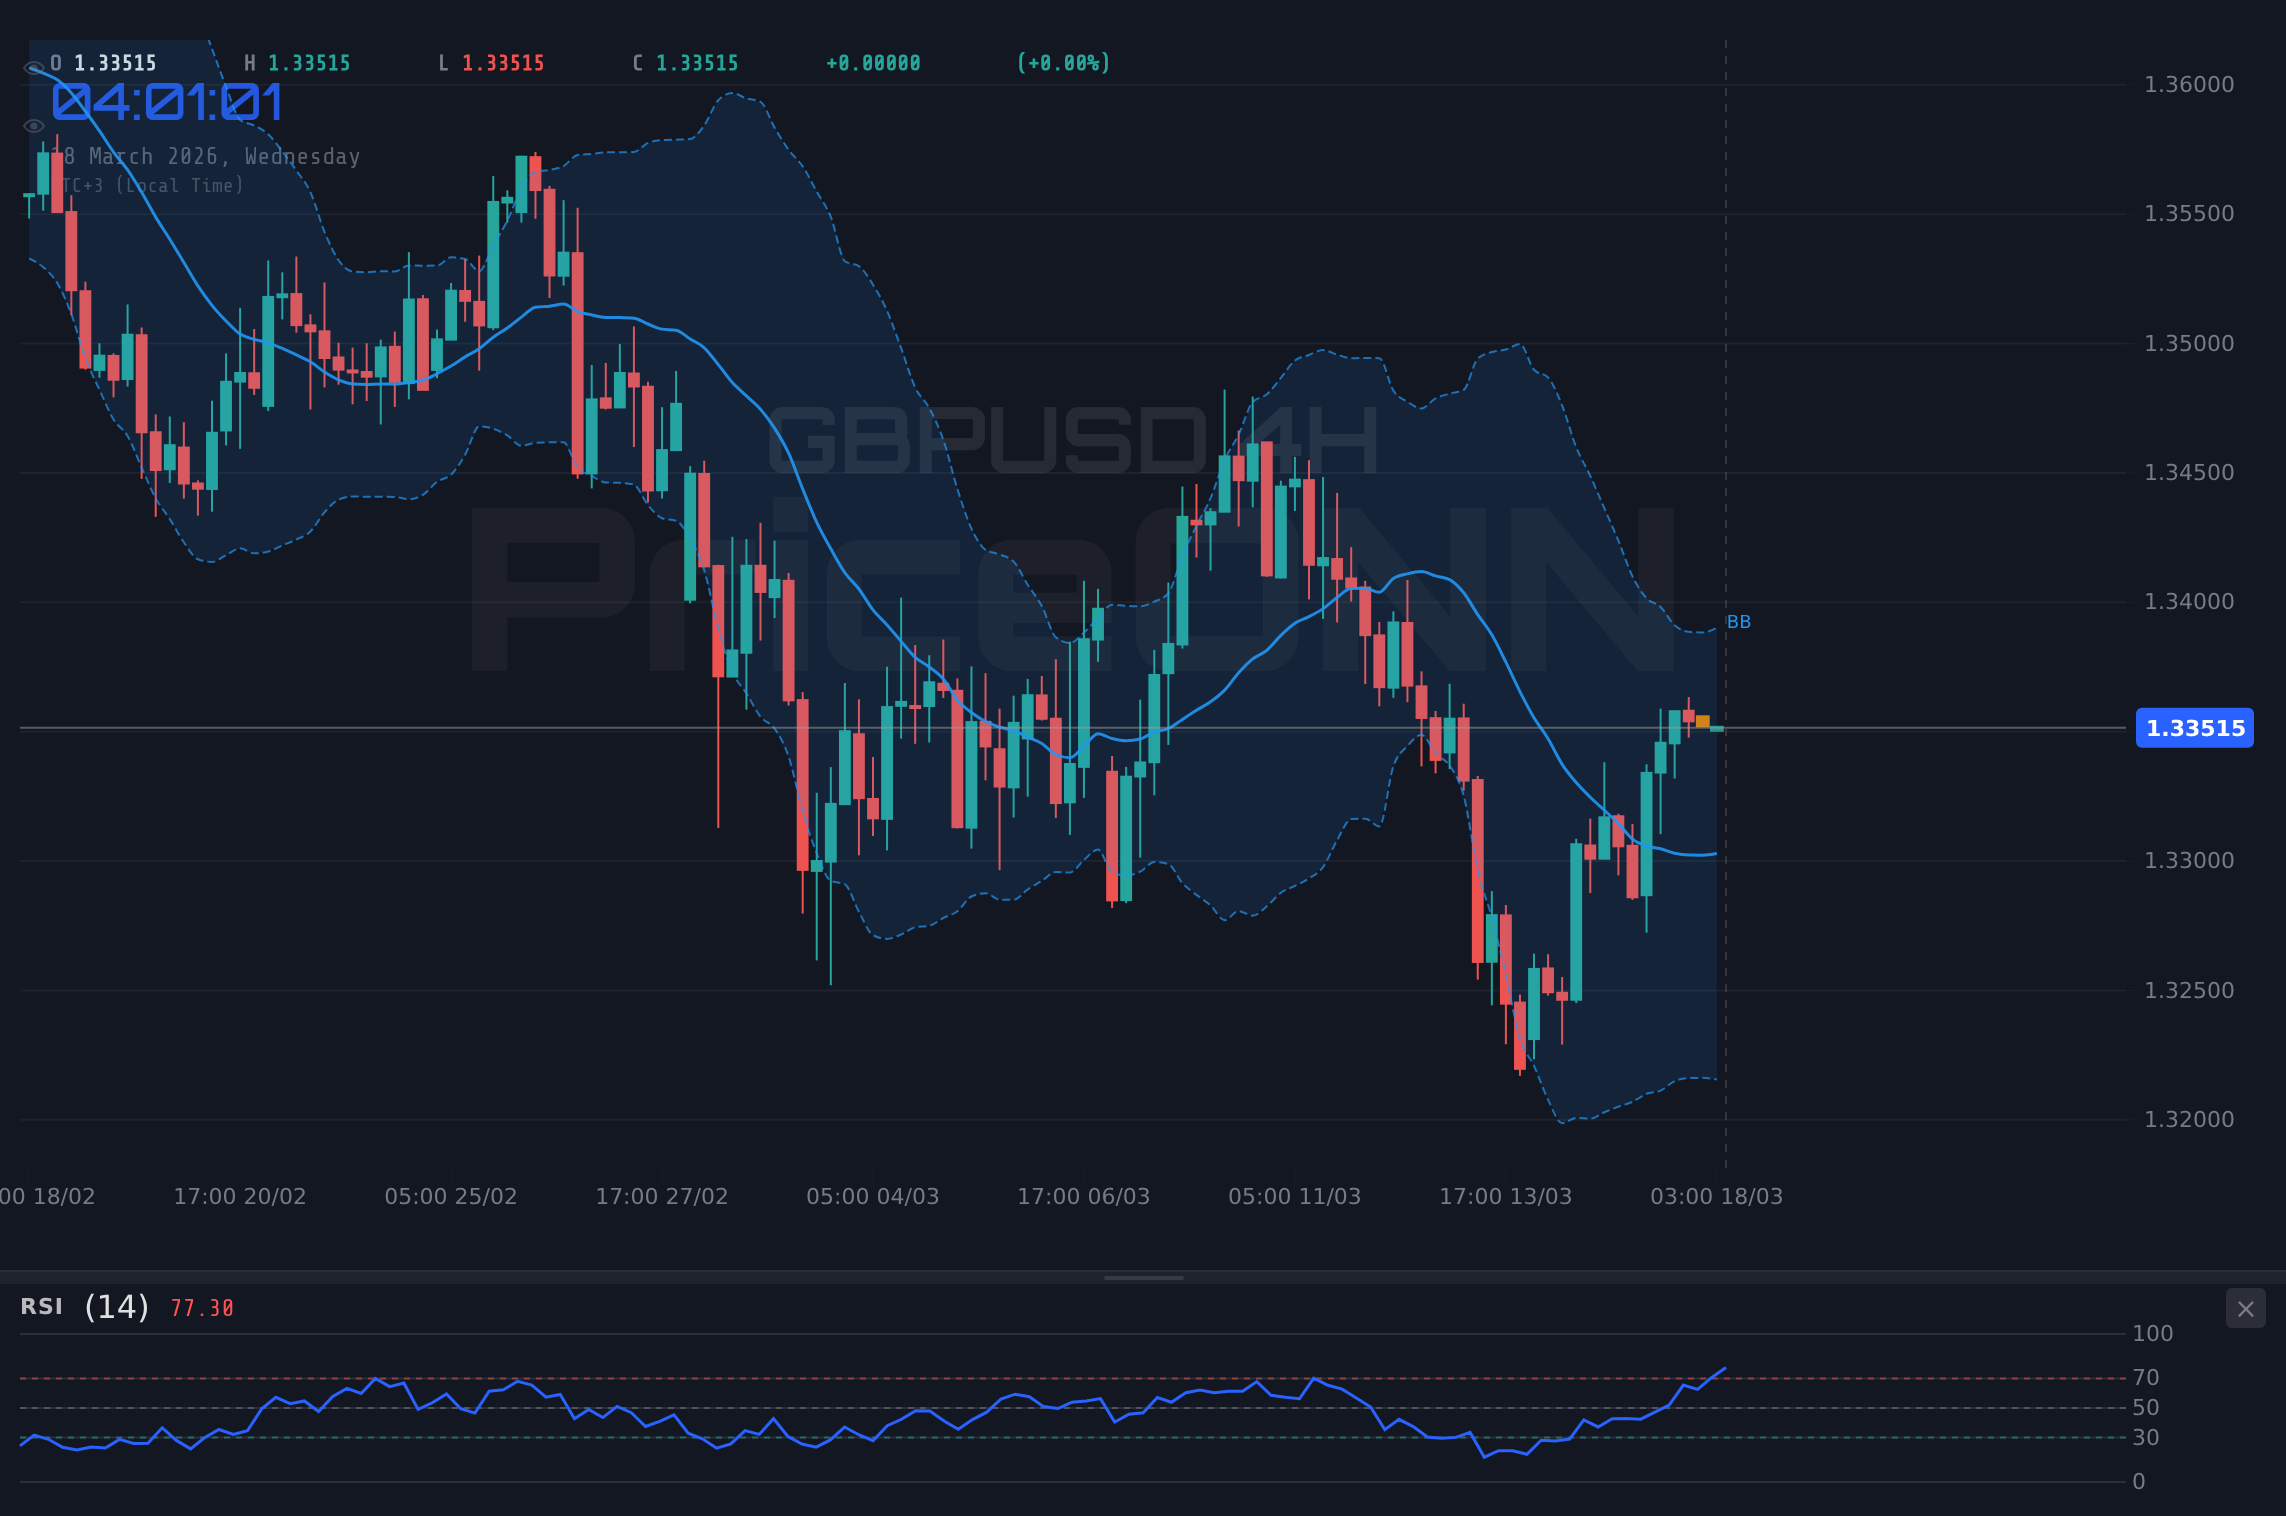
Zooming out to the 4-hour timeframe, the trend remains neutral, but the RSI(14) at 59.61 mirrors the hourly chart’s bullish inclination. A significant factor to watch is the Stochastic, which is in overbought territory with %K at 87.61 and %D at 84.19. This suggests that the recent upward momentum may be overextended, and a correction could be on the horizon. The ADX at 27.78 still indicates a strong uptrend on this timeframe, but the overbought Stochastic warrants caution.
The daily chart paints a different picture, revealing a downtrend with a strength of 94%. The RSI(14) at 47.17 further confirms the bearish sentiment. However, the Stochastic provides a glimmer of hope for the bulls, with %K at 54.88 crossing above %D at 38.69, suggesting a potential bullish reversal. The ADX at 27.88 underscores the strength of the prevailing downtrend, making any bullish reversal attempts a challenging endeavor. Therefore, GBPUSD trend analysis suggests caution.
The key to deciphering GBPUSD's next move lies in understanding the interplay between these conflicting technical signals and the upcoming economic data releases. The economic calendar is packed with high-impact events this week. On Wednesday, all eyes will be on the UK GDP data release, which will provide insights into the health of the British economy. Any positive surprises could bolster the pound and potentially offset the negative impact of the strong dollar. According to recent reports, the UK economy has shown resilience in the face of global headwinds, but the GDP data will be a crucial test.
Also on Wednesday, the U.S. will release key economic data. These figures will be critical in shaping market expectations for future Fed policy. Strong CPI figures could further strengthen the dollar, while weak data could trigger a dollar sell-off and provide relief for GBPUSD. Traders should closely monitor these releases and adjust their positions accordingly.
For scalpers, the intraday volatility presents opportunities for quick profits. However, given the conflicting technical signals, caution is advised. Scalpers should focus on identifying clear breakout patterns and managing their risk effectively. Swing traders should pay close attention to the 4-hour chart and the overbought Stochastic. A confirmed bearish divergence on this timeframe could signal a potential shorting opportunity.
Long-term investors need to consider the broader macroeconomic picture and the long-term trend on the daily chart. While the Stochastic suggests a potential bullish reversal, the strong downtrend indicated by the ADX warrants caution. Long-term investors should wait for a confirmed breakout above the 1.34912 resistance level before initiating any long positions. GBPUSD macroeconomic factors in March 2026, therefore, remain crucial.
Analyzing the broader market correlations, the strong US Dollar is putting pressure on multiple currency pairs, not just GBPUSD. The SP500, currently at 6803.3, is showing signs of resilience, but a significant pullback in risk appetite could further fuel the dollar's safe-haven appeal. Oil prices, with Brent crude currently at $65.73, are also impacting market sentiment. Rising oil prices typically contribute to inflationary pressures, which could prompt central banks to adopt more hawkish monetary policies. GBP/JPY advances as markets scale back BoE rate-cut expectations. This further adds to the complexity of the current market environment.
Given the current technical and fundamental backdrop, a cautious approach is warranted. The key levels to watch are the 1.34308 and 1.34212 support levels and the 1.34912 resistance level. A decisive break above the resistance could pave the way for further upside, while a break below the support could trigger a deeper correction. The DXY's movement will also be a crucial factor to monitor, as any further strengthening of the dollar is likely to weigh on GBPUSD. The fact that all eyes remain on the conflict in the Middle East adds another layer of uncertainty to the markets.
If GBPUSD breaks above the 1.34912 resistance level, it could trigger a rally towards the 1.35 resistance level. The stochastic indicator on the daily timeframe turning bullish could support this move. Continuation would require breaking 1.35493.
A failure to break above 1.34912, coupled with a strengthening US Dollar, could lead to a decline towards the 1.34308 and 1.34212 support levels. A break below these supports could open the door for a test of 1.33284.
Frequently Asked Questions: GBPUSD Analysis
What happens if GBPUSD breaks above 1.34912 resistance?
A break above the 1.34912 resistance could signal a shift in momentum and trigger a rally towards higher resistance levels, potentially targeting 1.35493. The bullish stochastic signal on the daily timeframe would support this upward move.
Should I buy GBPUSD at current levels of $1.35 given the RSI at 47.17 on the daily?
With the RSI at 47.17 on the daily chart, GBPUSD is neither overbought nor oversold, suggesting neutral conditions. However, the overall downtrend indicated by the ADX warrants caution. A buy position is risky, and a confirmed breakout above 1.34912 should be viewed as the trigger for a long position.
Is the Stochastic signal a reliable buy signal on the daily timeframe?
The Stochastic signal on the daily timeframe is indeed bullish, with %K crossing above %D. However, traders should not rely solely on this indicator. Confirmation from other technical indicators and a fundamental catalyst, such as positive UK GDP data, are necessary for a high-probability setup.
How will the upcoming UK GDP data affect GBPUSD this week?
The upcoming UK GDP data is a crucial catalyst for GBPUSD. Positive surprises could boost the pound, potentially offsetting the negative impact of the strong dollar. Conversely, disappointing GDP data could exacerbate the downward pressure on the pair.
Technical Outlook Summary
| Indicator | Value | Signal |
|---|---|---|
| RSI (14) | 47.17 | Neutral |
| MACD Histogram | Negative | Bearish |
| Stochastic | K=54.88, D=38.69 | Bullish |
| ADX | 27.88 | Strong Downtrend |
| Bollinger | Middle Band | Below |
Key Levels
Support Levels
Resistance Levels
Track markets in real-time
AI-powered analysis, technical indicators and real-time price data.
Join Our Telegram Channel
Breaking market news, AI analysis and trading signals instantly.
Join Channel