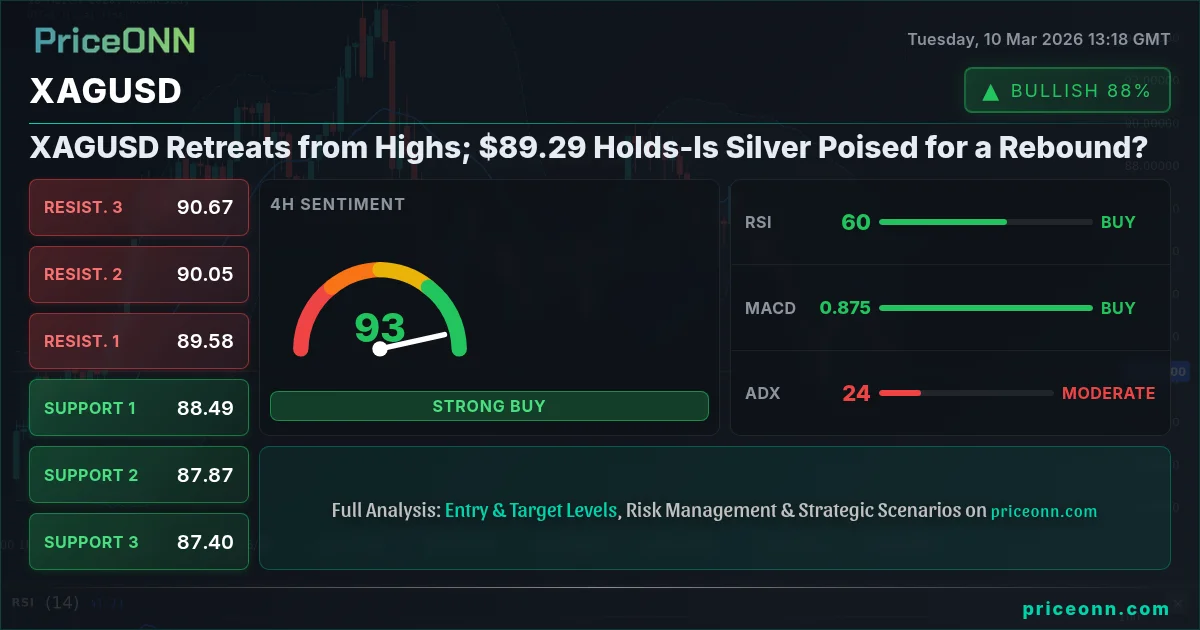
Silver (XAGUSD) is currently trading at $89.29, a critical juncture where bulls and bears are locked in a fierce battle. After a recent surge, the price is now testing key support levels. The question is: Can silver sustain its upward momentum, or will the bears regain control and push it lower? This article will delve into the technical and fundamental factors driving XAGUSD, offering insights for traders and investors.
- RSI at 65.43 on the 1-hour chart suggests potential for a short-term pullback.
- Key support level lies at $87.92, a break below which could trigger further selling.
- MACD on the 4-hour chart indicates positive momentum, supporting a potential bullish continuation.
- DXY strength is exerting downward pressure on XAGUSD, highlighting the inverse correlation.
Silver's Struggle: Bulls vs. Bears at $89.29
The current market environment presents a mixed picture for silver. The recent surge in prices, fueled by strong investment demand and industrial applications, has encountered resistance around the $90 level. Now, XAGUSD is hovering near $89.29, a level that will likely determine the short-term direction of the metal. The tug-of-war between bullish and bearish forces is evident in the conflicting technical signals and the influence of external factors like the strength of the US dollar.
The Bullish Case for XAGUSD
Several factors support a bullish outlook for silver. The 4-hour chart shows positive momentum, with the MACD indicator trending above its signal line. This suggests that buying pressure remains intact. Furthermore, the Stochastic oscillator on the daily chart shows a bullish crossover (%K > %D), indicating potential for further gains. The overall sentiment in the market suggests that investors are looking for alternative assets, and silver, with its dual role as a precious metal and industrial commodity, could benefit from this trend. The daily chart overall signal is AL (Al: 8, Sat: 0, Nötr: 0), suggesting continued bullish momentum on the daily chart.
From an industrial perspective, silver's demand is expected to remain robust, particularly in sectors like solar energy and electronics. As governments worldwide push for greener energy solutions, the demand for silver in solar panel manufacturing is likely to increase. This could provide a fundamental tailwind for silver prices, supporting the bullish case. Moreover, any weakness in the US dollar could further boost silver, as it makes the metal more affordable for investors holding other currencies. The current overall signal is AL (Al: 6, Sat: 2, Nötr: 0), suggesting continued bullish momentum.
The Bearish Counter-Argument
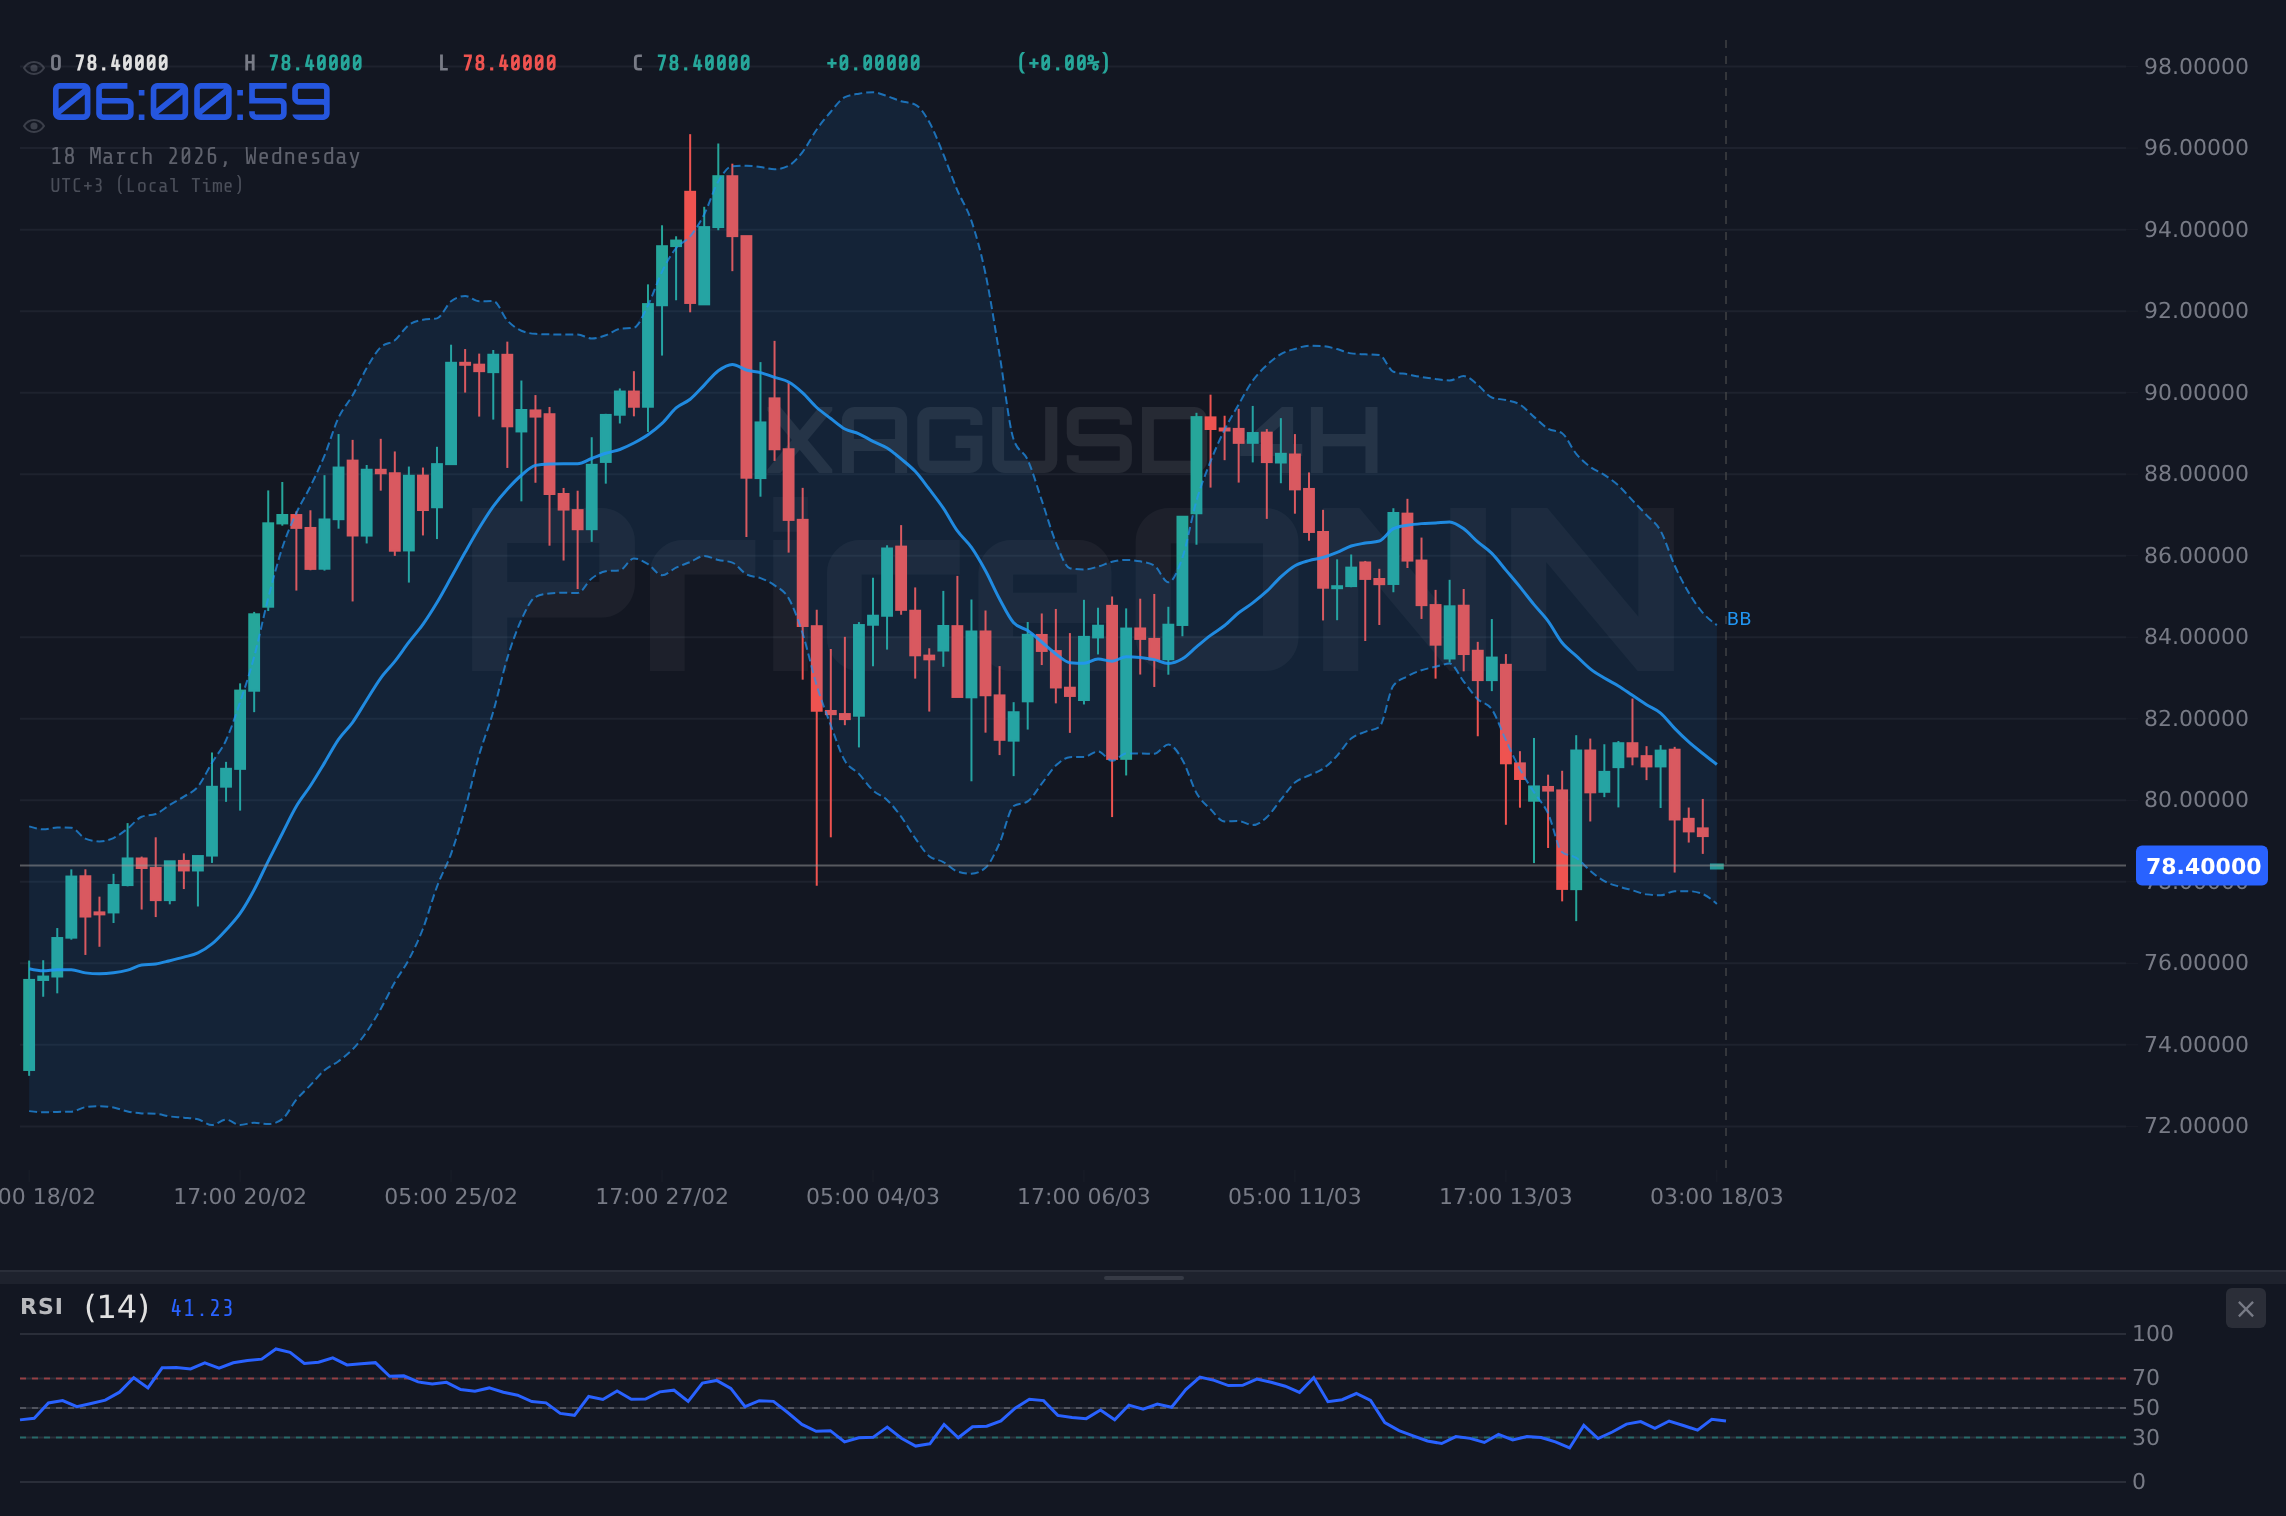
Despite the bullish arguments, several factors suggest caution. The 1-hour chart indicates that the Relative Strength Index (RSI) is at 65.43, suggesting that silver may be approaching overbought territory. This could lead to a short-term pullback as traders take profits. The Stochastic oscillator on the 1-hour chart indicates a potential downturn (%K
Furthermore, the ADX on the 1-hour timeframe is at 28.83, indicating a strong upward trend. However, the daily chart of the DXY (Dollar Index) shows a signal AL (Al: 7, Sat: 1, Nötr: 0), suggesting a strong dollar, which typically puts downward pressure on silver prices. Investors should carefully consider these conflicting signals and assess their risk tolerance before making any investment decisions. A break below the $87.92 support level could signal a further decline, potentially targeting the $87.5 and $87 levels.
Technicals as the Tiebreaker
Given the conflicting fundamental and geopolitical factors, technical analysis can provide valuable insights. A multi-timeframe analysis reveals a mixed picture. On the 1-hour chart, the overall signal is AL (Al: 6, Sat: 2, Nötr: 0), indicating a bullish bias, but the RSI is approaching overbought levels. The 4-hour chart also suggests a bullish bias, with the overall signal being AL (Al: 7, Sat: 1, Nötr: 0). However, the daily chart shows a Düşüş (Güç: 83%), suggesting a longer-term bearish trend. The key support levels to watch are $87.92, $87.5, and $87. A break below these levels could trigger further selling pressure. On the upside, the key resistance levels are $88.84, $89.34, and $89.76. A sustained break above these levels could signal a resumption of the upward trend.
A closer look at the moving averages reveals that the price is currently trading above the 50-day and 200-day moving averages, which is generally considered a bullish sign. However, the moving averages are converging, suggesting that the upward trend may be losing momentum. Traders should also pay attention to the Fibonacci retracement levels, which can provide additional support and resistance levels. The 38.2% Fibonacci retracement level of the recent upward move is around $88.3, which could act as a key support level. A break below this level could lead to a test of the 50% retracement level around $87.6.
The Verdict: Cautious Optimism
Considering the technical and fundamental factors, a cautiously optimistic approach seems warranted for XAGUSD. While the bullish momentum remains intact, the overbought conditions on the short-term charts and the strength of the US dollar suggest that a pullback is possible. Traders should closely monitor the key support and resistance levels and adjust their positions accordingly. Scalpers might look for short-term opportunities to sell near resistance and buy near support, while swing traders should focus on identifying a clear breakout or breakdown before entering a position. Long-term investors may consider accumulating silver on dips, given its positive long-term outlook.
It's also crucial to monitor the broader market context, including the performance of the US dollar, equity markets, and other commodities. A decline in risk appetite, as reflected in a falling SP500 or Nasdaq, could boost safe-haven demand and support silver prices. Conversely, a strong dollar and rising Treasury yields could weigh on silver. Keep an eye on geopolitical tensions, as safe-haven assets tend to benefit from increased uncertainty. According to Reuters, Fed officials have emphasized that inflation remains "stubborn", suggesting that interest rates may need to stay higher for longer. This could further support the US dollar and put downward pressure on silver.
Trade Plan for XAGUSD
Based on the technical picture, a potential trade plan for XAGUSD can be formulated. Given the strong ADX reading of 26.04, a trend is clearly in place. The RSI and MACD histogram are aligned, providing a clear directional signal. The Stochastic oscillator is within a tradeable zone, not exhibiting extreme overbought or oversold conditions.
XAGUSD breaks above the $89.34 resistance level, confirming the bullish trend. This could lead to a test of the $89.76 level, followed by a potential move towards $90.15. The bullish scenario is supported by positive momentum on the 4-hour chart and strong industrial demand for silver.
XAGUSD fails to break above $89.34 and declines below the $87.92 support level. This could trigger further selling, potentially targeting the $87.5 level, followed by a move towards $87. The bearish scenario is supported by overbought conditions on the 1-hour chart and the strength of the US dollar.
Upcoming Economic Events
Traders should be aware of the upcoming economic events that could impact XAGUSD. On Wednesday, March 11, EUR data will be released. Additionally, several USD data points are scheduled for release on Wednesday, March 11. These data releases could trigger volatility in the US dollar, which in turn could affect silver prices. Furthermore, GBP data is scheduled for release on Friday, March 13, which could impact the broader market sentiment. Be aware of the potential impact of these events and manage your risk accordingly.
Frequently Asked Questions: XAGUSD Analysis
What happens if XAGUSD breaks above $89.34 resistance?
If XAGUSD breaks above the $89.34 resistance, it could signal a continuation of the upward trend, potentially targeting the $89.76 and $90.15 levels. This scenario is supported by positive momentum on the 4-hour chart and strong industrial demand for silver.
Should I buy XAGUSD at current levels of $89.29 given RSI at 65.43?
While the RSI at 65.43 is approaching overbought levels, it's not yet a definitive sell signal. Consider waiting for a pullback towards the $87.92 support level before entering a long position. Manage your risk and set a stop-loss order below the support level.
Is the Stochastic indicator on the 1-hour chart a reliable sell signal for XAGUSD?
The Stochastic indicator on the 1-hour chart is showing a potential downturn (%K
How will the upcoming USD data releases on March 11 affect XAGUSD this week?
The upcoming USD data releases on March 11 could significantly impact XAGUSD. Stronger-than-expected data could boost the US dollar, putting downward pressure on silver. Conversely, weaker-than-expected data could weaken the dollar and support silver prices. Monitor the data releases closely and adjust your positions accordingly.
Technical Outlook Summary
| Indicator | Value | Signal |
|---|---|---|
| RSI (14) - 1H | 65.43 | Neutral |
| MACD Histogram - 4H | Positive | Bullish |
| Stochastic - 1H | K=53.4, D=63.81 | Bearish |
| ADX - 1H | 28.83 | Strong Trend |
| Bollinger - 4H | Upper Band | Watch |
Key Levels
Support Levels
Resistance Levels
Track markets in real-time
AI-powered analysis, technical indicators and real-time price data.
Join Our Telegram Channel
Breaking market news, AI analysis and trading signals instantly.
Join Channel