WTI Eyes $87.63 Resistance: Can Bull Run Beat CPI Data?
WTI crude oil surges to $87.63 amid geopolitical tensions, but faces a critical test as CPI data looms. Will the bullish momentum hold?
WTI crude oil is currently trading at $87.63, showing a daily gain of 3.14%. The surge is fueled by a combination of factors, including heightened geopolitical tensions and supply concerns. However, the sustainability of this bull run hinges on upcoming CPI data, which could either validate or undermine the current bullish sentiment.
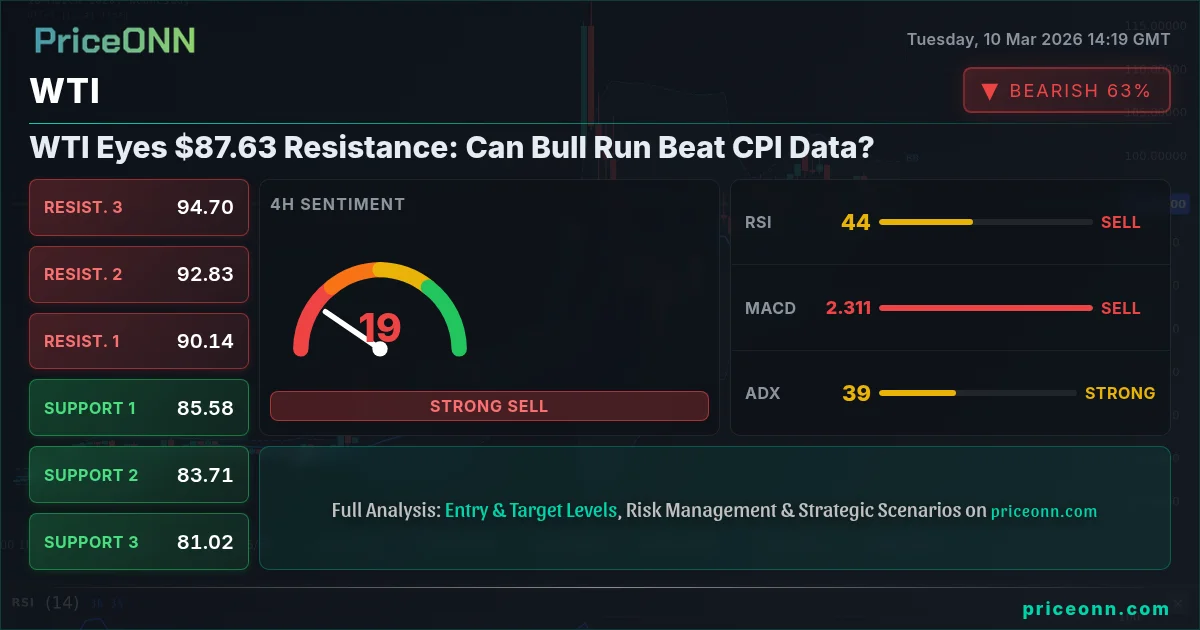
- RSI at 76.01 on the daily chart signals overbought conditions, suggesting a potential pullback.
- Key resistance lies at $89.41, a level not seen since the last major rally.
- Strong bullish trend confirmed by ADX at 44.27 on the daily timeframe.
- Upcoming CPI data is the major catalyst, likely to dictate short-term price action.
Decoding WTI's Current Technical Posture
From a technical perspective, WTI's current position presents a mixed bag of signals. The 1-hour chart indicates a downtrend with an ADX of 32.54, while the 4-hour and daily charts point to a strong uptrend with ADX values of 41.58 and 44.27, respectively. This divergence highlights the importance of multi-timeframe analysis. The hourly RSI at 43.49 suggests there is room for further downside movement in the very short term, but the longer-term perspective suggests the potential for continued upward momentum. It's important to note that WTI's price direction is heavily influenced by global events, as noted in recent news regarding geopolitical tensions pushing prices above $120, though that level is not currently reflected in the market data. The current price of $87.63 is a far cry from that reported peak.
The Stochastic oscillator on the 1-hour chart shows a bullish crossover (%K > %D), providing a conflicting signal to the RSI. However, the Stochastic on the 4-hour chart is in oversold territory (%K at 17.34), suggesting that the recent pullback may be nearing its end. The MACD histogram on the 1-hour chart is positive, indicating bullish momentum, but it is declining, suggesting that the momentum is waning. This further emphasizes the need for caution and confirmation before committing to a long position.
Key Price Levels to Watch
Key support levels for WTI are identified at $84.66, $82.53, and $79.91 on the 4-hour chart. These levels could act as potential buying opportunities if the price retraces. Resistance levels are seen at $89.41, $92.03, and $94.16. A breakout above $89.41 could signal a continuation of the bullish trend, while a failure to break this level could lead to a deeper correction.
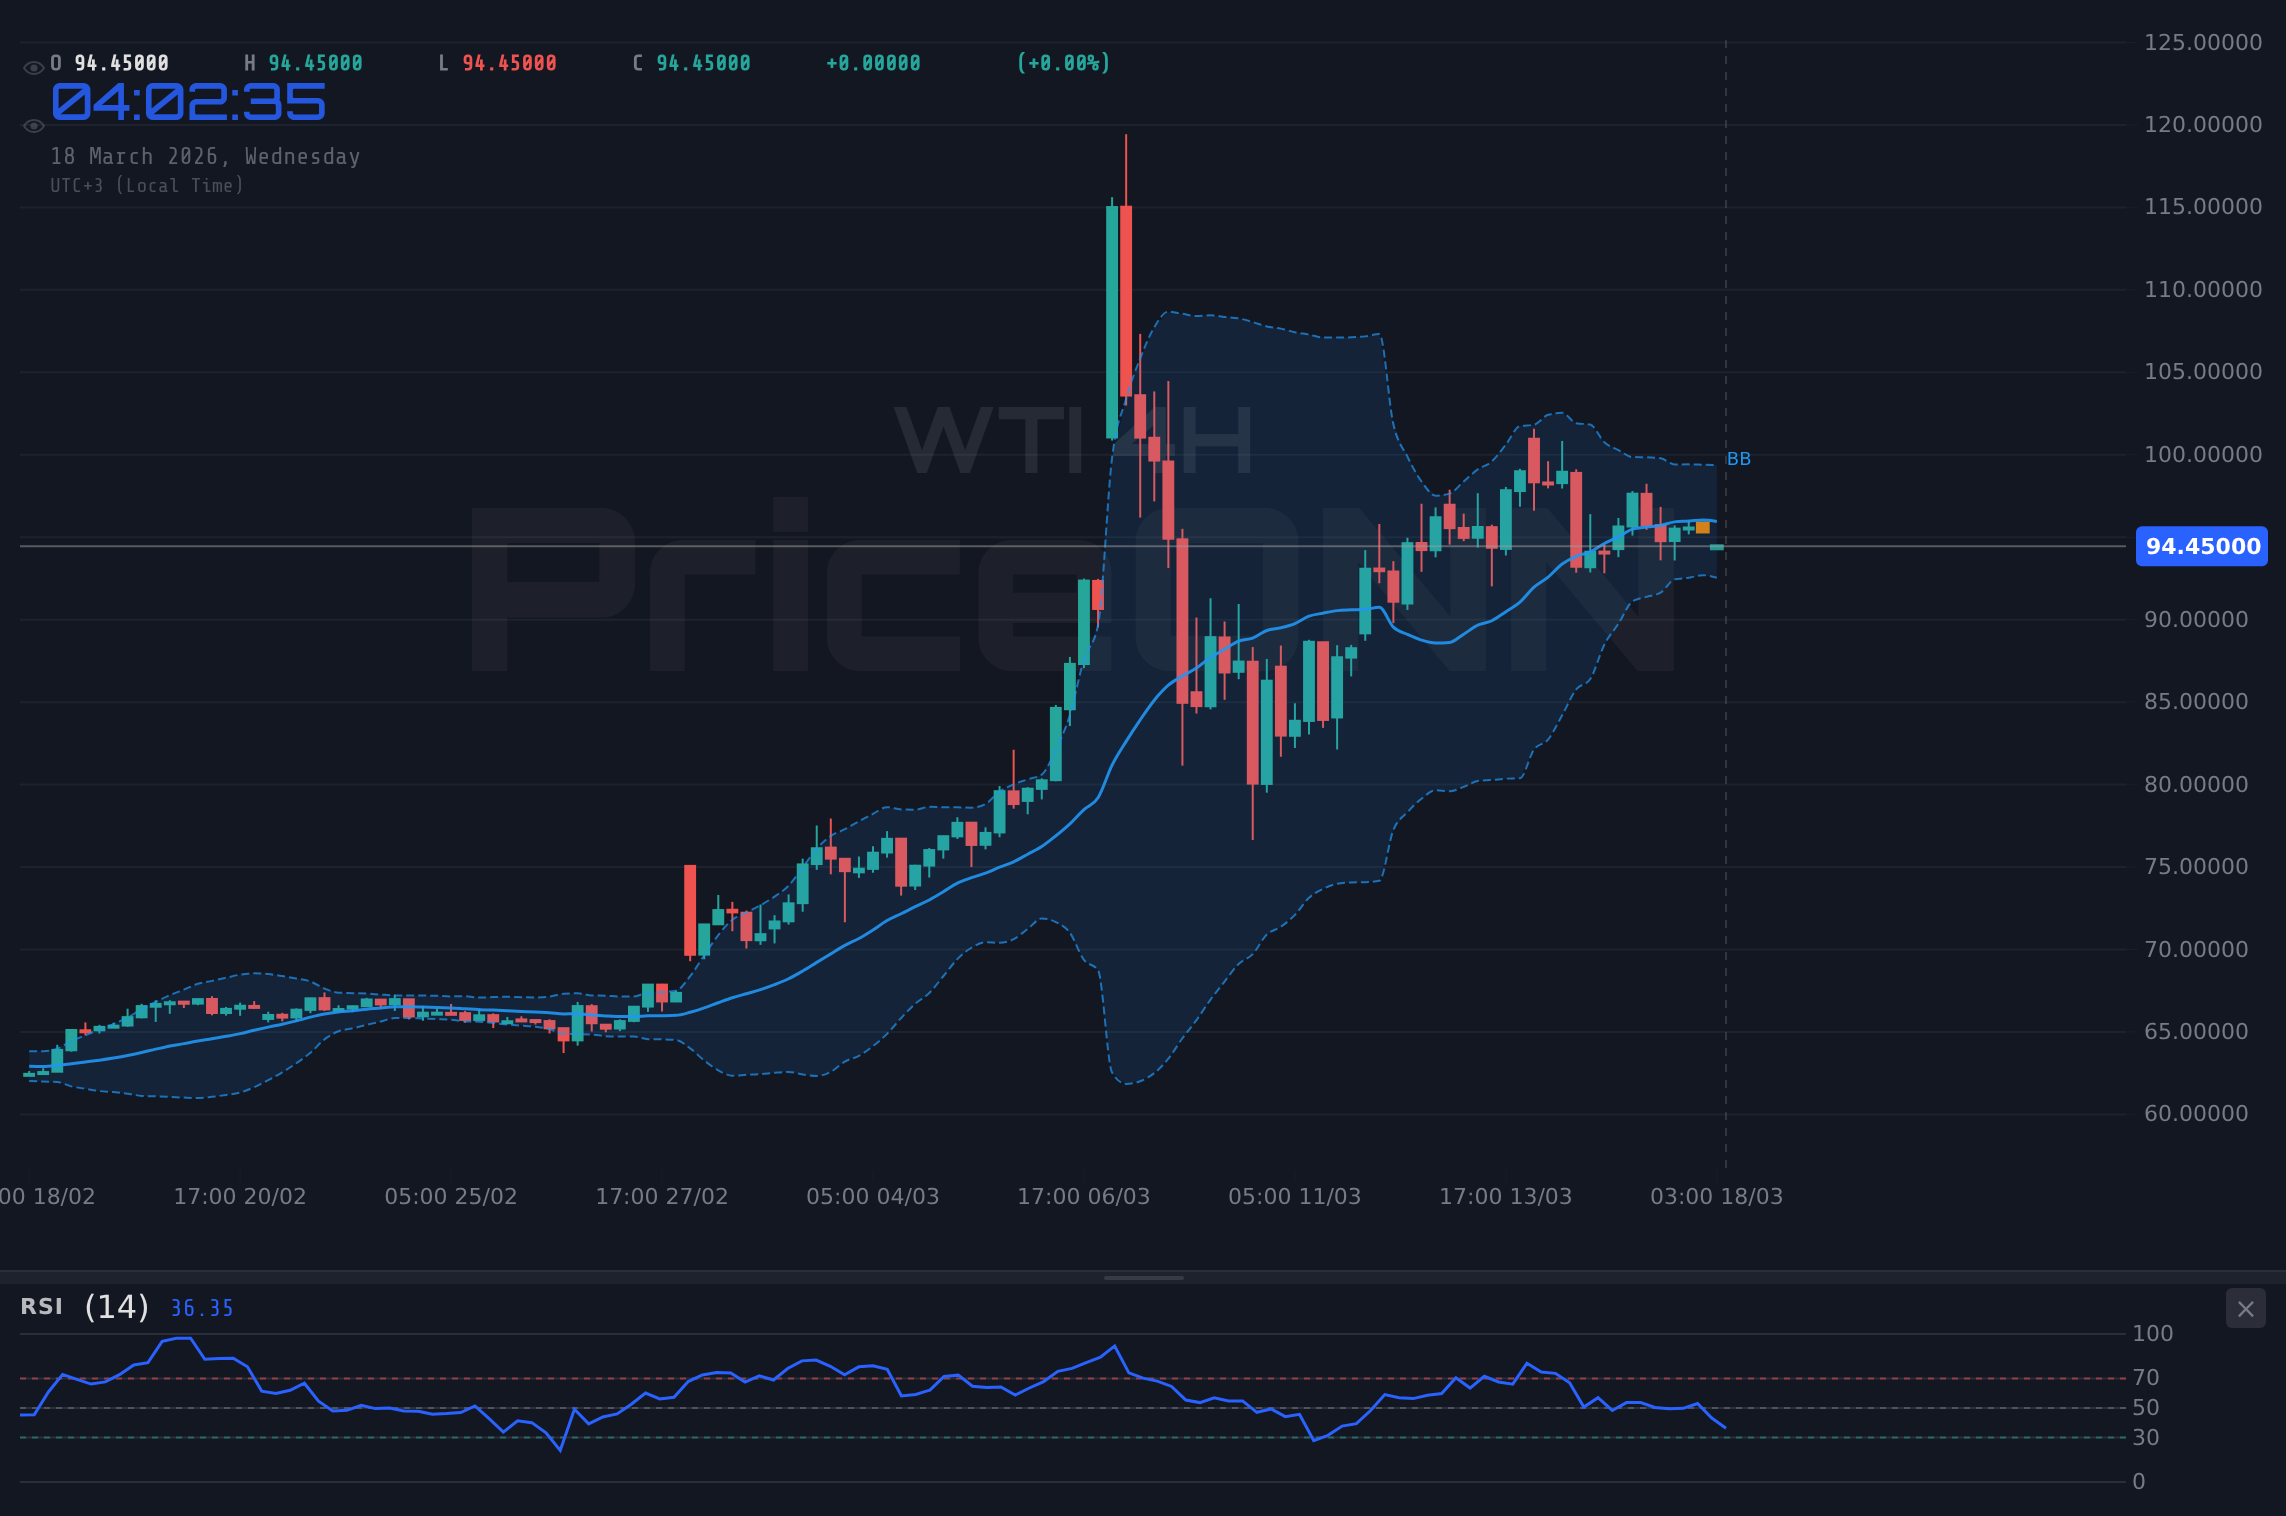
The daily chart paints a more compelling picture of bullish strength, with the price trading above its 200-day moving average. However, the RSI at 76.01 is flashing overbought signals, suggesting that the market may be due for a breather. The upper Bollinger Band is also being tested, which often signals overbought conditions or potential breakout scenarios. It is important to consider the broader market context; for example, the DXY (Dollar Index) is currently at 98.47. Historically, a rising DXY puts downward pressure on commodities like WTI, so this correlation should be closely monitored.
Trade Plan: Riding the WTI Bull (With Caution)
Given the mixed signals, a measured approach is warranted. While the overall trend remains bullish, the overbought conditions and potential for a pullback cannot be ignored. The upcoming CPI data adds another layer of uncertainty. Here's a potential trade plan:
WTI breaks above the $89.41 resistance, confirming the continuation of the bullish trend. The initial target is $92.03, followed by $94.16. This scenario is contingent on CPI data not derailing the bullish sentiment.
WTI fails to break above $89.41 and retraces towards the $84.66 support. A break below this level could trigger a deeper correction towards $82.53 and $79.91. This scenario is more likely if CPI data comes in higher than expected, fueling concerns about inflation and potentially leading to a stronger dollar.
Risk Considerations
The economic calendar is light on high-impact events, except the USD CPI data which is expected on Wednesday. This data release could significantly impact WTI, especially if it deviates substantially from expectations. Traders should exercise caution and manage their risk accordingly.
Strategic Positioning for Different Trader Types
The current technical outlook suggests different strategies for different trader profiles. Scalpers could look for short-term opportunities within the existing range, capitalizing on small price fluctuations. Swing traders might wait for a clear breakout above $89.41 or a break below $84.66 before initiating a position. Long-term investors might view any pullback as a buying opportunity, given the overall bullish trend. The key is to align your trading strategy with your risk tolerance and time horizon.
The recent news highlights the volatile nature of WTI, with geopolitical tensions acting as a significant catalyst. This volatility presents both opportunities and risks. Traders should stay informed and adapt their strategies accordingly. Furthermore, the influence of central bank policies cannot be ignored. The Fed's stance on interest rates will likely continue to impact the dollar, which in turn will affect WTI prices.
Frequently Asked Questions: WTI Analysis
What happens if WTI breaks above $89.41 resistance?
A breakout above the $89.41 resistance would likely confirm the continuation of the bullish trend, potentially leading to targets at $92.03 and $94.16. This scenario becomes more probable if upcoming CPI data does not trigger inflationary concerns.
Should I buy WTI at current levels of $87.63, given RSI at 76.01?
While the overall trend is bullish, an RSI of 76.01 suggests overbought conditions. A cautious approach would be to wait for a pullback towards the $84.66 support before initiating a long position, managing risk in case of a deeper correction.
Is the MACD signal on the 1-hour chart reliable for WTI trading?
The MACD signal on the 1-hour chart is currently positive, indicating bullish momentum, but it's declining. Given the conflicting signals from other indicators, it's best to use the MACD in conjunction with other tools and consider multi-timeframe analysis for confirmation.
How will the Wednesday CPI data affect WTI this week?
Higher-than-expected CPI data could fuel concerns about inflation, potentially leading to a stronger dollar and downward pressure on WTI. Conversely, weaker CPI data could support the current bullish trend, encouraging further upside movement.
Technical Outlook Summary
| Indicator | Value | Signal |
|---|---|---|
| RSI (14) | 76.01 | Overbought |
| MACD Histogram | Positive | Bullish |
| Stochastic | 58.21/75.85 | Bearish |
| ADX | 44.27 | Strong Trend |
| Bollinger | Upper Band | Watch |
Key Levels
Support Levels
Resistance Levels
Track markets in real-time
AI-powered analysis, technical indicators and real-time price data.
Join Our Telegram Channel
Breaking market news, AI analysis and trading signals instantly.
Join Channel