Gold is testing the $5,179.39 level today, fueled by ongoing geopolitical concerns and ahead of potentially market-moving CPI data. The question now is whether this rally has legs or if a pullback is in the cards.
- RSI at 45.01 on the 1H chart suggests neutral momentum, but a potential shift downwards.
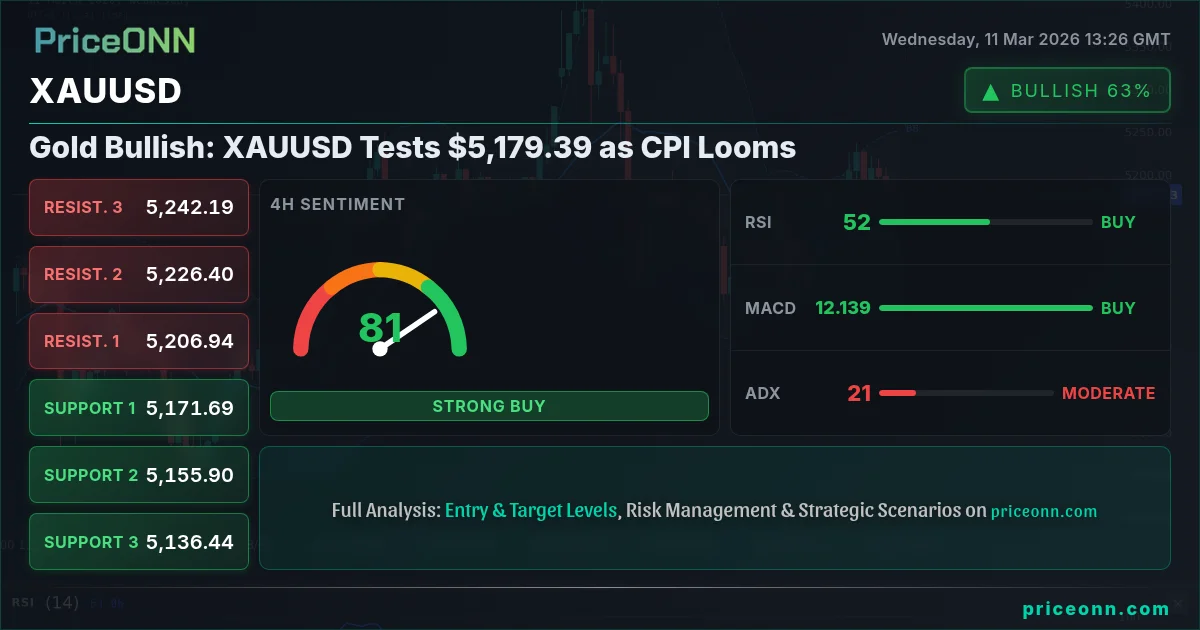
- Critical resistance lies at $5,191.18 on the 1H timeframe; a break above could signal further upside.
- The MACD histogram indicates negative momentum on the 1H chart, suggesting caution for bullish positions.
- Upcoming CPI data and DXY movements will likely drive XAUUSD price action this week.
The price of gold has been a beneficiary of uncertainty in recent months, acting as a safe haven asset amid geopolitical tensions and concerns about global economic growth. With the US Dollar Index (DXY) currently at 98.86, any further strengthening of the dollar could put downward pressure on gold prices. Conversely, a weaker dollar could provide additional tailwinds for XAUUSD.
Looking at the technical picture, the 1-hour chart shows a neutral trend with an ADX of 14.78, indicating a weak trend. The RSI is at 45.01, suggesting neutral momentum but with a slightly bearish tilt. The MACD histogram is negative, further reinforcing this bearish sentiment in the short term. The Stochastic oscillator, with K=22.06 and D=26.61, also signals a potential downward move, as %K is less than %D.
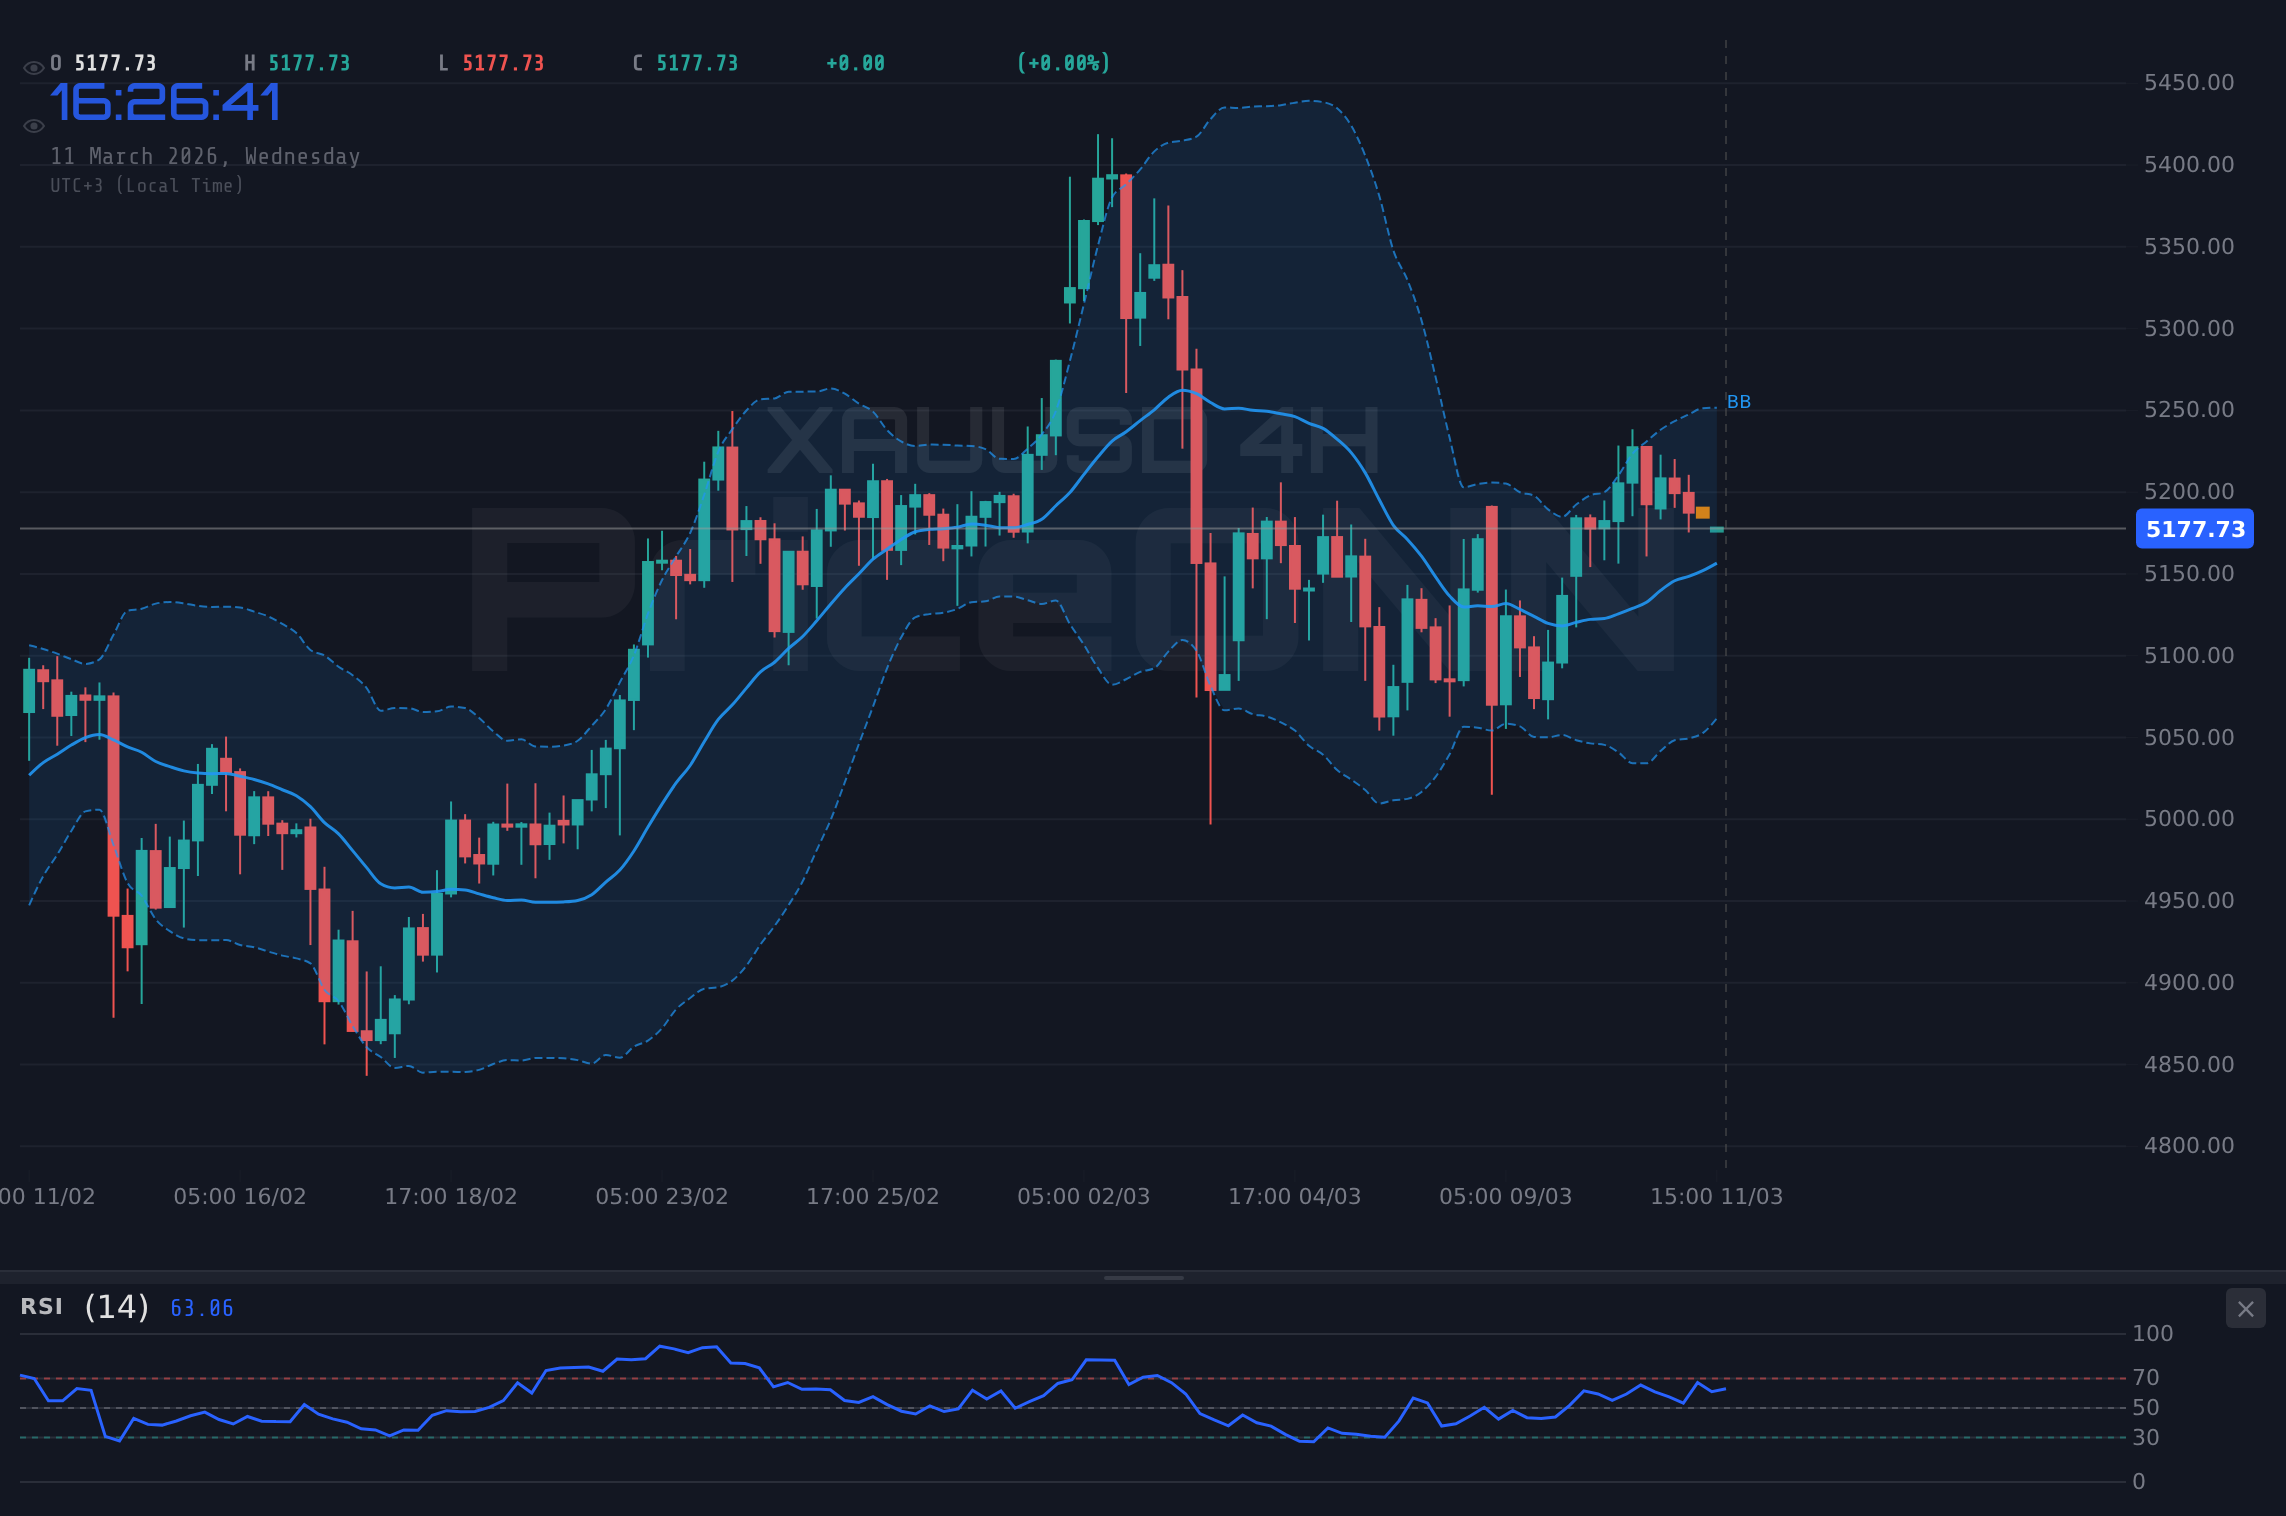
On the 4-hour timeframe, the trend is also neutral, but the RSI is at 52.02, suggesting a slightly bullish bias. The MACD is positive, indicating upward momentum. However, the Stochastic oscillator shows a bearish signal, with K=69.2 and D=82.72. This divergence in signals highlights the current uncertainty in the market.
The daily chart paints a more bullish picture, with an upward trend and an RSI of 55.18. The MACD is negative, but the Stochastic oscillator signals a potential upward move. However, the ADX is only at 12.08, indicating a weak trend. This suggests that while the overall trend may be bullish, the current momentum is not particularly strong.
Key support levels to watch are $5,173.49, $5,165.77, and $5,155.8 on the 1H timeframe. On the upside, resistance levels are $5,191.18, $5,201.15, and $5,208.87. A break above the $5,191.18 resistance could signal a continuation of the upward trend, while a break below the $5,173.49 support could lead to further downside.
"Oil Prices Brace for Impact as Strait of Hormuz Faces Mining Threat," according to recent news. Rising oil prices can often fuel inflation, which in turn, can increase demand for gold as a hedge against inflation. So, this geopolitical tension is another factor supporting gold prices.
According to Reuters, Fed officials are closely monitoring inflation data as they consider future interest rate hikes. If the upcoming CPI data, scheduled for release today, comes in higher than expected, it could prompt the Fed to adopt a more hawkish stance, potentially strengthening the dollar and putting downward pressure on gold. Conversely, weaker-than-expected CPI data could lead to a more dovish Fed and a weaker dollar, which could support gold prices.
The current market sentiment for XAUUSD is mixed. While the overall trend may be bullish, the short-term momentum is uncertain. Traders should pay close attention to the upcoming CPI data and DXY movements, as these factors are likely to have a significant impact on gold prices. The USD/JPY is gaining ground near 158.30, as uncertainty around the Bank of Japan's policy outlook continues to weaken the yen. This can affect the risk sentiment, and as a safe haven, gold can benefit.
Having tracked XAUUSD through the 2024 rate cycle, it’s crucial to remember how sensitive gold is to interest rate expectations. Higher rates typically diminish gold's appeal, while lower rates make it more attractive. Historically, when the 1H RSI reaches the current zone around 45 on XAUUSD, the outcome has been a period of consolidation followed by a directional move dependent on broader market catalysts.
The ADX at 20.58 indicates a moderate trend strength on the 4H chart. With RSI and MACD histogram aligned, there is a reasonably clear directional signal. Considering the current technical picture, a potential trade plan could be formulated. The Stochastic oscillator in the 1H chart is signaling a potential downward move, with K=22.06 and D=26.61.
If XAUUSD breaks above the $5,191.18 resistance level, the next target would be $5,201.15, followed by $5,208.87. This scenario is contingent on weaker-than-expected CPI data or a weakening dollar.
If XAUUSD breaks below the $5,173.49 support level, the next target would be $5,165.77, followed by $5,155.8. This scenario is contingent on stronger-than-expected CPI data or a strengthening dollar.
Frequently Asked Questions: XAUUSD Analysis
What happens if XAUUSD breaks above $5,191.18 resistance?
If XAUUSD breaks above the $5,191.18 resistance, we can expect the price to target $5,201.15 and potentially $5,208.87. This breakout would likely be driven by weaker-than-expected CPI data or a weakening dollar.
Should I buy XAUUSD at current $5,179.39 levels given RSI at 45.01?
With the RSI at 45.01 on the 1H timeframe, it's not an oversold condition, so a buy signal is not immediately apparent. A more conservative approach would be to wait for a break above $5,191.18 resistance before considering a long position, which could provide a higher probability trade.
Is RSI at 55.18 on the daily chart a sell signal for XAUUSD?
An RSI of 55.18 on the daily chart is not a sell signal, as it's within a neutral zone. However, traders should be cautious if the RSI begins to trend downwards, as this could indicate weakening bullish momentum.
How will the upcoming CPI data affect XAUUSD this week?
The upcoming CPI data is a key catalyst for XAUUSD this week. Stronger-than-expected CPI data could lead to a stronger dollar and downward pressure on gold, while weaker-than-expected data could lead to a weaker dollar and upward pressure on gold.
Technical Outlook Summary
| Indicator | Value | Signal |
|---|---|---|
| RSI (14) - 1H | 45.01 | Neutral |
| MACD Histogram - 1H | Negative | Bearish |
| Stochastic - 1H | K=22.06, D=26.61 | Bearish |
| ADX - 1H | 14.78 | Weak Trend |
| Bollinger - 1H | Middle Band | Watch |
Key Levels
Support Levels
Resistance Levels
Track markets in real-time
AI-powered analysis, technical indicators and real-time price data.
Join Our Telegram Channel
Breaking market news, AI analysis and trading signals instantly.
Join Channel