

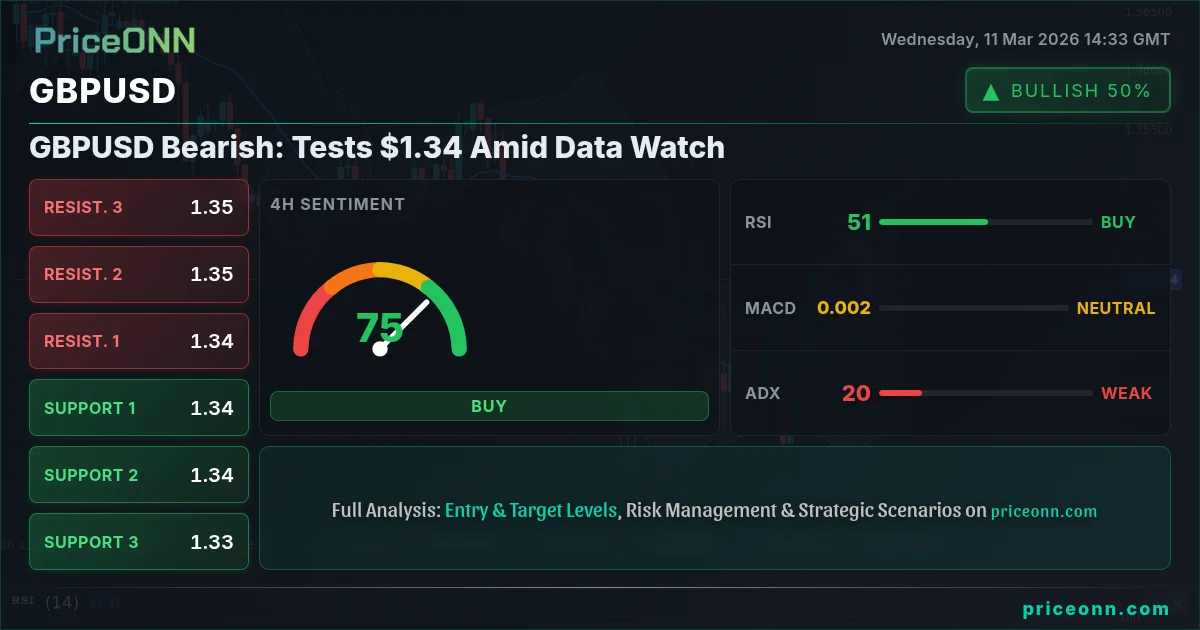
GBPUSD is testing the $1.34 level, a key area that traders are watching closely as of March 11, 2026. With a combination of weak UK economic data and a strengthening US Dollar Index (DXY), the pair faces significant downward pressure. The question now is whether this level will hold or if bears will take control, paving the way for further declines.
- GBPUSD tests $1.34, a critical level for both bulls and bears.
- DXY at 98.8 is strengthening, putting downward pressure on GBPUSD.
- Stochastic on 1H chart shows a bearish signal, with %K at 30.48 and %D at 43.66.
- Watch for Friday's GBP data release, which could be a key catalyst for the pair.
The Bullish Rebound Scenario
For the bulls to regain control, GBPUSD needs to decisively break above the immediate resistance at 1.34227 on the 1H chart. This would signal a potential shift in momentum, attracting buyers and potentially triggering a move towards the next resistance levels at 1.34474 and 1.34619. This scenario hinges on a weakening DXY and positive surprises in upcoming UK economic data. A break above 1.34619 could open the door for a test of the 1.35 level. Time horizon: intraday to this week.
Where Bears Take Control
The bearish scenario is looking increasingly likely, given the current technical setup. If GBPUSD fails to hold $1.34 and breaks below the immediate support at 1.33835, it would confirm the bearish momentum. This could trigger a cascade of sell orders, pushing the pair towards the next support levels at 1.3369 and 1.33443. A daily close below 1.33443 would signal a more significant bearish trend, potentially leading to a test of the 1.33 level. The 1D chart shows a strong downward trend with an ADX of 27.54. Time horizon: this week to this month.
The Waiting Game: Range-Bound Consolidation
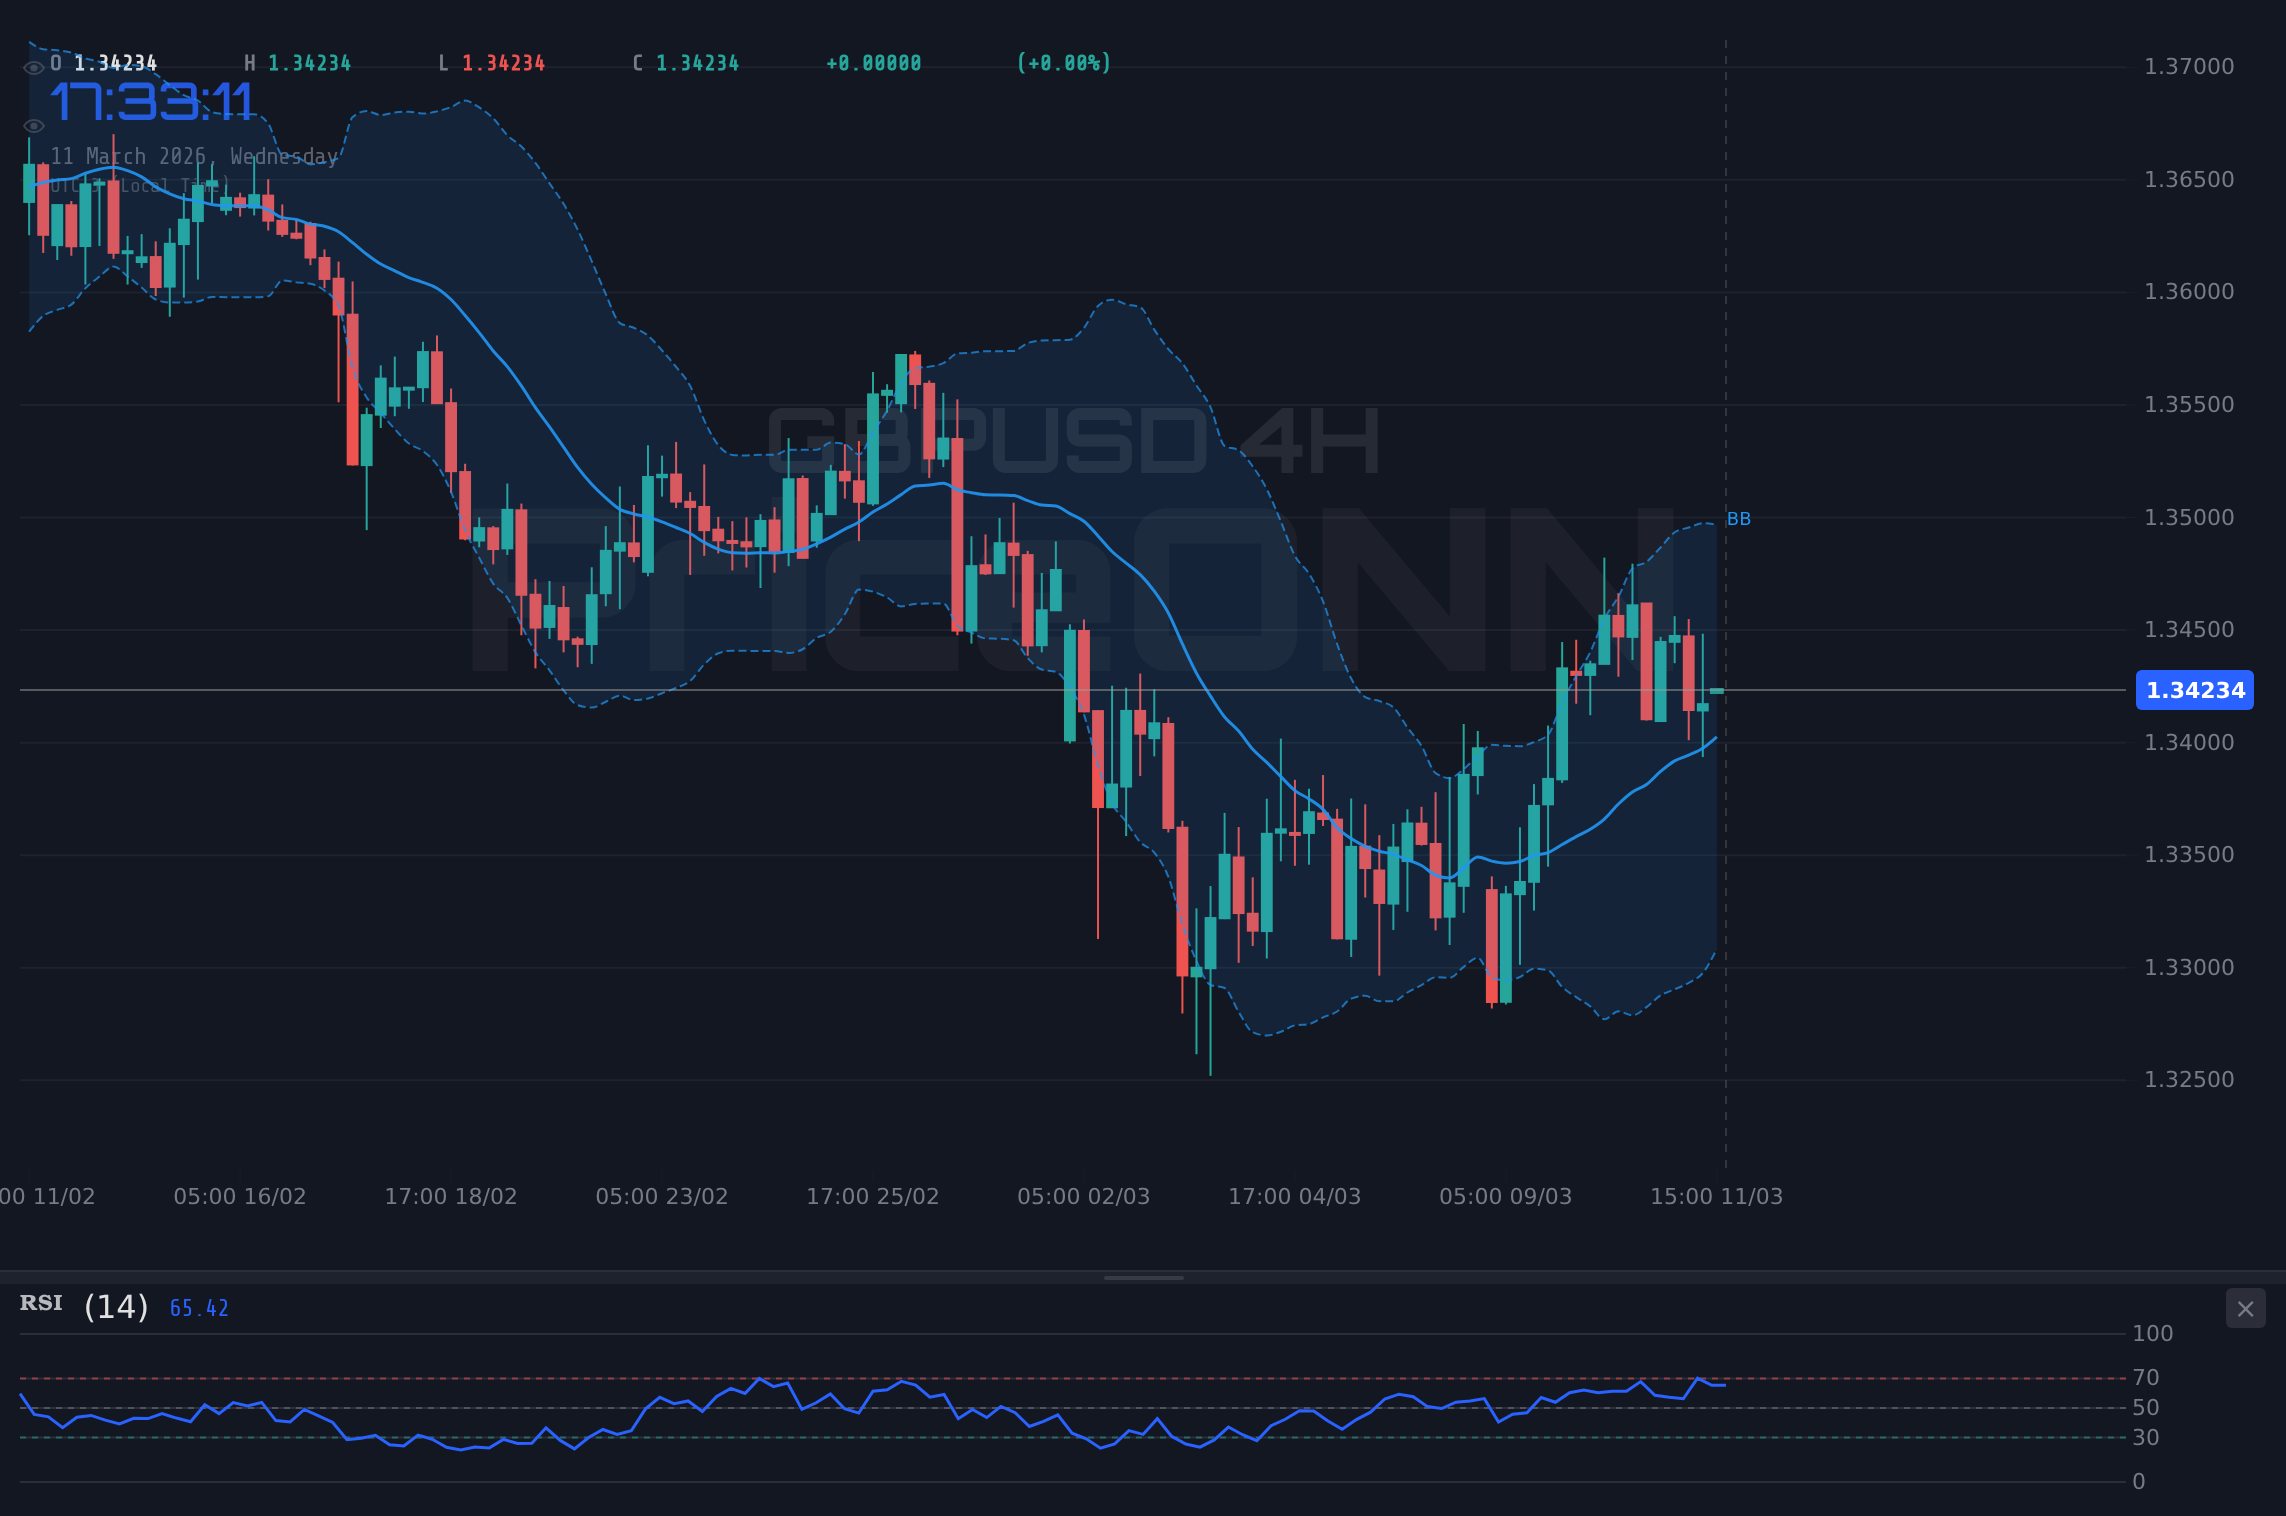
A neutral scenario would involve GBPUSD remaining range-bound between the support at 1.33835 and the resistance at 1.34227. This could occur if market participants are hesitant to take a strong directional bias ahead of key economic data releases. The 1H chart shows a neutral trend with a strength of 50%, further supporting this scenario. The DXY's sideways movement could also contribute to this consolidation phase. Until a clear breakout occurs, traders may find limited opportunities within this range. Time horizon: intraday to the next few days.
The ADX on the 1H chart is at 19.7, indicating a weak trend. This suggests that any breakout, whether bullish or bearish, needs strong confirmation to avoid a false signal.
Assessing the Most Likely Path
Given the current technical and fundamental factors, the bearish scenario appears to be the most likely, with an estimated probability of 60%. The strengthening DXY, coupled with the weak UK economic outlook, suggests that GBPUSD faces significant downward pressure. The Stochastic on the 1H chart also supports this bearish bias, with %K at 30.48 and %D at 43.66, indicating further downside potential. However, traders should remain vigilant and monitor key levels for confirmation.
Key Triggers to Watch This Week
Several key triggers could significantly impact GBPUSD this week. First, traders should closely monitor the DXY for any signs of reversal, which could alleviate some of the downward pressure on GBPUSD. Second, the upcoming GBP data release on Friday is a crucial event that could provide further insights into the UK's economic health. Finally, keep an eye on overall market sentiment, as risk-off episodes tend to favor safe-haven currencies like the USD, further weighing on GBPUSD.
Friday's GBP data release could trigger significant volatility in GBPUSD. Traders should exercise caution and manage their risk accordingly.
Decoding the Technical Signals
Analyzing GBPUSD's technical indicators across different timeframes reveals a mixed picture. On the 1H chart, the RSI(14) sits at 46.26, indicating neutral momentum with a slight downward bias. The MACD histogram is negative, further supporting the bearish sentiment. However, the 4H chart presents a slightly different perspective. The RSI(14) is at 52.32, suggesting neutral momentum with a slight upward bias. The MACD histogram is positive, indicating potential bullish momentum. This divergence highlights the importance of considering multiple timeframes when assessing the overall trend.
GBPUSD and the Dollar Index Dance
The inverse correlation between GBPUSD and the DXY continues to play a significant role. With the DXY currently at 98.8 and showing signs of further strength, GBPUSD is facing increased downward pressure. The DXY's strength is driven by expectations of further interest rate hikes by the Federal Reserve, while the Bank of England is expected to maintain a more dovish stance. This policy divergence is likely to continue weighing on GBPUSD in the near term.
Geopolitical Fears Subside - Limited Impact on Sterling
Recent news indicates that geopolitical fears are subsiding, with the US Dollar attempting to regain its footing near the 99.50 level. While this development could potentially ease some of the risk-off sentiment, its impact on GBPUSD is likely to be limited. The pair's primary drivers remain the divergence in monetary policy between the UK and the US, as well as the overall strength of the US dollar. The news regarding the mining threat in the Strait of Hormuz is unlikely to impact GBPUSD directly. The focus remains on the macroeconomic factors and central bank policies.
GBPUSD Macroeconomic Factors March 2026
The GBPUSD faces pressure due to a combination of factors, including diverging monetary policies and economic data. The Bank of England is expected to maintain a cautious approach amid concerns about the UK's economic outlook, while the Federal Reserve is likely to continue raising interest rates to combat inflation. This divergence is weighing on the GBPUSD, as investors favor the higher-yielding US dollar. Furthermore, recent economic data from the UK has been weaker than expected, adding to the downward pressure on the pair.
"The divergence in monetary policy between the UK and the US is likely to continue weighing on GBPUSD in the near term. Traders should closely monitor upcoming economic data releases for further clues about the direction of the pair."
Analyzing Key Economic Events
Several key economic events are scheduled for this week that could significantly impact GBPUSD. The upcoming GBP data release on Friday is a crucial event that could provide further insights into the UK's economic health. Any positive surprises could trigger a bullish rebound, while negative surprises could exacerbate the bearish momentum. Traders should also monitor the US data releases, as they could influence the DXY and indirectly impact GBPUSD. The EUR data release on Wednesday will be also key to watch. The market will be closely watching these events for clues about the future direction of the pair.
What the MACD Signal Tells Us About GBPUSD Trend Analysis
The Moving Average Convergence Divergence (MACD) indicator provides valuable insights into GBPUSD's trend. On the 1D chart, the MACD histogram is negative, indicating bearish momentum. However, the 4H chart presents a slightly different picture, with a positive MACD histogram, suggesting potential bullish momentum. This divergence highlights the importance of considering multiple timeframes when assessing the overall trend. Traders should use the MACD in conjunction with other indicators and price action analysis to confirm their trading decisions.
| Indicator | Value | Signal | Interpretation |
|---|---|---|---|
| RSI (14) - 1H | 46.26 | Neutral | Slightly bearish bias |
| MACD Histogram - 1H | Negative | Bearish | Bearish momentum |
| Stochastic - 1H | K=30.48, D=43.66 | Bearish | Further downside potential |
| ADX - 1H | 19.7 | Weak | Trend strength is weak |
| RSI (14) - 1D | 44.82 | Neutral | Slightly bearish bias |
GBPUSD Trading Plan
Given the technical and fundamental outlook, here's a potential trading plan for GBPUSD:
Enter short if GBPUSD breaks and closes below 1.33835. Target 1 is 1.3369, and Target 2 is 1.33443. This scenario is supported by the strengthening DXY and weak UK economic outlook.
Enter long if GBPUSD breaks and closes above 1.34227. Target 1 is 1.34474, and Target 2 is 1.34619. This scenario requires a weakening DXY and positive surprises in UK economic data.
Frequently Asked Questions: GBPUSD Analysis
What happens if GBPUSD breaks below 1.33835 support?
If GBPUSD breaks below 1.33835, it would confirm the bearish momentum and could trigger a cascade of sell orders, pushing the pair towards the next support levels at 1.3369 and 1.33443.
Should I sell GBPUSD at current levels of $1.34 given the DXY at 98.8?
Given the DXY at 98.8, a short position could be considered if GBPUSD fails to hold $1.34 and breaks below the immediate support at 1.33835. Manage your risk and watch for confirmation.
Is RSI at 46.26 on the 1H chart a sell signal for GBPUSD right now?
With RSI at 46.26 on the 1H chart indicating neutral momentum with a slight downward bias, it's not a definitive sell signal. It should be used in conjunction with other indicators and price action analysis to confirm trading decisions.
How will Friday's GBP data release affect GBPUSD this week?
Friday's GBP data release is a crucial event that could provide further insights into the UK's economic health. Positive surprises could trigger a bullish rebound, while negative surprises could exacerbate the bearish momentum, potentially pushing GBPUSD below 1.33.
Track markets in real-time
AI-powered analysis, technical indicators and real-time price data.
Join Our Telegram Channel
Breaking market news, AI analysis and trading signals instantly.
Join Channel