The SP500's test of $6,750.40 is more than just a technical level- it's a barometer of risk sentiment across global markets. As the index hovers near this critical support, investors are grappling with a cocktail of concerns, from inflation jitters to geopolitical uncertainties. The question now is whether this is a temporary pullback or the start of a deeper correction.
The DXY Effect: Dollar Strength Weighs on SP500
The SP500's current struggles are inextricably linked to the strength of the US Dollar Index (DXY), which currently sits at 99. The dollar's 0.46% daily gain is acting as a headwind for the index. This inverse correlation is a classic risk-off signal: as investors flock to the safety of the dollar, equities like the SP500 tend to suffer. The Nasdaq100 is also showing signs of weakness, currently at 24889.27, and down 0.37% for the day. This confirms the risk-off sentiment, with both indices under pressure.
Technical Breakdown: Key Levels to Watch
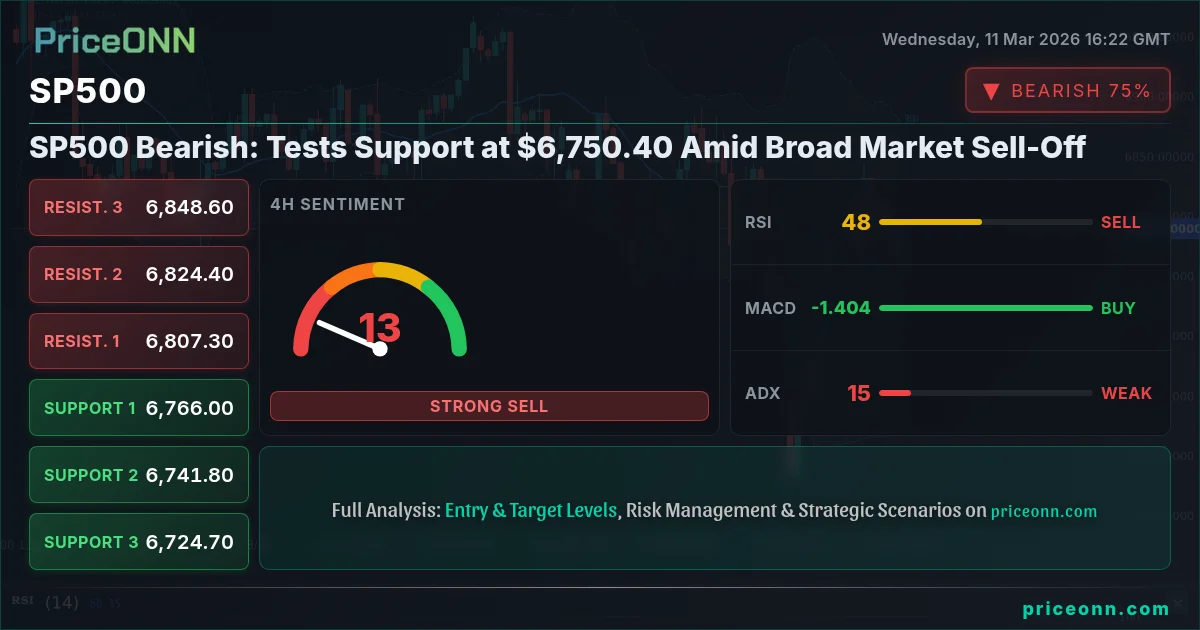
From a technical perspective, the SP500's break below the 6,800 level has opened the door to further downside. The 1-day chart shows a strong downtrend, with an ADX of 34.35. This confirms that the bearish move has momentum behind it. The next key level to watch is the support at 6710.67, the S2 level. If the index breaks below $6,750.40, this level will likely be tested. Resistance sits at 6837.93, but that level is unlikely to be tested unless market sentiment shifts dramatically.

Inflation Fears and the Fed: A Looming Threat
Underlying the technical picture is a growing sense of unease about inflation. Recent news headlines are not helping. For instance, the looming US inflation data is a major catalyst. The market is bracing for potentially hawkish signals from the Federal Reserve. The economic calendar is filled with important USD data releases on March 13th, which will provide more clarity on the inflation outlook. If the data comes in higher than expected, it could trigger a further sell-off in equities. It will also strengthen the DXY, putting even more pressure on the SP500.
Intermarket Dynamics: Bonds and Commodities Send Mixed Signals
The SP500's correlation with other asset classes is also providing valuable insights. WTI crude is currently trading at $88.24, up 2.25% for the day. Typically, rising oil prices would support inflation expectations, which is not the case here. The SP500 is down, which means the market is worried about something else- most likely, a slowdown in economic growth. Brent crude surged above $91 a barrel, up 3.80%, as supply disruption fears in the Strait of Hormuz outweighed reports of an increase in oil inventories.
Geopolitical Risks: A Constant Undercurrent of Uncertainty
Geopolitical tensions continue to simmer in the background. While the tensions aren't the primary driver of the current market sell-off, they are adding to the overall sense of uncertainty. Any escalation could easily trigger a flight to safety, further depressing equity prices. Investors should closely monitor news headlines for any signs of increased geopolitical risk. However, the dollar is softening as geopolitical risks recede, with traders now focused on the February CPI data for a clearer picture.
A Contrarian Indicator: The VIX
The CBOE Volatility Index (VIX), often referred to as the "fear gauge," is another important indicator to watch. A rising VIX typically signals increased market volatility and risk aversion. While the VIX is not flashing any immediate warning signals, it is worth monitoring closely. A spike in the VIX could confirm the bearish thesis for the SP500 and signal further downside ahead.
The Bear Case: How Low Can SP500 Go?
Given the confluence of negative factors- dollar strength, inflation fears, and geopolitical risks - it's worth considering just how low the SP500 could go. If the index breaks below the 6710.67 support level, the next target would be 6663.53. A break below that level would signal a significant correction and could potentially open the door to even lower prices. However, it's important to remember that markets rarely move in a straight line. There will likely be periods of consolidation and potential rallies along the way.
The Bull Case: A Potential Reversal?
Despite the bearish outlook, it's not all doom and gloom. The SP500 could still stage a reversal if certain conditions are met. First, inflation data would need to come in lower than expected, easing fears of aggressive Fed rate hikes. Second, geopolitical tensions would need to de-escalate, reducing risk aversion. And third, the dollar would need to weaken, providing a tailwind for equities. However, given the current market dynamics, these scenarios seem less likely. The RSI on the 4-hour chart is at 46.78, indicating there is room for further downside before the index becomes oversold.
What This Means for Traders Right Now
For traders, the current market environment calls for caution. Now this is where it gets interesting! It's time to protect profits and manage risk. The SP500 is at a critical juncture, and the next few days could be decisive. Traders should be prepared for increased volatility and be ready to act quickly if the index breaks below $6,750.40. Patience looks like it will be rewarded here. Manage your risk, wait for your setup- the market always gives a second chance.
Frequently Asked Questions: SP500 Analysis
What happens if SP500 breaks below $6,750.40 support?
If the SP500 breaks below the $6,750.40 support level, the next target would be 6710.67, the S2 level. A break below that level would signal a significant correction and could potentially open the door to even lower prices.
Should I buy SP500 at current levels given RSI at 41.26?
With the RSI at 41.26 on the daily chart, the SP500 is not yet oversold. This suggests that there is still room for further downside momentum. It may be prudent to wait for a more oversold reading or a confirmed reversal before considering a long position.
Is the MACD signal bearish for SP500 trend analysis?
The MACD on the daily chart is showing negative momentum, with the MACD line below the signal line. This confirms the bearish trend and suggests that selling pressure is likely to continue.
How will the upcoming USD data on March 13th affect SP500 this week?
The upcoming USD data releases on March 13th will be a major catalyst for the SP500. Higher-than-expected inflation data could trigger a further sell-off in equities and strengthen the DXY, putting even more pressure on the index.
Manage your risk and protect your capital. The current market environment calls for a defensive strategy. However, with disciplined risk management, these choppy waters can be navigated safely.
Track markets in real-time
AI-powered analysis, technical indicators and real-time price data.
Join Our Telegram Channel
Breaking market news, AI analysis and trading signals instantly.
Join Channel