WTI Bullish Trend Eyes $92.85 Resistance; Trading at $85.05
WTI crude oil is currently trading at $85.05, showing a bullish trend with eyes on the $92.85 resistance level. Will the bulls maintain control amid global supply concerns?
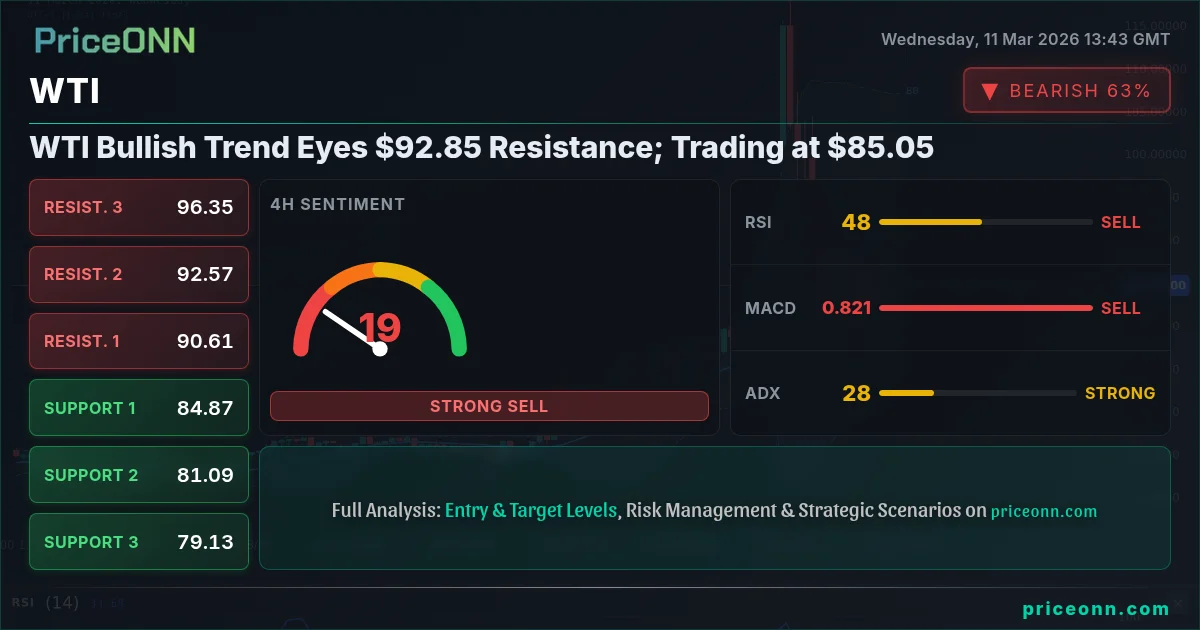
WTI crude oil is currently trading at $85.05, exhibiting a strong bullish trend that has traders eyeing the $92.85 resistance level. The market is closely watching whether the bulls can sustain this momentum, especially amid ongoing geopolitical tensions and potential supply disruptions. The recent dip below $85, as reported by various news outlets, was quickly bought up, indicating underlying strength. This analysis delves into the key levels, technical indicators, and potential trade scenarios for WTI, providing insights for various types of traders.
- RSI at 72.09 signals overbought conditions on the daily timeframe, suggesting potential for a near-term pullback.
- Key resistance lies at $92.85, a break above which could trigger further upside towards $99.41.
- ADX at 45.36 indicates a strong uptrend on the daily chart, supporting the bullish bias.
- Geopolitical tensions in the Middle East and potential supply disruptions are key drivers of WTI's price action.
Technical Overview: WTI's Bullish Momentum
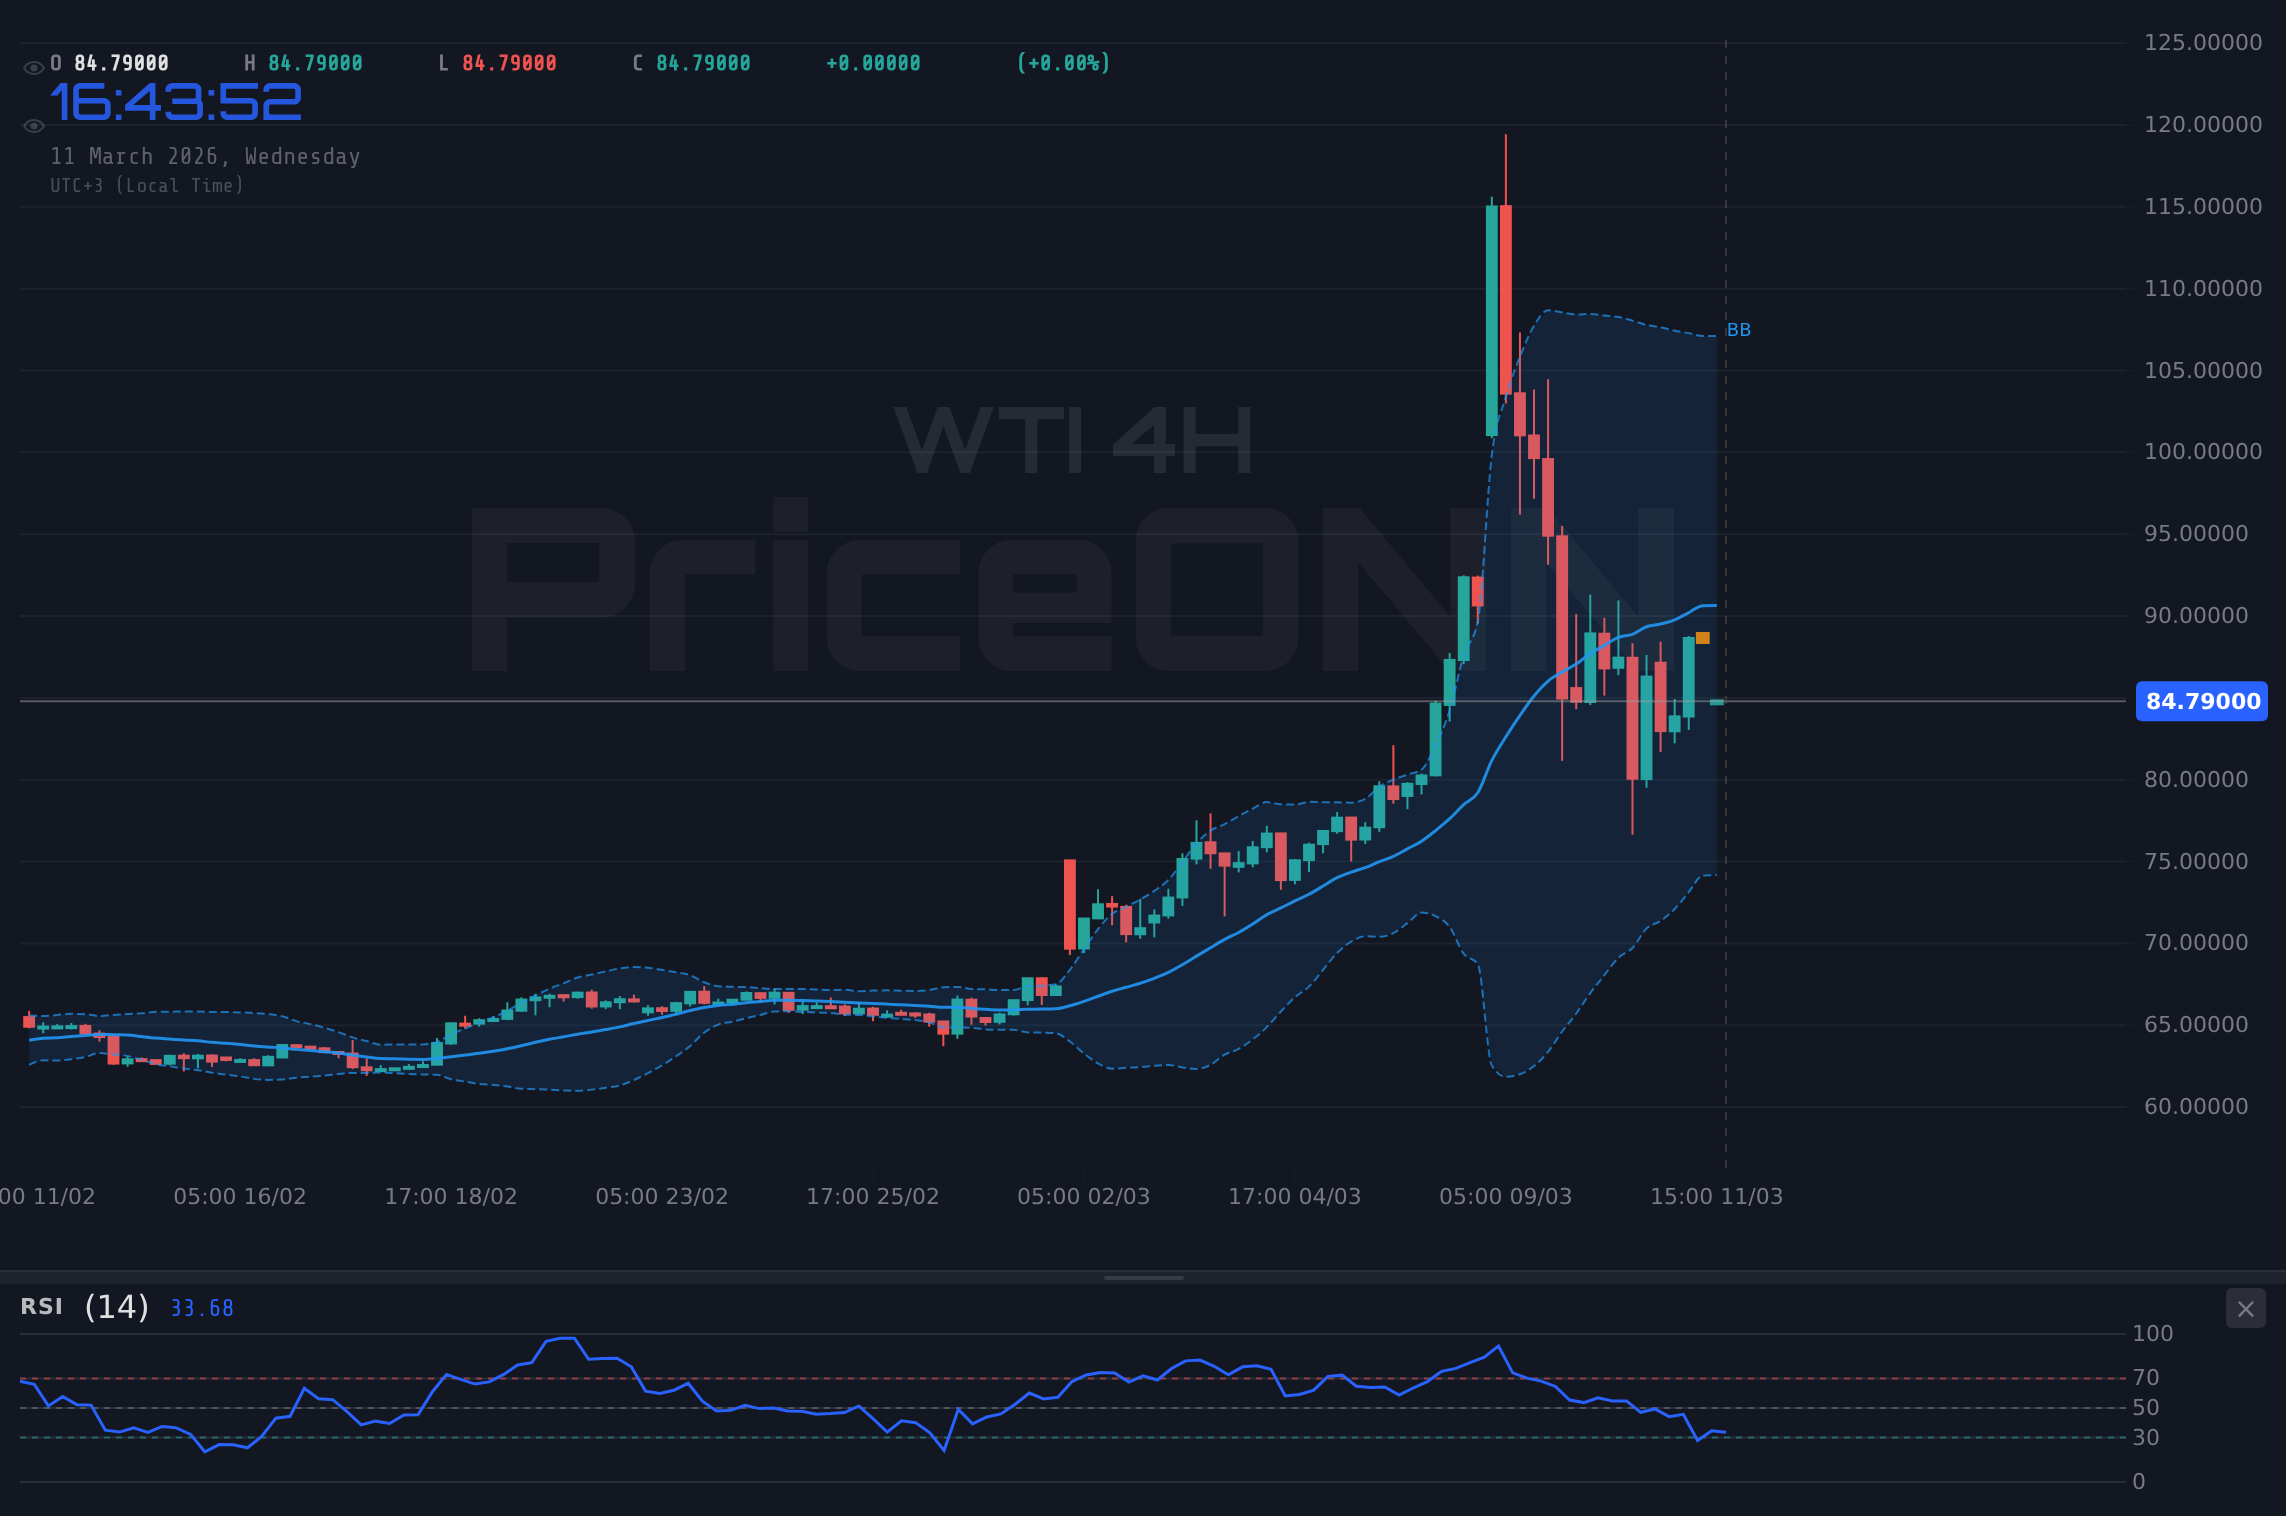
The technical picture for WTI crude oil is predominantly bullish, particularly when considering the daily and 4-hour timeframes. On the daily chart, the ADX (Average Directional Index) stands at 45.36, indicating a strong uptrend. This suggests that the current bullish momentum is likely to persist. However, the RSI (Relative Strength Index) at 72.09 is in overbought territory, which could signal a potential pullback in the near term. Traders should be cautious of this overbought condition and watch for signs of reversal. The MACD (Moving Average Convergence Divergence) is also positive, further supporting the bullish outlook, but the stochastic oscillator shows a potential downturn.
Looking at the 4-hour timeframe, the ADX is lower at 30.2, but still indicates a strong trend. The RSI is at 49.62, providing more room for upside movement before reaching overbought levels. The stochastic oscillator shows a potential downturn, which could lead to a short-term correction. The combination of these indicators suggests that while the overall trend is bullish, short-term pullbacks are possible. Scalpers might look to play short-term retracements, while swing traders could wait for a pullback to enter long positions. Long-term investors should remain focused on the broader uptrend.
The 1-hour timeframe presents a more mixed picture. The ADX is at 21.24, indicating a moderate trend. The RSI is at 47.81, suggesting neutral momentum. The stochastic oscillator is showing a potential downturn, suggesting that a short-term correction is possible. This timeframe is most relevant for day traders looking for quick opportunities. It's worth noting that the overall signal for WTI is "AL" (Al: 5, Sat: 2, Nötr: 0), reinforcing the bullish sentiment.
Key Levels to Watch: Support and Resistance
Identifying key support and resistance levels is crucial for traders to make informed decisions. Based on the current market data, the immediate support level for WTI is at $85.03 (1H timeframe). A break below this level could lead to further downside towards $83.50. On the upside, the immediate resistance level is at $87.60. A successful break above this level could open the door for a test of the $88.64 and potentially the $90.17 resistance levels.
On the daily timeframe, the key support level to watch is $78.19. This level represents a significant area of demand and could provide a strong bounce if tested. The resistance levels on the daily timeframe are $92.85, $99.41 and $107.51. These levels represent potential areas of supply and could act as barriers to further upside movement. It's important to note that these levels are derived from the provided market data and reflect the current market conditions. Traders should adjust their strategies accordingly based on these levels.
Bullish Scenario: Road to $92.85
The primary bullish scenario for WTI crude oil involves a sustained move above the immediate resistance level of $87.60. If WTI can successfully break above this level, it could trigger a rally towards the $92.85 resistance level on the daily timeframe. This scenario is supported by the strong uptrend indicated by the ADX and the positive MACD on the daily chart. The key catalyst for this scenario would be a further escalation of geopolitical tensions in the Middle East or a significant disruption to global oil supply. The IEA's potential release of oil reserves could act as a temporary headwind, but the underlying bullish momentum is likely to persist if supply concerns remain elevated.
For swing traders, a pullback towards the $83.50 support level could present a buying opportunity, with a stop-loss placed below this level to manage risk. The initial target would be the $87.60 resistance, followed by the $92.85 level. Long-term investors should remain focused on the broader uptrend and consider adding to their positions on pullbacks. Remember, patience looks like it will be rewarded here. For scalpers, playing short-term retracements could be profitable, but requires careful risk management and close monitoring of price action.
Bearish Scenario: Downside Risk to $82.46
The bearish scenario for WTI crude oil involves a break below the immediate support level of $85.03. If WTI fails to hold above this level, it could trigger a sell-off towards the $82.46 support level on the 1H timeframe. This scenario would be supported by a weakening of the bullish momentum and a deterioration of the technical picture. The key catalyst for this scenario would be a significant easing of geopolitical tensions or a surprise increase in global oil supply. Furthermore, a strengthening US dollar, as indicated by the DXY, could put downward pressure on WTI prices.
For swing traders, a break below the $83.50 support level could present a shorting opportunity, with a stop-loss placed above this level to manage risk. The initial target would be the $82.46 support, followed by lower levels if the sell-off intensifies. Long-term investors should consider reducing their exposure if the bearish scenario unfolds. Manage your risk, wait for your setup- the market always gives a second chance. Scalpers could look to play short-term bounces and retracements within the downtrend.
Range-Bound Scenario: The Waiting Game Between $83.50 and $87.60
The range-bound scenario for WTI crude oil involves price action consolidating between the $83.50 support and the $87.60 resistance levels. In this scenario, WTI would lack a clear directional bias, and traders would need to adopt a more neutral strategy. The key drivers for this scenario would be a combination of offsetting factors, such as geopolitical tensions and supply disruptions balancing out against increased production and weaker demand. The ADX would likely remain below 25, indicating a lack of strong trend.
For swing traders, a range-bound scenario would require a more patient approach. Traders could look to buy near the $83.50 support and sell near the $87.60 resistance, but with tight stop-losses to manage risk. Long-term investors should remain on the sidelines, waiting for a clear breakout or breakdown to establish a more directional bias. Patience looks like it will be rewarded here. Scalpers could focus on playing short-term bounces and retracements within the range, but with even tighter stop-losses to account for the increased volatility.
What I'm Watching: Key Triggers This Week
Several key triggers could influence WTI's price action this week. Firstly, the upcoming economic data releases from the US, including the producer price index is due Wednesday, March 11, which will provide further insights into the state of the economy and potential implications for oil demand. Secondly, any further developments regarding geopolitical tensions in the Middle East could have a significant impact on oil supply and prices. Finally, the direction of the US dollar, as indicated by the DXY, will continue to play a role in WTI's price action. A stronger dollar could put downward pressure on WTI, while a weaker dollar could provide support. Look, this level is absolutely critical-
With the DXY at 98.87, there is potential for increased downward pressure on WTI. The inverse correlation between the dollar index and crude oil prices means that as the dollar strengthens, oil becomes more expensive for buyers using other currencies, potentially dampening demand. The CAD/JPY news highlighting the Bank of Canada and Bank of Japan's policies is also noteworthy, as currency fluctuations can impact commodity prices. Having tracked WTI through the 2024 rate cycle, I can say that the impact of monetary policy decisions on oil prices has been significant.
IF WTI breaks and holds above $87.60 resistance (1H timeframe), THEN target $92.85 (daily resistance) within the next 1-2 weeks. Confirmation: Strong ADX reading and positive MACD signal.
IF WTI breaks below $85.03 support (1H timeframe), THEN target $82.46 (1H support) within the next 3-5 days. Confirmation: Weakening ADX and negative MACD signal.
Technical Outlook Summary
| Indicator | Value | Signal |
|---|---|---|
| RSI (14) | 59.95 | Neutral |
| MACD Histogram | Positive | Bullish |
| Stochastic | 42.03 | Bullish |
| ADX | 21.24 | Weak Trend |
| Bollinger | Upper Band | Watch |
Key Levels
Support Levels
Resistance Levels
Frequently Asked Questions: WTI Analysis
What happens if WTI breaks above $87.60 resistance?
If WTI breaks above the $87.60 resistance level, it could trigger a rally towards the $92.85 resistance on the daily timeframe. This scenario is supported by the strong uptrend indicated by the ADX at 45.36 and the positive MACD signal.
Should I buy WTI at current levels of $85.05 given the RSI at 72.09?
While the overall trend is bullish, the RSI at 72.09 indicates overbought conditions, which could signal a potential pullback in the near term. Traders should exercise caution and wait for a pullback towards support before entering long positions to manage risk.
Is the positive MACD signal a reliable indicator for WTI trend analysis?
The positive MACD signal supports the bullish outlook, but it should be used in conjunction with other indicators and price action analysis. The ADX helps confirm the strength of the trend, while the RSI can provide insights into potential overbought or oversold conditions.
How will the upcoming producer price index affect WTI this week?
The upcoming producer price index will provide further insights into the state of the economy and potential implications for oil demand. Stronger-than-expected data could support WTI prices, while weaker-than-expected data could put downward pressure on WTI.
⚠️ Risk Warning: Trading crude oil involves substantial risk of loss and is not suitable for all investors. Past performance is not indicative of future results. Conduct thorough research and seek professional advice before making any investment decisions.
Track markets in real-time
AI-powered analysis, technical indicators and real-time price data.
Join Our Telegram Channel
Breaking market news, AI analysis and trading signals instantly.
Join Channel