As geopolitical tensions in the Middle East show signs of easing, USDJPY finds itself testing resistance near $158.49. The pair's trajectory hinges on risk sentiment and the potential unwinding of safe-haven flows into the Japanese Yen.
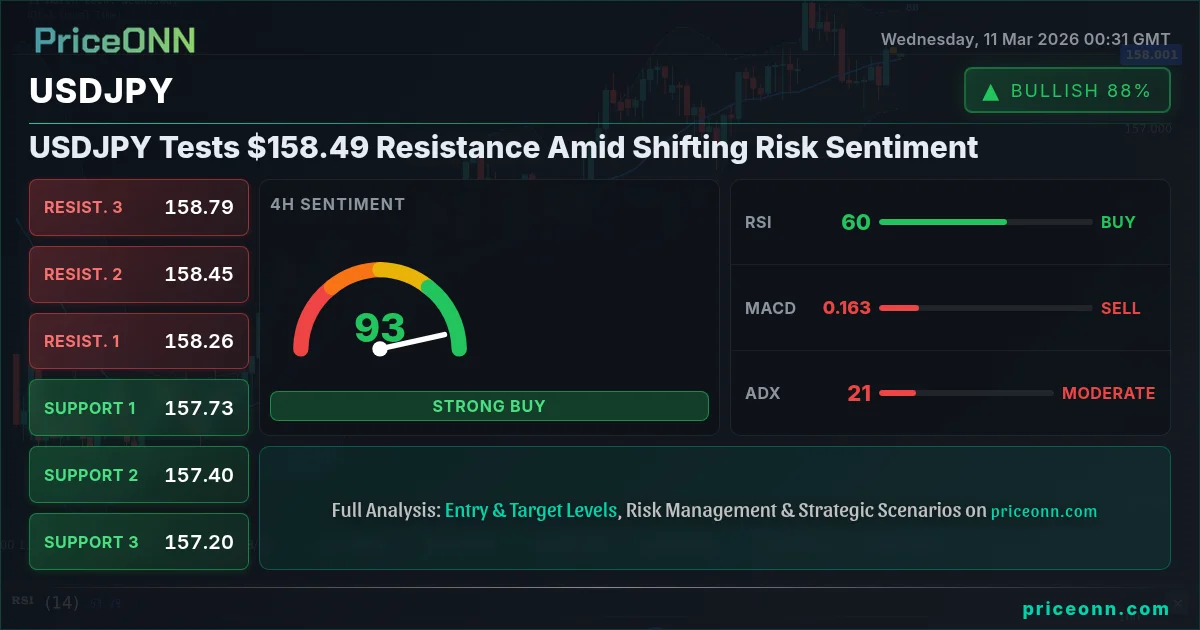
- USDJPY is testing resistance at $158.49, a key level to watch for a potential breakout or reversal.
- Stochastic at 76.87 on the daily chart suggests overbought conditions, signaling a possible pullback.
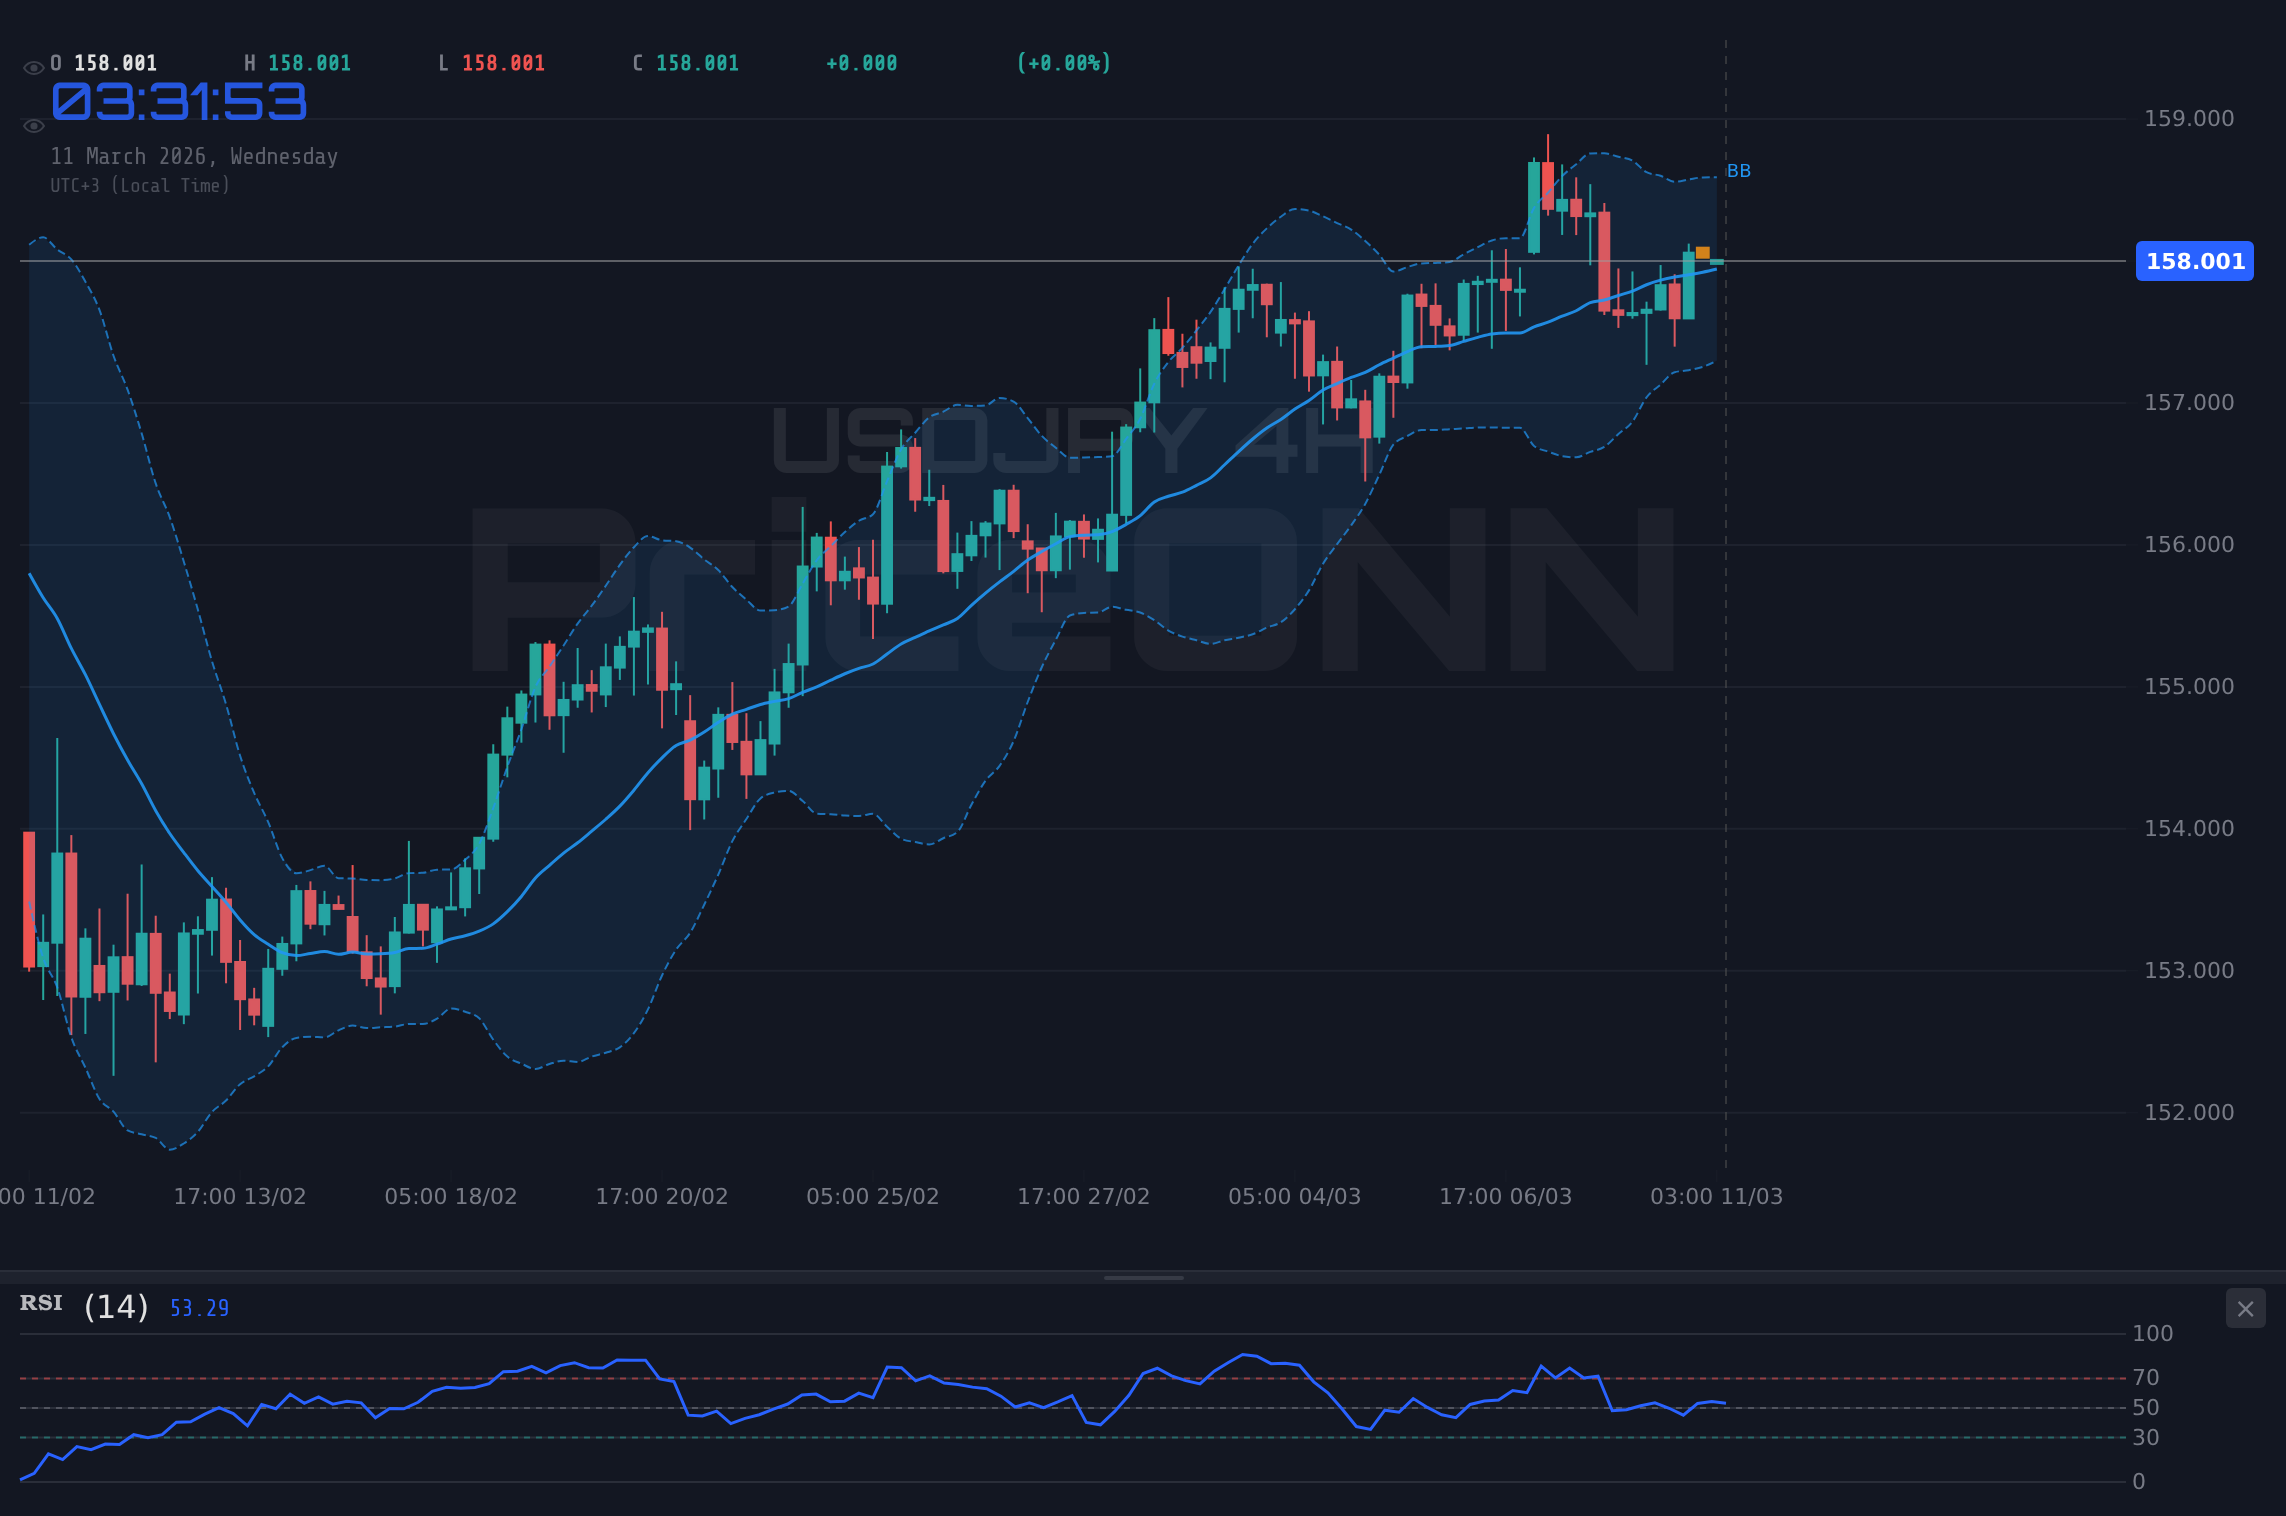
- The 4-hour chart shows support at 157.36, which must hold to maintain bullish momentum.
- DXY at 98.60 indicates underlying dollar strength, influencing USDJPY price action.
The initial risk-off sentiment fueled by escalating tensions had driven investors towards safe-haven assets like the Yen. However, with news suggesting a potential de-escalation, the demand for havens may wane, impacting USDJPY. The recent oil price volatility, as reported by energy sources, further complicates the outlook, as fluctuating prices influence risk appetite and currency valuations.
USDJPY's price action is intrinsically linked to broader market dynamics. The Dollar Index (DXY), currently at 98.6, plays a crucial role. A strengthening dollar, as indicated by the DXY's 0.23% daily increase, often puts pressure on other currencies, including the Yen. However, the easing of geopolitical tensions could temper this effect, creating a tug-of-war scenario for USDJPY.
From a technical perspective, USDJPY's hourly chart displays a neutral trend, with the RSI at 54.4. The MACD is showing positive momentum above the signal line, and the price is above the moving average. This suggests a potential for continued upward movement. However, traders should be cautious, as the ADX is only 17.35, indicating a weak trend. A daily close above $158.49 would confirm the breakout, opening the door for a test of the next resistance level at $159.329.
The 4-hour timeframe presents a slightly different picture. While the RSI is at 55.88, the Stochastic is at 37.81, signaling a potential reversal from the overbought zone. The ADX is at 21.47, showing a moderate uptrend. The support level to watch is 157.36, which coincides with the 4H support.
Zooming out to the daily chart, USDJPY shows a neutral trend. The RSI at 62.36 is not yet in overbought territory, leaving room for further upside. The Stochastic, however, is signaling a potential pullback with K=76.87 and D=84.42. The key resistance to monitor is at 158.49, while support lies at 157.216.
The economic calendar also plays a pivotal role. The upcoming GBP data on Friday, March 13, will be closely watched to assess the UK's economic health. This data could indirectly influence USDJPY, as changes in GBPUSD could ripple through other currency pairs. Additionally, the USD data on Friday, March 13, will provide insights into the US economy, potentially impacting the dollar's strength and USDJPY's direction.
Traders should also monitor the SP500 and Nasdaq100 indices. The SP500 is currently at 6804.45, while the Nasdaq100 is at 25048.82. A risk-on environment, characterized by rising equity markets, tends to weaken the Yen, pushing USDJPY higher. Conversely, a risk-off environment strengthens the Yen, potentially leading to a USDJPY pullback. The current trend is upwards, as both SP500 and Nasdaq100 have been bullish. However, the Stochastics for both SP500 and Nasdaq100 are in overbought territory, suggesting a possible correction.
For scalpers, the hourly chart is most relevant. A break above the immediate resistance at 158.207 could present short-term buying opportunities. However, the weak trend indicated by the ADX warrants caution. Swing traders should focus on the 4-hour chart, waiting for a clear break above 158.144 or a pullback to the support at 157.36 before making a decision. Long-term investors should analyze the daily chart, considering the broader economic outlook and central bank policies.
The easing of geopolitical tensions is a double-edged sword for USDJPY. While it reduces the demand for safe-haven assets, it also boosts risk appetite, potentially weakening the Yen. The key is to monitor the DXY, equity markets, and economic data releases to gauge the overall market sentiment. Until the market establishes a clear direction, caution is warranted. A daily close above $158.49 would open the door for a test of the next resistance level at $159.329.
Brent crude oil is currently at $65.73, showing a 1.96% increase, which may affect inflation expectations. The energy market is closely correlated to USDJPY. An increase in energy prices may lead to higher inflation, which may lead to monetary policy changes, such as interest rate hikes. Currently, the RSI is at 71.16, indicating overbought conditions. The key level to watch is $66.36, which is the resistance on the daily chart. On the other hand, WTI crude oil is at $83.04, showing a 2.26% decrease. The RSI is at 41.65, indicating that it is neither overbought nor oversold. The two energy markets send mixed signals, and traders should exercise caution.
Frequently Asked Questions: USDJPY Analysis
What happens if USDJPY breaks above $158.49 resistance?
A break above the $158.49 resistance level could signal a continuation of the upward trend, potentially leading to a test of the next resistance at $159.329. This scenario is further supported by the DXY's strength at 98.60, indicating underlying dollar strength. However, the weak trend (ADX at 17.35) warrants caution.
Should I buy USDJPY at current levels of $158.01 given the Stochastic signal?
The Stochastic on the daily chart is signaling a potential pullback with K=76.87 and D=84.42. This suggests that the pair might be overbought in the short term, and a pullback to support at 157.216 is possible before further upside. Therefore, traders may want to wait for a pullback before initiating a long position.
Is RSI at 62.36 a sell signal for USDJPY right now?
With the RSI at 62.36 on the daily chart, USDJPY is not yet in overbought territory, leaving room for further upside. However, traders should be cautious, as the Stochastic is signaling a potential pullback. Therefore, traders may want to wait for a pullback before initiating a long position.
How will the upcoming USD data on March 13 affect USDJPY this week?
The upcoming USD data on March 13 will provide insights into the US economy, potentially impacting the dollar's strength and USDJPY's direction. Positive data could strengthen the dollar, pushing USDJPY higher, while negative data could weaken the dollar, leading to a USDJPY pullback. Traders should monitor the data closely.
Ultimately, USDJPY's next move depends on a complex interplay of factors. Monitor the key levels, watch the economic data, and manage risk responsibly. The market always offers new opportunities.
Technical Outlook Summary
| Indicator | Value | Signal |
|---|---|---|
| RSI (14) | 54.4 | Neutral |
| MACD Histogram | Positive | Bullish |
| Stochastic | 76.87 | Bearish |
| ADX | 17.35 | Weak Trend |
| Bollinger | Middle Band | Watch |
Key Levels
Support Levels
Resistance Levels
Track markets in real-time
AI-powered analysis, technical indicators and real-time price data.
Join Our Telegram Channel
Breaking market news, AI analysis and trading signals instantly.
Join Channel