Brent Crude Eyes $97.48 Resistance After Jump Above $92.36
Brent crude oil jumps above $92.36 amid supply concerns. Can the bullish run continue to test $97.48 resistance?
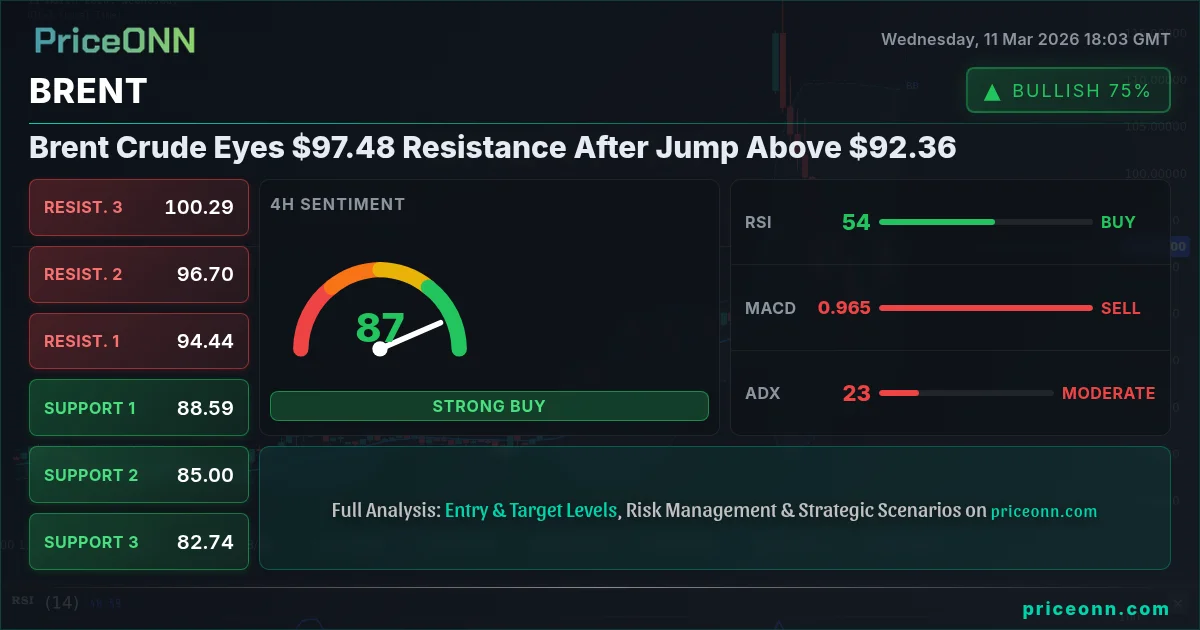
Brent crude has been on a bullish run, currently trading at $92.36, and is eyeing the $97.48 resistance level. The question is whether this momentum can be sustained amid a complex interplay of supply concerns and broader market sentiment.
- RSI at 85.84 on the daily chart indicates potential overbought conditions.
- Key resistance level to watch is $97.48, a break above which could signal further upside.
- ADX at 46.54 suggests a strong uptrend on the daily timeframe, supporting the bullish momentum.
- Brent's correlation with DXY needs close monitoring as dollar strength could cap gains.
Having tracked Brent crude through multiple economic cycles, I can say with some confidence that the current market dynamics are particularly intriguing. The surge above $91 a barrel, as reported by Reuters, was primarily fueled by supply disruption fears, specifically those emanating from the Strait of Hormuz. This geopolitical tension has overshadowed reports of the International Energy Agency (IEA) considering a reserve release, which would typically exert downward pressure on prices. This unusual divergence highlights the market's acute sensitivity to supply-side risks.
Technical Analysis: Setting the Stage for $97.48?
From a technical perspective, the daily chart paints a picture of a strong uptrend. The ADX, a measure of trend strength, sits at a robust 46.54, indicating that the bullish momentum is not to be taken lightly. However, the RSI is flashing a warning sign. At 85.84, it's well into overbought territory, suggesting that the market may be due for a pullback. This is where the nuances of multi-timeframe analysis come into play. While the daily chart shows strength, the 1-hour and 4-hour charts offer a more granular view.
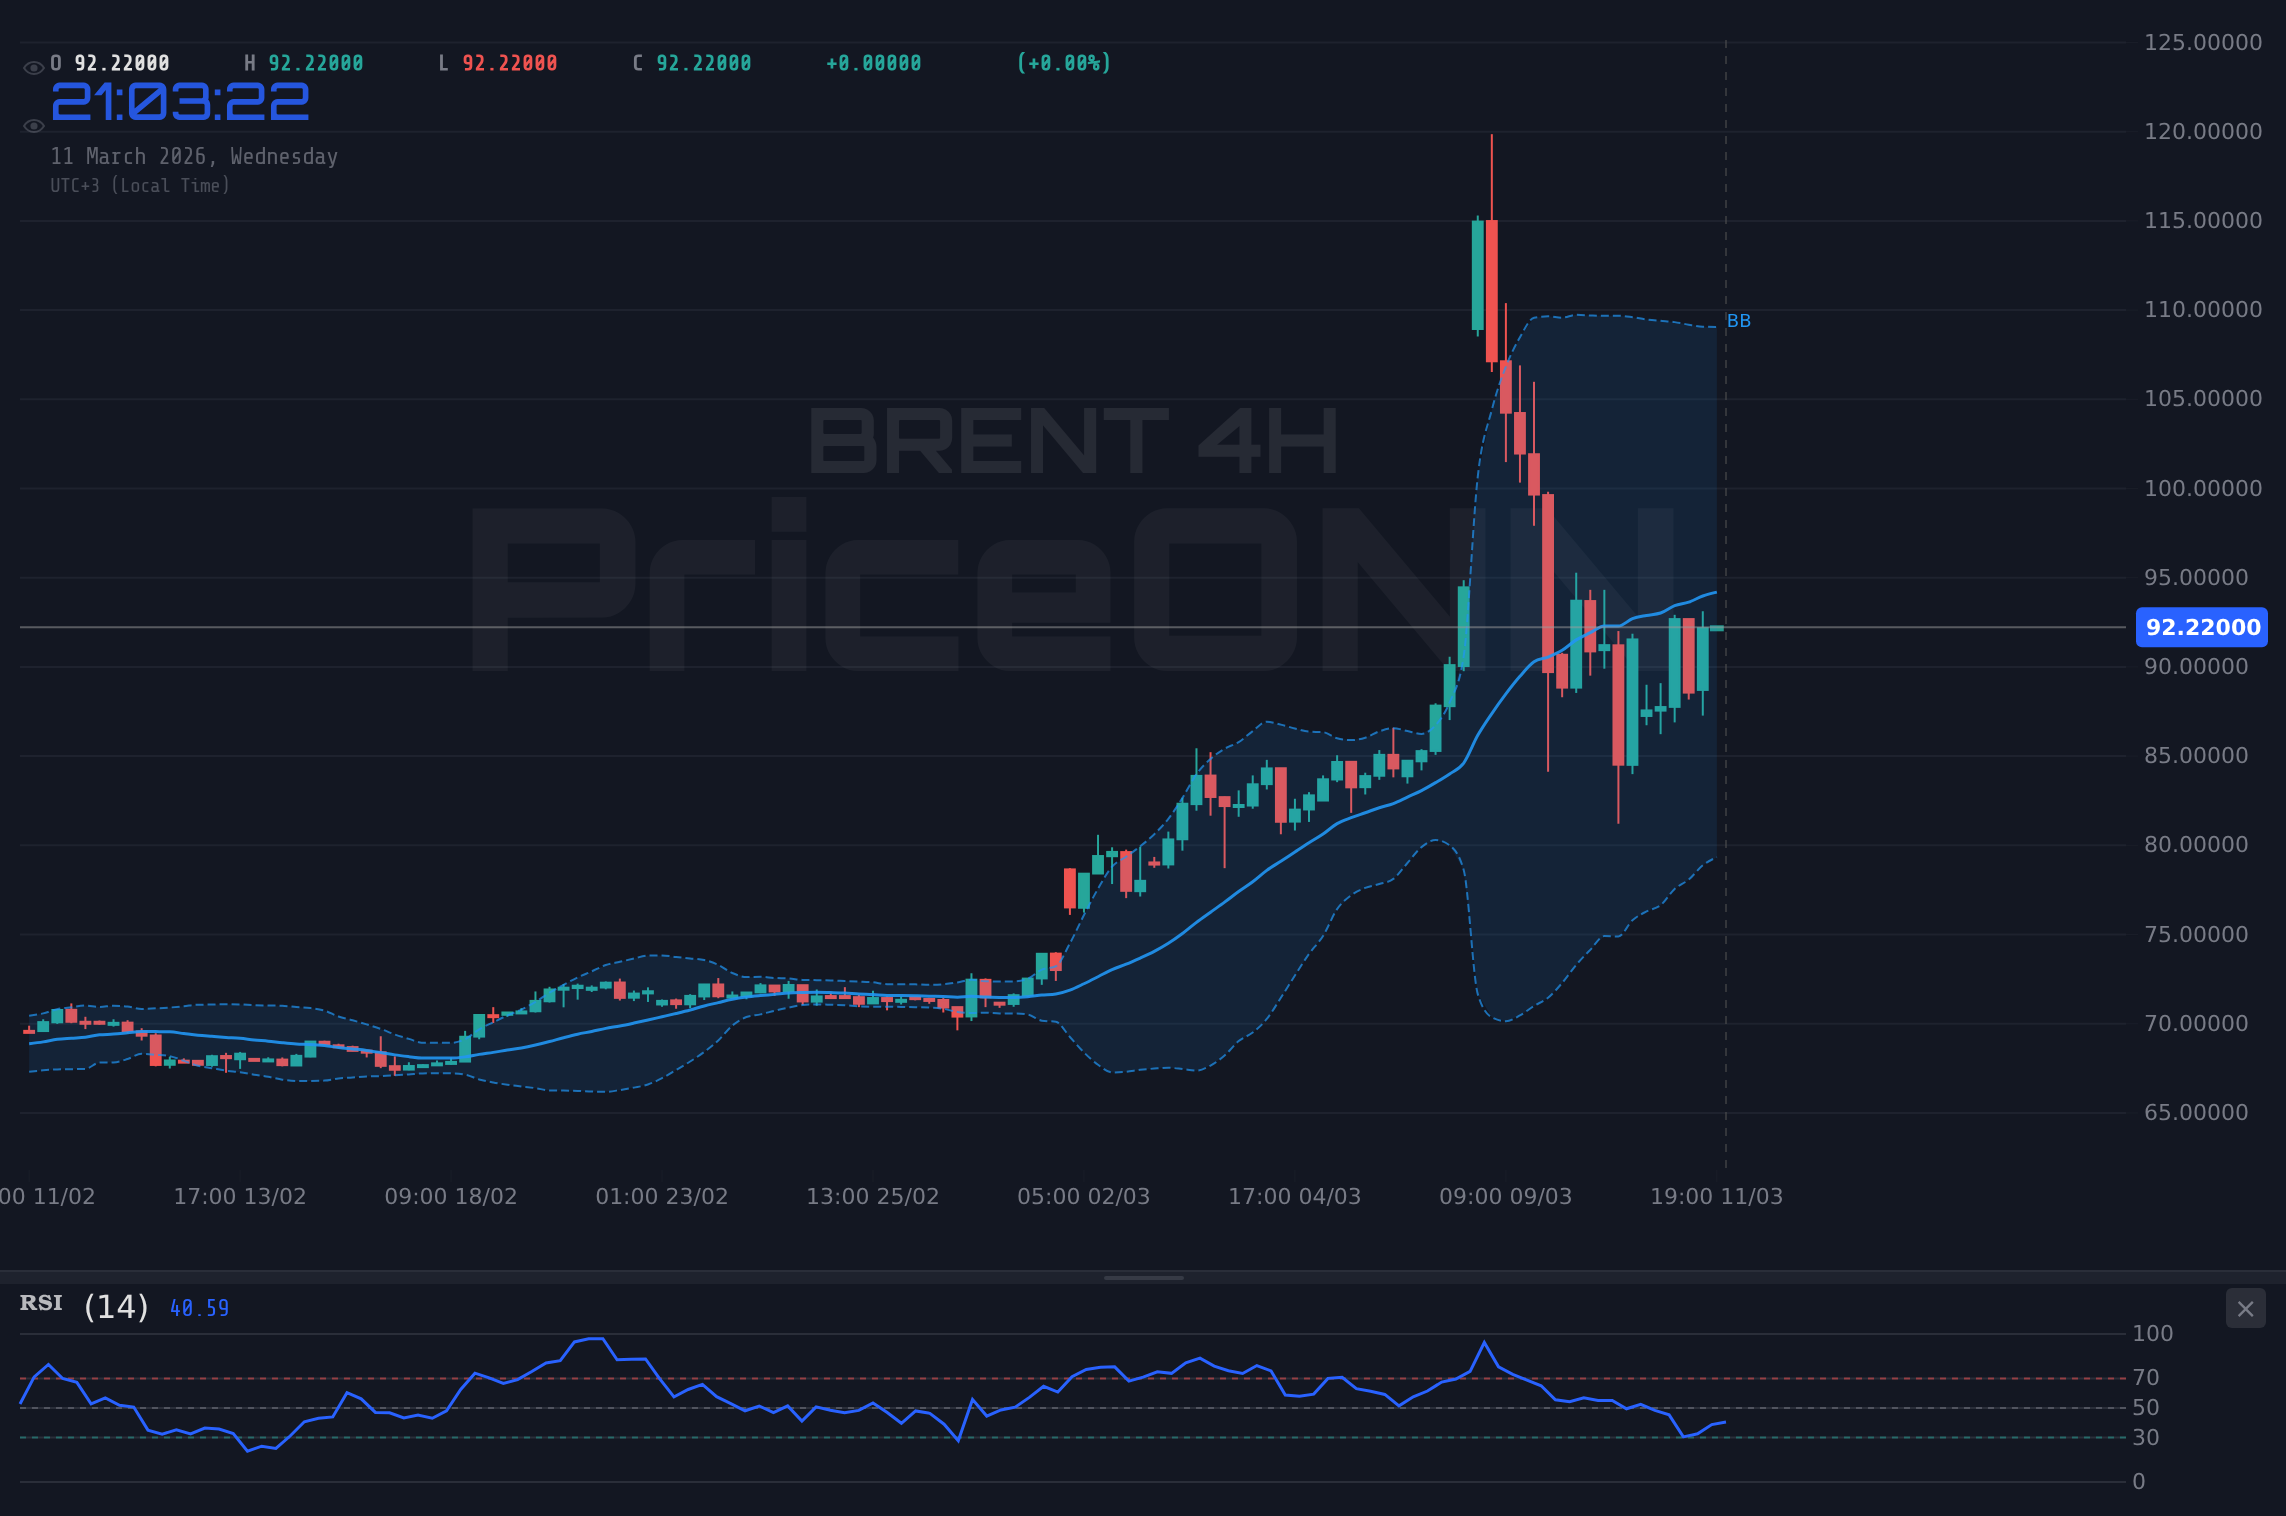
On the 1-hour chart, the trend is neutral, with ADX at 25.36, revealing a weakening of the short-term bullish impulse. The RSI is at 53.98, in neutral territory. This suggests a possible consolidation phase before the next leg up. Key support on this timeframe lies at $91.35, a level that bulls will want to defend to maintain upward momentum. Resistance is observed at $92.80. The 4-hour chart presents a similar picture, with a neutral trend, ADX at 23.97, and RSI at 52.53. Support here is at $86.93, while resistance is at $91.44. It's worth noting that the Stochastic indicator on both the 1-hour and 4-hour charts is signaling a buy, suggesting that the pullback may be short-lived.
The $97.48 resistance level is significant for several reasons. It represents a key level from which previous rallies have been rejected. A sustained break above this level would likely attract further buying interest and could pave the way for a test of higher targets, potentially around $103.41. However, failure to break above $97.48 could lead to a deeper correction, with initial support around $83.41.
Fundamental Drivers: More Than Just Supply Fears
While supply disruption fears are currently dominating the narrative, several other fundamental drivers are at play. The strength of the US dollar, as measured by the DXY, is a critical factor. With the DXY currently at 98.98 and showing a strong uptrend, Brent crude faces headwinds. A stronger dollar typically makes commodities priced in dollars more expensive for international buyers, potentially dampening demand. It's worth noting that the EUR/USD is currently trading at 1.15707, showing a bearish trend, which further supports the dollar's strength.
Inflation expectations also play a significant role. Oil is often seen as a hedge against inflation, so rising inflation expectations can boost prices. However, with the Federal Reserve signaling a commitment to fighting inflation through potential interest rate hikes, the outlook for inflation remains uncertain. This uncertainty is reflected in the cautious trading of gold, which is hovering near $5,171.2 as markets await critical US inflation data.
According to Bloomberg data, China continues to increase its gold reserves. This indicates a potential shift away from the dollar and could support commodity prices in the long run. The upcoming high-impact event for EUR on Wednesday, March 11, along with high-impact USD events also on Wednesday, March 11, and Friday, March 13, will provide further clues about the direction of monetary policy and inflation expectations.
Bullish vs. Bearish Scenarios: A High-Stakes Game
The bullish scenario hinges on a sustained break above the $97.48 resistance level. If this occurs, we could see a rapid move towards $103.41, with the potential for further upside towards $111.55. This scenario is supported by the strong uptrend on the daily chart, as indicated by the ADX, and the potential for supply disruptions to persist. However, the overbought RSI warrants caution, and a pullback should not be ruled out.
The bearish scenario would involve a failure to break above $97.48, followed by a break below the $83.41 support level. This would likely trigger a deeper correction, with potential targets around $75.27 and $69.34. This scenario is supported by the overbought RSI, the strength of the US dollar, and the potential for the IEA to release reserves.
Risk Management: Navigating the Choppy Waters
Given the conflicting signals, risk management is paramount. Traders should avoid excessive leverage and be prepared to adjust their positions based on market developments. A stop-loss order should be placed below the $83.41 support level to protect against a deeper correction. The position size should be determined based on risk tolerance and account size.
For scalpers, the focus should be on short-term price action and key support and resistance levels. Swing traders should monitor the daily chart for confirmation of the uptrend or a potential reversal. Long-term investors should focus on the fundamental drivers and be prepared to weather short-term volatility.
Trade Recommendation: Watch Zone
Given the ADX at 23.97 indicating a moderate trend, partial indicator alignment, and Stochastic in an extreme zone, the recommendation is to remain in a watch zone. A daily close above $97.48 would open the door for a test of higher targets, potentially around $103.41 and $111.55. This condition would create a valid setup for a long position.
Frequently Asked Questions: BRENT Analysis
What happens if BRENT breaks above $97.48 resistance?
A sustained break above the $97.48 resistance level could trigger a rapid move towards $103.41, with the potential for further upside towards $111.55, as this level represents a key level from which previous rallies have been rejected.
Should I buy BRENT at current levels of $92.36 given RSI at 85.84?
Given the overbought RSI on the daily chart, caution is warranted. It may be prudent to wait for a pullback before initiating a long position, or to use a smaller position size to manage risk.
Is RSI at 85.84 a sell signal for BRENT right now?
While an RSI of 85.84 indicates overbought conditions, it is not necessarily a sell signal in isolation. It suggests that the market may be due for a pullback, but the uptrend remains intact as long as key support levels hold.
How will the high impact USD event on March 13 affect BRENT this week?
The high impact USD event on March 13 could influence the dollar's strength, which in turn could impact Brent crude. A stronger dollar could exert downward pressure on prices, while a weaker dollar could provide support.
Track markets in real-time
AI-powered analysis, technical indicators and real-time price data.
Join Our Telegram Channel
Breaking market news, AI analysis and trading signals instantly.
Join Channel