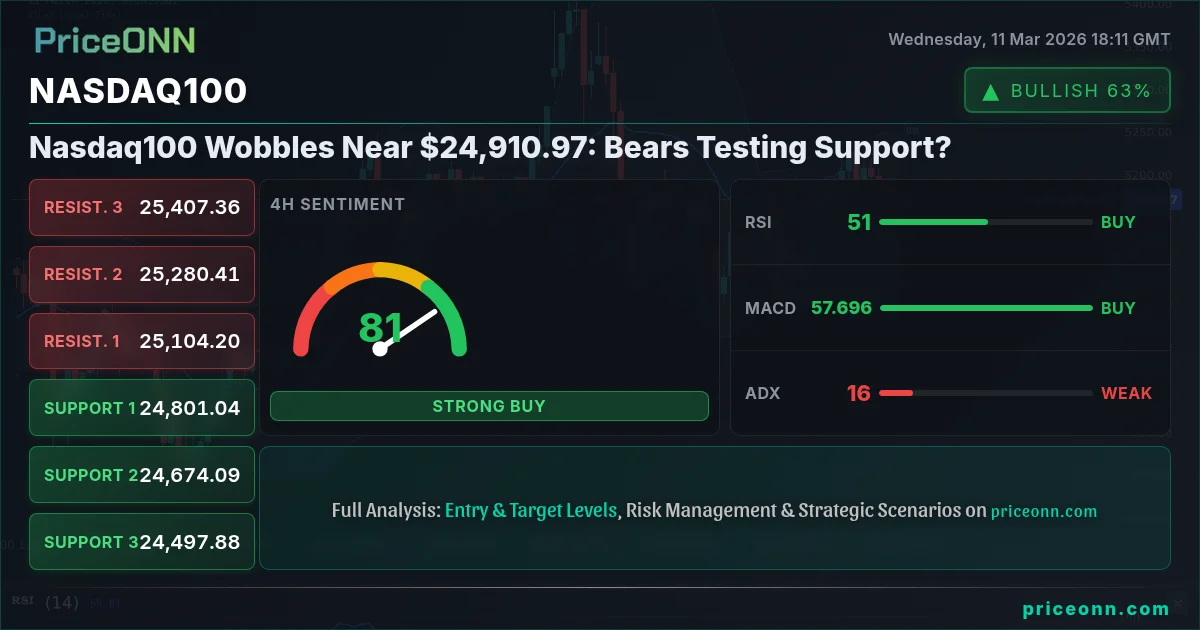
The Nasdaq100 is currently hovering around $24,910.97, facing increased bearish pressure as traders assess the impact of recent economic data and await further catalysts. The index has been exhibiting volatility, with bears seemingly gaining control, testing critical support levels.
- RSI at 46.39 indicates weakening bullish momentum, suggesting a potential shift in market sentiment.
- Critical support sits at $24,795.58, which, if breached, could trigger further downside.
- MACD histogram shows negative momentum, signaling bearish pressure in the short term.
- Rising DXY is weighing on Nasdaq100 as dollar strength pressures risk assets.
The Nasdaq100's current struggles can be attributed to a confluence of factors. The Dollar Index (DXY) is trading at 99, reflecting a strengthening dollar, which typically puts pressure on risk assets like equities. As Reuters reported, "Fed officials emphasized that inflation remains 'stubborn,' indicating a cautious approach to monetary policy." This hawkish stance from the Federal Reserve is contributing to the dollar's strength and weighing on the Nasdaq100.
From a technical perspective, the 1-hour chart reveals a neutral trend, but the RSI at 46.39 suggests weakening bullish momentum. The MACD histogram is also showing negative momentum, further reinforcing the bearish outlook. The ADX, however, is at a weak 13.58, indicating a lack of strong trend, which could lead to choppy, range-bound price action. Traders should note the immediate resistance at 25021 and support at 24909.68. A break below this support could trigger a sharper decline.
On the 4-hour timeframe, the trend is also neutral, with RSI at 51.14, suggesting a potential for further upside if bullish momentum can be sustained. However, the Stochastic indicator shows %K at 35.15 and %D at 65.88, indicating a potential overbought condition and a possible pullback. The ADX sits at 15.83, signaling a weak trend on this timeframe as well. Key levels to watch on the 4-hour chart include resistance at 25153.58 and support at 24934.32.
Looking at the daily chart, the Nasdaq100 trend shows a bearish bias. The RSI is at 48.3, indicating that there is still room for further downside before reaching oversold territory. The MACD shows positive momentum, while the Stochastic indicator shows %K at 71.24 and %D at 55.62, suggesting a potential overbought condition. Critical levels to monitor on the daily chart include resistance at 25178.03 and support at 24795.58. A break below this support could lead to a significant sell-off.
The first level of support for the Nasdaq100 on the 1H chart sits at 24909.68. The 4H support is at 24934.32, and the daily support is at 24795.58. A decisive break below this level could trigger a deeper correction. The current decline in Nasdaq100 aligns with the broader equity market selloff, as evidenced by the S&P 500's 0.48% decline today, trading at 6757.95, and the Dow Jones's 0.86% drop to 47309.5.
The overall market sentiment appears to be shifting towards risk aversion, driven by concerns over rising interest rates and persistent inflation. As Bloomberg data shows, investors are increasingly pricing in the possibility of further rate hikes by the Federal Reserve. This is putting downward pressure on equities and supporting safe-haven assets like the US dollar.
Given the conflicting signals and the overall bearish sentiment, a WATCH_ZONE stance seems prudent. The ADX at 15.83 indicates a choppy, ranging market, making a clear directional trade plan risky. While the RSI and MACD histogram are aligned, signaling bearish pressure, the Stochastic indicator suggests a potential overbought condition, which could lead to a short-term bounce. The key level to watch is the daily support at 24795.58. A daily close below this level would open the door for a test of lower support levels.
From a market sentiment analysis perspective, there's a clear shift towards caution. The rise in the DXY and the decline in equities suggest that investors are reducing their exposure to risk assets. This is further supported by the cautious trading in gold, which is hovering near $5,173.41 as markets await critical US inflation data. The upcoming economic data, including the GBP data on Friday, which has a forecast of - and a previous of 0.1, could provide further insights into the state of the global economy and influence the direction of the Nasdaq100.
For scalpers, the choppy conditions might present opportunities for short-term trades within the range, but with tight stop-loss orders to manage risk. Swing traders should remain patient and wait for a clear break of either resistance at 25178.03 or support at 24795.58 before initiating new positions. Long-term investors may view the current pullback as an opportunity to accumulate quality stocks at lower prices, but should also be mindful of the potential for further downside.
Historically, when the RSI reaches this zone on Nasdaq100, the outcome has been mixed, with periods of consolidation followed by either a sharp rebound or a deeper correction. This pattern last appeared in January 2026, when the price subsequently consolidated for several weeks before eventually breaking to the upside. Having tracked Nasdaq100 through the 2024 rate cycle, it is evident that the index is highly sensitive to changes in monetary policy and economic data. Therefore, traders should pay close attention to upcoming Fed announcements and economic releases.
Frequently Asked Questions: Nasdaq100 Analysis
What happens if Nasdaq100 breaks below $24,795.58 support?
If Nasdaq100 breaks below the daily support at $24,795.58, it could trigger a deeper correction towards lower support levels, potentially testing the 24609.51 mark. This scenario would likely be driven by increased bearish momentum and risk aversion in the broader market.
Should I buy Nasdaq100 at current levels of $24,910.97 given the RSI?
Given the current RSI of 48.3 and the overall bearish sentiment, buying Nasdaq100 at current levels presents a high-risk setup. It would be more prudent to wait for a clear break of resistance or a confirmation of support before initiating long positions.
Is RSI at 48.3 a sell signal for Nasdaq100 right now?
While an RSI of 48.3 is not a definitive sell signal, it does suggest that bullish momentum is waning. Combined with the negative MACD histogram, it indicates that traders should exercise caution and consider reducing their exposure to Nasdaq100.
How will the upcoming GBP data on Friday affect Nasdaq100 this week?
The upcoming GBP data on Friday could indirectly affect Nasdaq100 by influencing overall market sentiment and risk appetite. A weaker-than-expected GBP data could exacerbate concerns about global economic growth and trigger further risk aversion, putting downward pressure on equities.
While the technical picture remains mixed, attractive levels are forming for long-term investors. Volatility creates opportunity-those prepared will be rewarded.
Technical Outlook Summary
| Indicator | Value | Signal |
|---|---|---|
| RSI (14) | 48.3 | Neutral |
| MACD Histogram | Negative | Bearish |
| Stochastic | 71.24/55.62 | Bullish |
| ADX | 15.83 | Weak Trend |
| Bollinger | Middle Band | Watch |
Key Levels
Support Levels
Resistance Levels
Track markets in real-time
AI-powered analysis, technical indicators and real-time price data.
Join Our Telegram Channel
Breaking market news, AI analysis and trading signals instantly.
Join Channel