

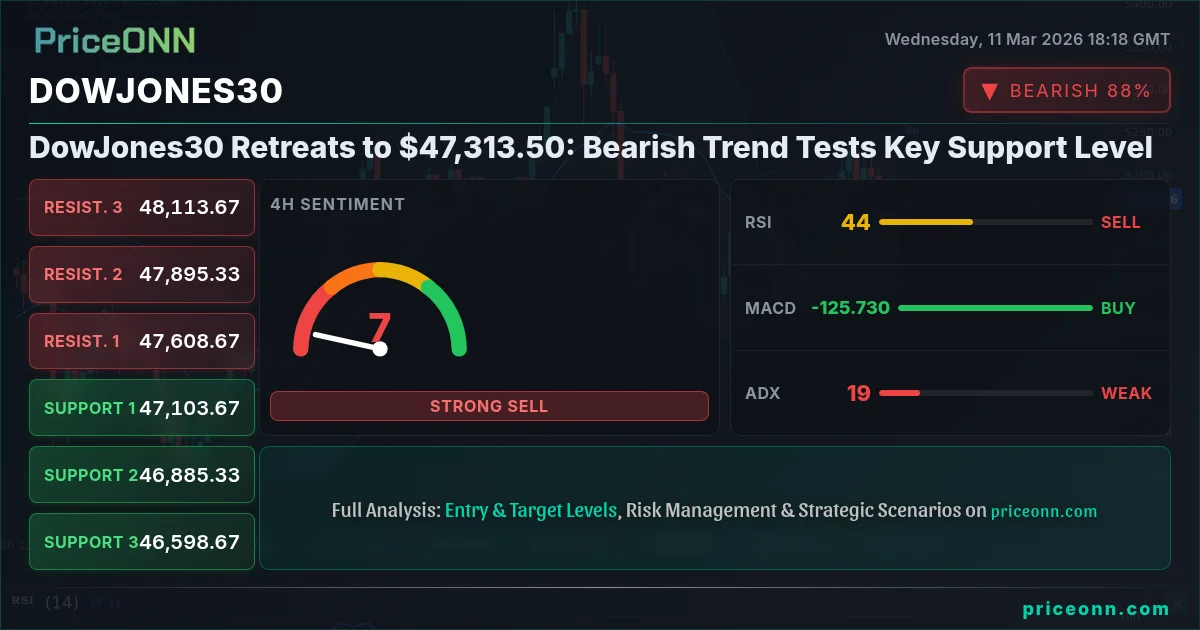
The DowJones30 is currently trading at $47,313.50, a level that is proving to be a critical juncture for the index. The recent bearish trend has intensified, placing significant pressure on this key support level, and sparking concerns among investors about a potential deeper correction. Market participants are closely monitoring upcoming economic data releases and geopolitical developments for clues about the index's next move. The interplay between these factors will likely determine whether the DowJones30 can hold its ground or succumb to further selling pressure.
- RSI at 40.35 on the 1-hour chart signals increasing bearish momentum.
- Critical support level at $47,244.33, a break below which could trigger further downside.
- MACD histogram indicates strengthening negative momentum, suggesting further declines are possible.
- DXY strength is adding pressure to DowJones30, highlighting the inverse correlation between the two.
Why $47,244.33 is the Line in the Sand
The $47,244.33 level is not just any arbitrary number; it represents a confluence of technical factors that make it a significant support zone. This level has acted as a floor on multiple occasions in the past, and a sustained break below it could trigger a fresh wave of selling pressure. The hourly RSI reading of 40.35 suggests that the bearish momentum is building, increasing the likelihood of a breakdown. Scalpers are likely watching for a decisive break below this level to initiate short positions, targeting the next support zone around $47,098.67. The importance of this level cannot be overstated, as it could dictate the DowJones30's trajectory in the short term.
The Bull's Roadmap: Reclaiming $47,463.33
For the bulls to regain control, they need to push the DowJones30 back above the immediate resistance at $47,463.33. This would require a significant shift in market sentiment and a weakening of the dollar. A successful break above this resistance could signal a potential reversal of the current bearish trend. The 1-hour stochastic reading, with K=18.41 and D=25.88, suggests the market is oversold, which could provide a catalyst for a bounce. Swing traders may look for confirmation of a reversal pattern, such as a double bottom or an inverse head and shoulders, before initiating long positions. The initial target for the bulls would be the next resistance level around $47,536.67, with a longer-term target of $47,682.33.
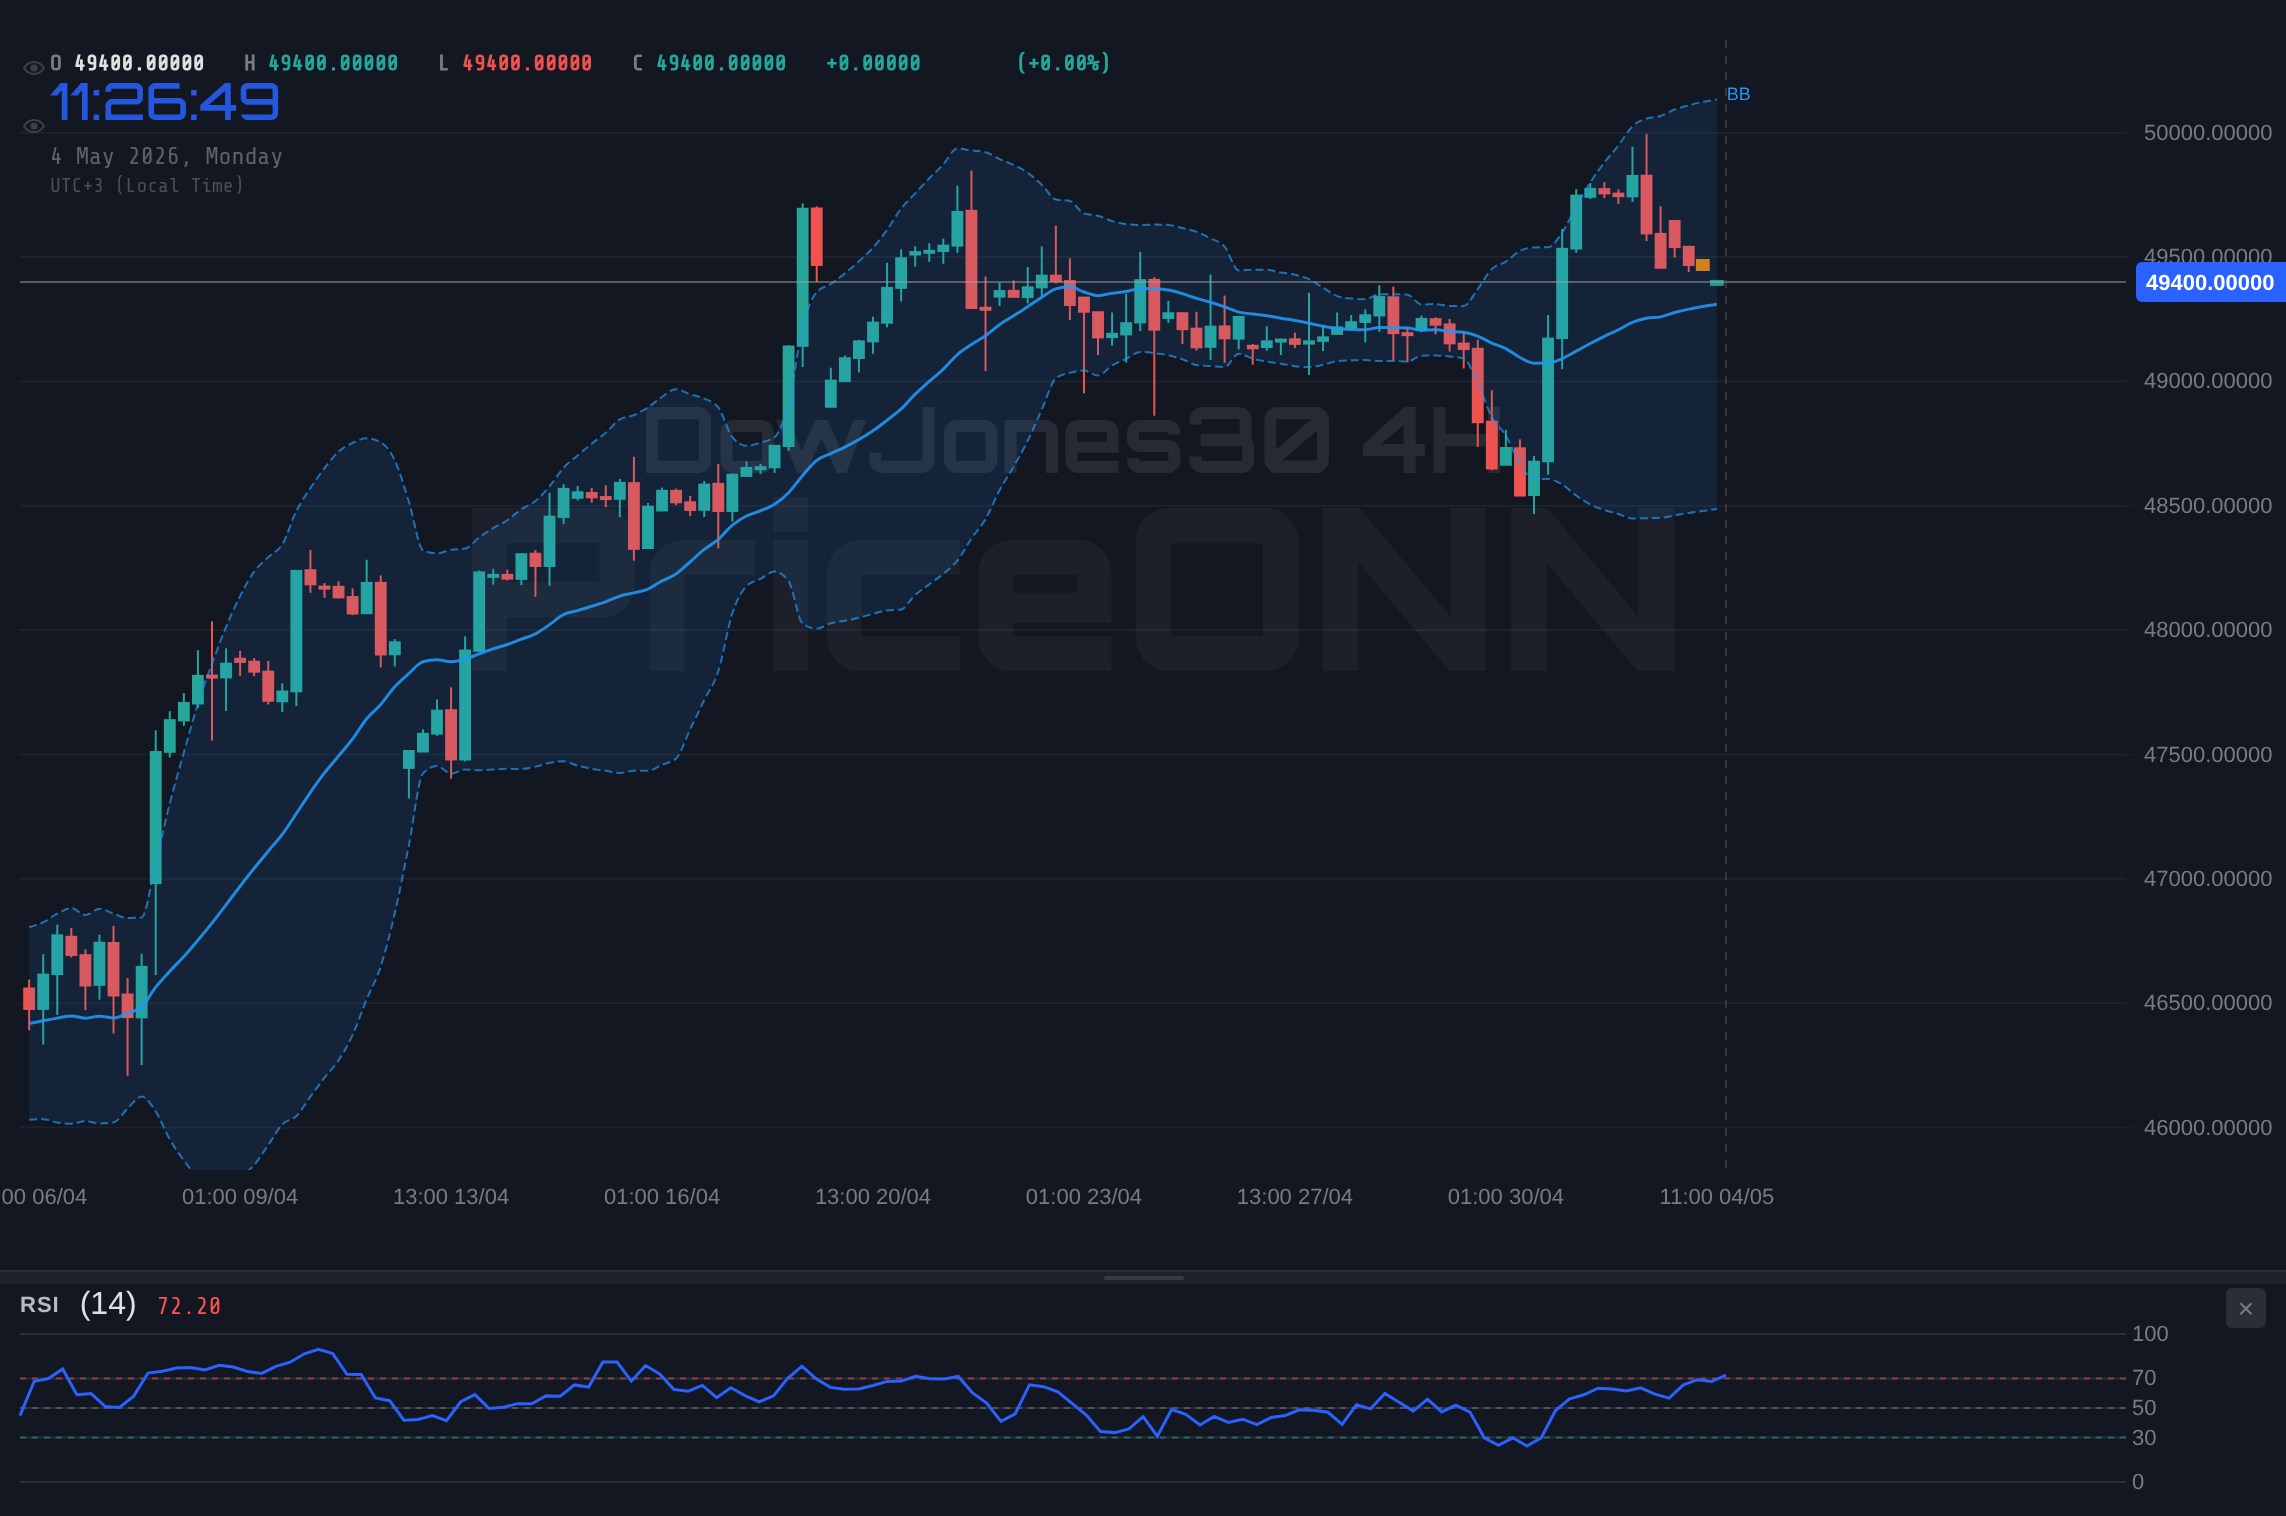
Where Bears Take Control: A Breakdown Scenario
The bearish scenario unfolds if the DowJones30 fails to hold the critical support at $47,244.33. A sustained break below this level, confirmed by increased volume, could trigger a sharp sell-off. The strengthening negative momentum, as indicated by the MACD histogram, supports this bearish outlook. The next support level to watch is $47,098.67, followed by $47,025.33. A break below the latter could open the door for a test of the daily support at $47,358.33. Long-term investors may view this as an opportunity to accumulate shares at lower prices, but they should be prepared for further volatility in the short term.
The Waiting Game: Range-Bound Consolidation
A neutral scenario could play out if the DowJones30 gets stuck in a range between the immediate support at $47,244.33 and resistance at $47,463.33. This would indicate a period of consolidation, with neither the bulls nor the bears able to gain a decisive advantage. The low ADX reading of 16.33 on the 1-hour chart supports this range-bound outlook, suggesting a lack of a strong trend. In this scenario, scalpers may focus on trading the range, buying near support and selling near resistance. Swing traders may prefer to remain on the sidelines, waiting for a clear breakout or breakdown before committing to a direction. A catalyst, such as a surprise economic data release or a geopolitical event, would likely be needed to break the stalemate.
The Most Likely Scenario: A Test of Lower Levels (Probability: 55%)
Considering the current technical picture and the broader market context, the most likely scenario is a test of lower support levels. The bearish trend is evident across multiple timeframes, and the strengthening dollar is adding further pressure on the DowJones30. The negative momentum indicated by the MACD histogram and the relatively weak RSI suggest that the bears are in control. While a bounce is possible, it is likely to be short-lived unless there is a significant shift in market sentiment. The upcoming economic data releases will be crucial in determining whether the DowJones30 can find a bottom or continue its descent. A break below $47,244.33 would confirm this bearish outlook and pave the way for a test of the daily support at $47,358.33.
DXY Strength and Equity Market Weakness: A Concerning Correlation
The DowJones30's recent struggles are closely linked to the strength of the US Dollar Index (DXY). With the DXY at 98.99, the dollar's strength is putting downward pressure on the DowJones30. Historically, a rising DXY often coincides with a decline in equity markets, as a stronger dollar makes US exports more expensive and can dampen corporate earnings. This inverse correlation is particularly evident in the current environment, where concerns about inflation and rising interest rates are already weighing on investor sentiment. The SP500 and Nasdaq100, also showing daily declines of 0.51% and 0.36% respectively, further underscore the broader market weakness and risk-off sentiment.
Commodity Price Pressures and Inflationary Fears
The energy sector is also playing a role in the current market dynamics. WTI crude oil, currently trading at $87.56, has seen a daily increase of 1.46%. While rising oil prices can be a boon for energy companies, they also contribute to inflationary pressures, which in turn can prompt the Federal Reserve to adopt a more hawkish stance. This can lead to higher interest rates, which can negatively impact equity valuations. The market is closely watching upcoming inflation data for clues about the Fed's next move. A higher-than-expected inflation reading could trigger a further sell-off in the DowJones30.
What I'm Watching This Week: Key Triggers
Several key triggers could influence the DowJones30's direction this week. Firstly, the upcoming economic data releases, including inflation figures, will be closely scrutinized by investors. Secondly, any significant geopolitical developments could also impact market sentiment. Thirdly, any hawkish comments from Federal Reserve officials could further weigh on the index. Specifically, I am watching for:
- A sustained break below $47,244.33, which would confirm the bearish outlook.
- A successful reclaim of $47,463.33, which could signal a potential reversal.
- Any surprise economic data releases that could alter market sentiment.
Historical Perspective: Echoes of Past Market Corrections
The current market conditions bear some resemblance to past market corrections. For example, the volatility and uncertainty surrounding the 2008 financial crisis and the 2020 COVID-19 pandemic led to significant declines in the DowJones30. While the current situation is not as dire, the underlying concerns about inflation, interest rates, and geopolitical risks are similar. Investors can learn from these past events and adopt a cautious approach, focusing on risk management and diversification. The key is to remain disciplined and avoid making emotional decisions based on short-term market fluctuations.
DowJones30 Volatility Analysis and Trading Strategies
Given the current market volatility, traders should adjust their strategies accordingly. Scalpers can focus on short-term range-bound trading, while swing traders should wait for clear breakout or breakdown signals before committing to a direction. Long-term investors may consider using a dollar-cost averaging strategy to gradually accumulate shares at lower prices. It is also essential to closely monitor the economic calendar and be prepared for potential surprises. The level of risk tolerance should be considered, and stop-loss orders should be used to limit potential losses. A well-defined trading plan is crucial for navigating the current market environment.
| Indicator | Value | Signal | Interpretation |
|---|---|---|---|
| RSI (1H) | 40.35 | Neutral | Bearish momentum building |
| MACD (1H) | Negative | Bearish | Strengthening negative momentum |
| Stochastic (1H) | K=18.41, D=25.88 | Oversold | Potential for a bounce |
| ADX (1H) | 16.33 | Weak | Lack of a strong trend |
Frequently Asked Questions: DowJones30 Analysis
What happens if DowJones30 breaks below $47,244.33 support?
A break below the $47,244.33 support level would likely trigger a fresh wave of selling pressure, potentially leading to a test of the next support zone around $47,098.67. This scenario is supported by the strengthening negative momentum indicated by the MACD histogram.
Should I buy DowJones30 at current levels of $47,313.50 given the bearish trend?
Given the current bearish trend and the DXY strength, it may be prudent to wait for a clear reversal signal before initiating long positions. A successful reclaim of $47,463.33 would be an initial indication of a potential reversal.
Is the 1-hour RSI reading of 40.35 a reliable indicator of further downside for DowJones30?
The 1-hour RSI reading of 40.35 suggests that the bearish momentum is building, increasing the likelihood of a breakdown. However, it is essential to consider other factors, such as volume and price action, before making a trading decision.
How will the upcoming inflation data affect DowJones30 this week?
The upcoming inflation data will be closely scrutinized by investors for clues about the Fed's next move. A higher-than-expected inflation reading could prompt the Fed to adopt a more hawkish stance, which could negatively impact equity valuations and trigger a further sell-off in the DowJones30.
Track markets in real-time
AI-powered analysis, technical indicators and real-time price data.
Join Our Telegram Channel
Breaking market news, AI analysis and trading signals instantly.
Join Channel