

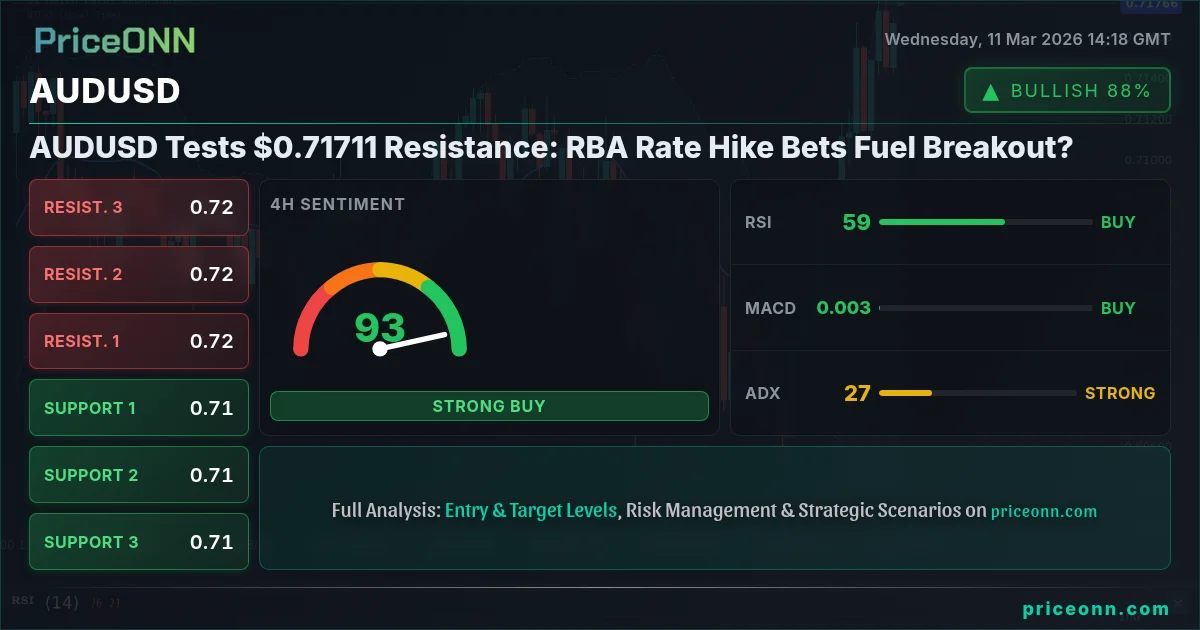
The Australian dollar is making a bold move against the US dollar today, with AUDUSD testing a key resistance level at $0.71711. This surge is primarily fueled by growing speculation that the Reserve Bank of Australia (RBA) will implement a more aggressive rate hike than previously anticipated. The question now is whether this breakout has legs, or if we're looking at a short-term rally before a potential pullback.
- AUDUSD is currently testing resistance at $0.71711, driven by RBA rate hike expectations.
- ADX at 35.44 on the 1H chart indicates a strong uptrend, but the RSI at 60.49 suggests caution.
- A break above $0.71745 could open the door to further gains towards $0.71835, while support sits at $0.71365.
- DXY's current level of 98.79 provides a mixed signal, as its rise could weigh on AUDUSD, but strong AUD fundamentals may counteract this.
Having tracked AUDUSD through several RBA rate cycles, it's clear that expectations surrounding monetary policy play a significant role in dictating price action. The current bullish sentiment is largely predicated on the belief that the RBA will need to act more decisively to combat inflation. Several analysts are now projecting a 50-basis point hike at the next meeting, a move that would undoubtedly provide further tailwinds for the Aussie. However, it's crucial to remember that these are just expectations - the actual RBA decision could easily deviate, triggering a sharp reversal.
Looking at the broader market context, the US Dollar Index (DXY) is currently trading at 98.79, reflecting a strengthening dollar. This typically puts downward pressure on pairs like AUDUSD. However, the strong fundamentals supporting the Australian dollar, including rising commodity prices and a robust domestic economy, could offset the negative impact of a stronger dollar. Keep a close eye on the DXY - a sustained break above 99.00 could signal a more significant headwind for AUDUSD.
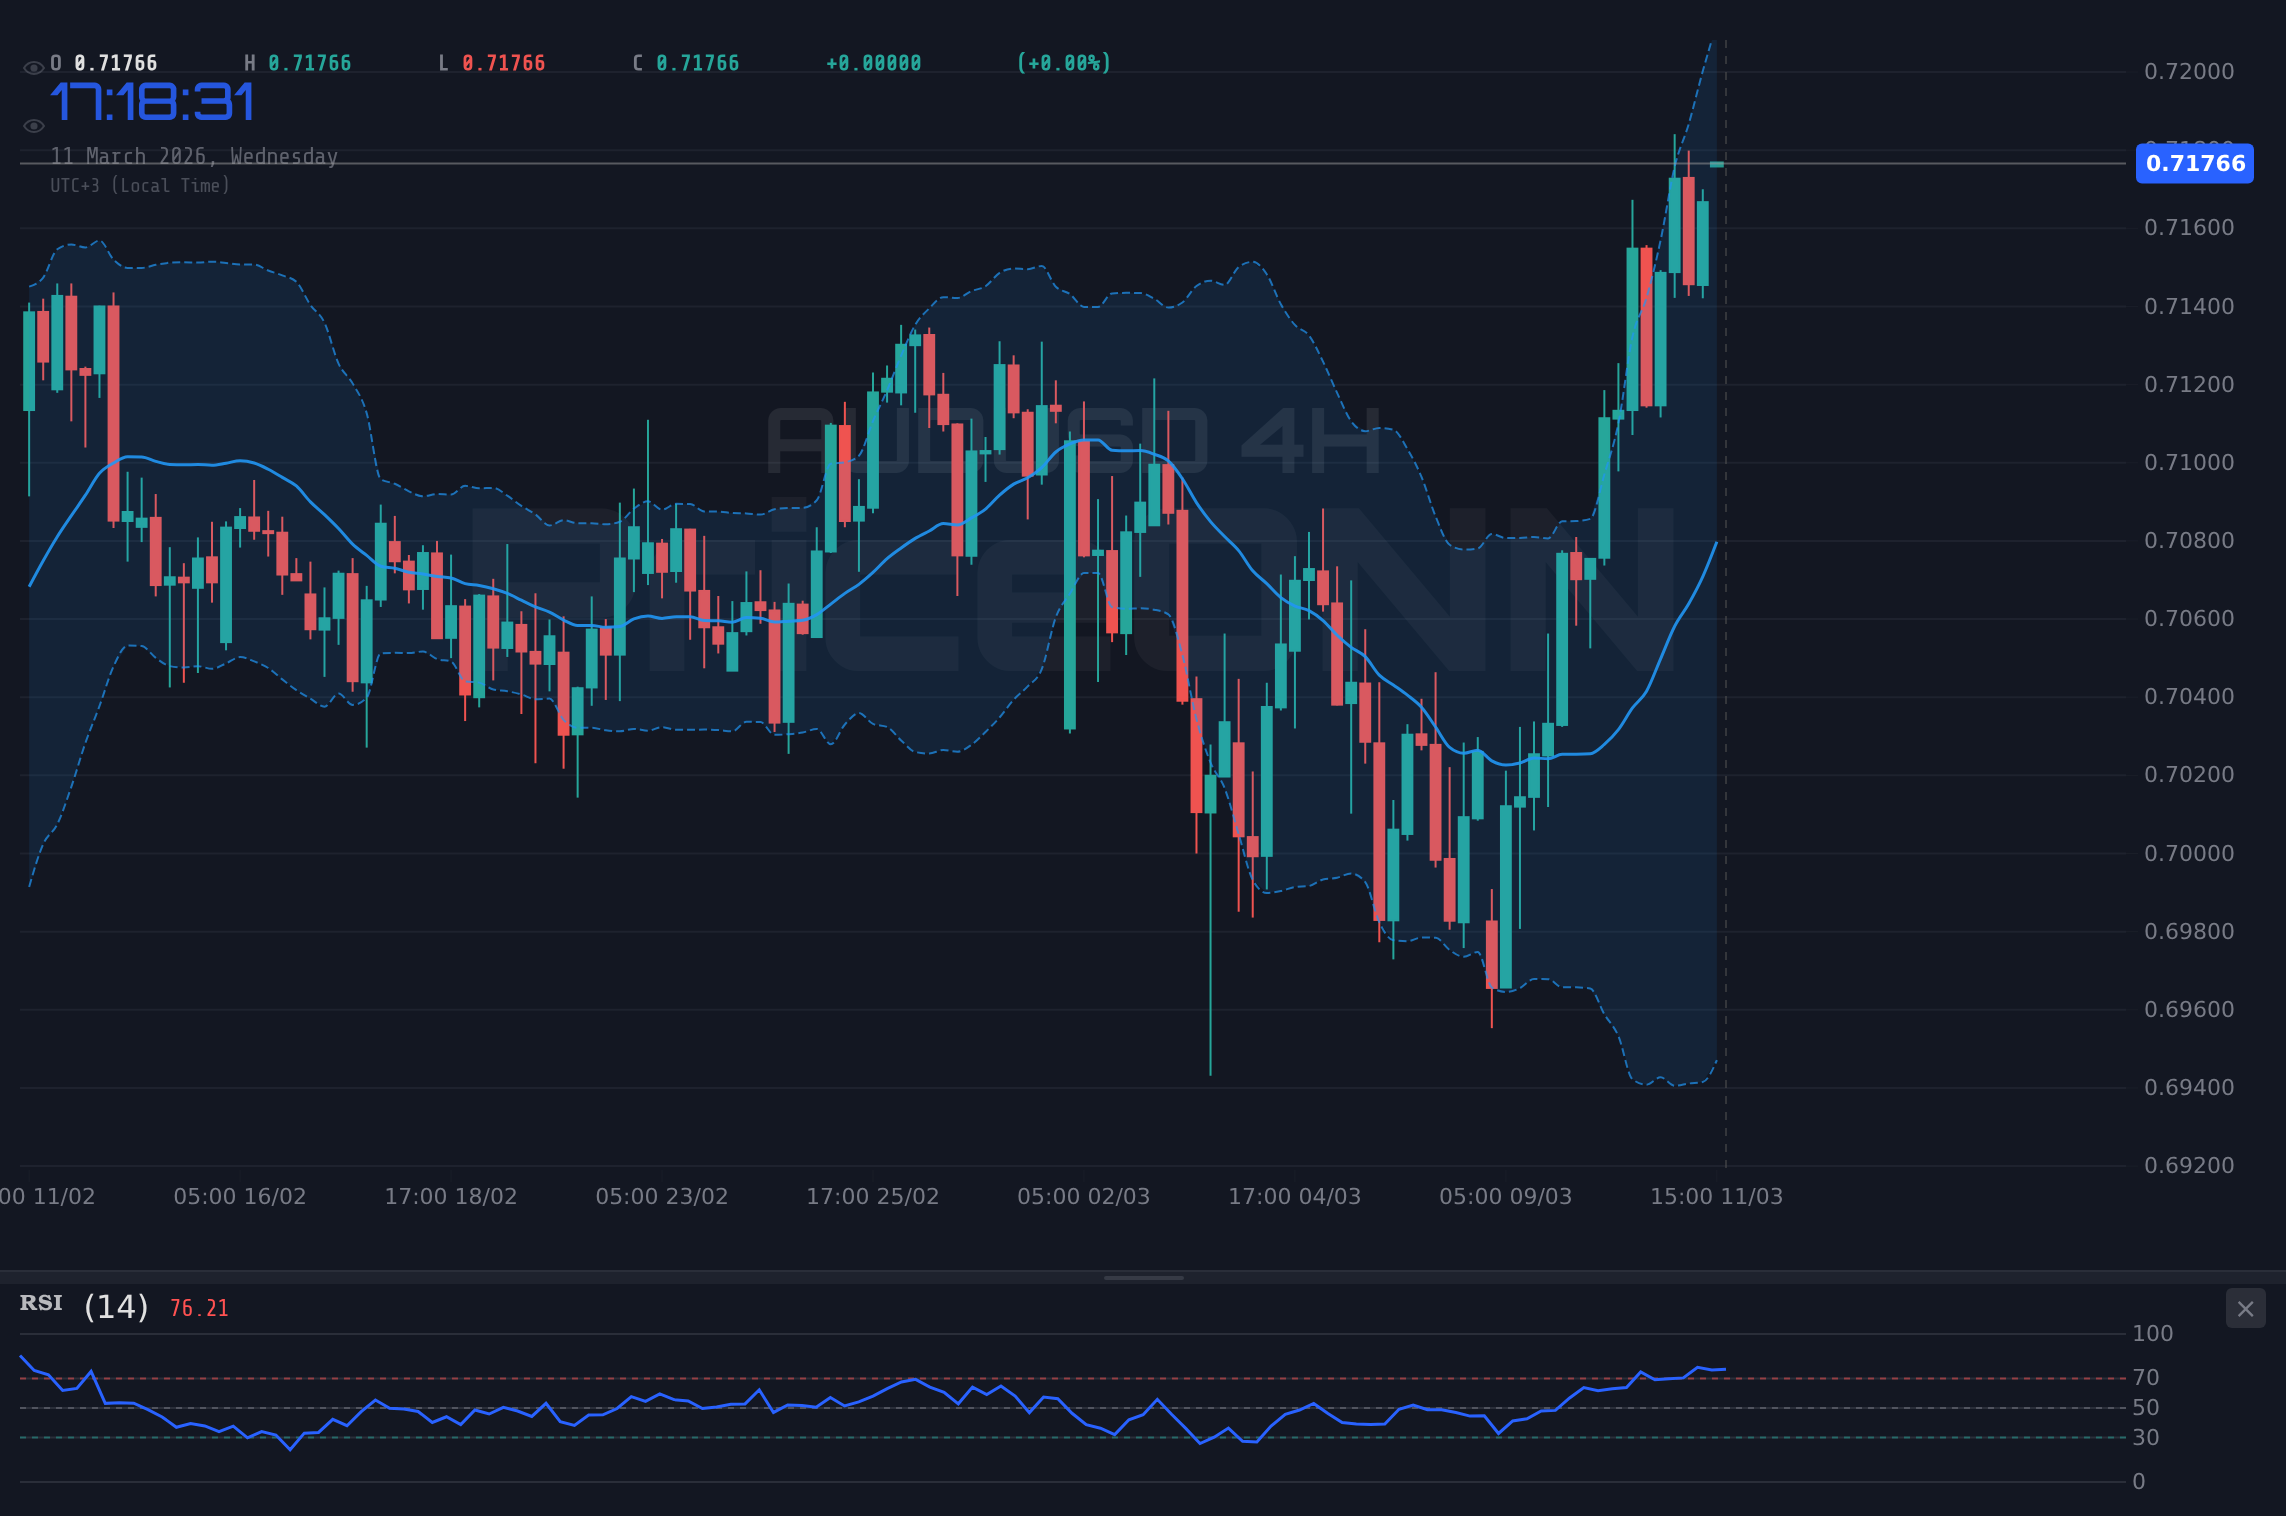
From a technical perspective, the 1-hour chart paints an interesting picture. The ADX is currently at 35.44, indicating a strong uptrend. This suggests that the bullish momentum is genuine and could carry AUDUSD higher. However, the RSI is also approaching overbought territory, sitting at 60.49. While not yet in the danger zone, it does suggest that the bulls may be losing steam. A pullback is possible if the RSI climbs much higher without a corresponding increase in price.
Zooming out to the 4-hour timeframe, the trend remains bullish, with the ADX at 26.44. The RSI is also elevated at 63.41, but again, not yet at a level that would trigger immediate concern. The MACD histogram is positive, suggesting that the bullish momentum is still intact. However, the Stochastic oscillator is flashing a potential warning sign, with %K at 83.36 and %D at 85.12, both in overbought territory. This divergence between the MACD and Stochastic suggests that the uptrend may be losing steam, and a pullback is possible.
For scalpers, the immediate focus is on the $0.71745 resistance level. A clean break above this level with strong volume could trigger a quick long trade, targeting $0.71835. However, given the overbought conditions on the Stochastic, caution is warranted. A tight stop-loss should be placed just below $0.7160 to protect against a potential reversal. Scalpers should also be aware of the upcoming economic data releases - any surprise news could trigger a violent move in either direction.
Swing traders should be looking for a more sustained breakout above $0.71745. A daily close above this level would provide a stronger confirmation of the bullish trend. In this scenario, potential targets would be the $0.71933 and $0.72067 resistance levels on the 4-hour chart. The stop-loss should be placed below the $0.71323 support level. Swing traders should also pay close attention to the overall risk sentiment in the market - a shift towards risk-off could undermine the bullish case for AUDUSD.
Long-term investors should be taking a more cautious approach. While the current bullish momentum is encouraging, it's important to remember that AUDUSD is still trading within a broader downtrend on the daily chart. A more conservative strategy would be to wait for a break above the $0.72263 resistance level before adding to long positions. The stop-loss should be placed below the $0.70557 support level. Long-term investors should also be mindful of the long-term economic outlook for both Australia and the United States - any significant changes in the relative economic performance of the two countries could have a major impact on AUDUSD.
Historically, AUDUSD has shown a strong correlation with commodity prices, particularly iron ore and coal, which are major exports for Australia. Rising commodity prices tend to support the Aussie, while falling prices tend to weigh on it. Keep an eye on the price action in these key commodities - they can provide valuable clues about the future direction of AUDUSD. Also, be aware of any geopolitical events that could impact commodity supply or demand, such as trade disputes or disruptions to production.
The economic calendar is relatively light today, but it's worth noting the upcoming GBP data on Friday, March 13th, and USD data also on Friday, March 13th. While not directly related to AUDUSD, these releases could impact overall market sentiment and indirectly affect the pair. For example, stronger-than-expected US jobs data could bolster the dollar and put downward pressure on AUDUSD. Traders should remain vigilant and be prepared to adjust their positions accordingly.
One thing that's crucial to understand is the intermarket dynamics at play. The strength of the Australian dollar is not just about Australia; it's also about what's happening in the rest of the world. For example, if China's economy is booming, that will likely drive up demand for Australian commodities, which in turn will support the Aussie. Conversely, if there's a global recession, that will likely weigh on commodity prices and hurt the Aussie. So, it's essential to have a global perspective when trading AUDUSD.
AUDUSD is currently testing a key resistance level at $0.71711, driven by RBA rate hike expectations. While the technical picture is mixed, with both bullish and bearish signals, the overall trend remains positive. Scalpers, swing traders, and long-term investors should all be watching this level closely for a potential breakout. However, caution is warranted given the potential for a pullback and the upcoming economic data releases. With DXY at 98.79, the dollar's strength creates a challenging environment, but Aussie fundamentals could counter it.
A sustained break above $0.71745 resistance, fueled by continued RBA rate hike bets, could trigger a rally towards $0.71835 and potentially $0.71933. This scenario is more likely if DXY weakens and commodity prices remain elevated.
Failure to break above $0.71745, coupled with a strengthening DXY and weaker commodity prices, could lead to a pullback towards $0.71365 and potentially $0.71275. This scenario becomes more probable if the RBA signals a less hawkish stance.
Frequently Asked Questions: AUDUSD Analysis
What happens if AUDUSD breaks above $0.71745 resistance?
A break above the $0.71745 resistance level could signal a continuation of the uptrend, potentially opening the door to further gains towards $0.71835 and $0.71933. This scenario would be supported by strong bullish momentum and a weakening DXY.
Should I buy AUDUSD at current levels of $0.71711 given the overbought Stochastic?
While the uptrend is strong, the overbought Stochastic suggests caution. A more prudent approach would be to wait for a pullback towards the $0.7160 support level before initiating a long position. This would provide a better risk-reward ratio.
Is RSI at 60.49 a sell signal for AUDUSD right now?
An RSI of 60.49 is not necessarily a sell signal, but it does indicate that the bulls may be losing steam. It's important to look at other indicators and price action for confirmation before making a decision. A break below $0.7160, combined with a bearish divergence on the RSI, could signal a potential reversal.
How will the USD data on Friday, March 13th, affect AUDUSD this week?
Stronger-than-expected US data could bolster the dollar and put downward pressure on AUDUSD. Conversely, weaker-than-expected data could weaken the dollar and provide a tailwind for AUDUSD. Traders should pay close attention to the actual numbers and the market's reaction to the release.
Technical Outlook Summary
| Indicator | Value | Signal |
|---|---|---|
| RSI (14) | 60.49 | Neutral |
| MACD Histogram | Positive | Bullish |
| Stochastic | K=34.5, D=46.35 | Bearish |
| ADX | 35.44 | Strong Trend |
| Bollinger | Middle Band | Watch |
Key Levels
Support Levels
Resistance Levels
Track markets in real-time
AI-powered analysis, technical indicators and real-time price data.
Join Our Telegram Channel
Breaking market news, AI analysis and trading signals instantly.
Join Channel