

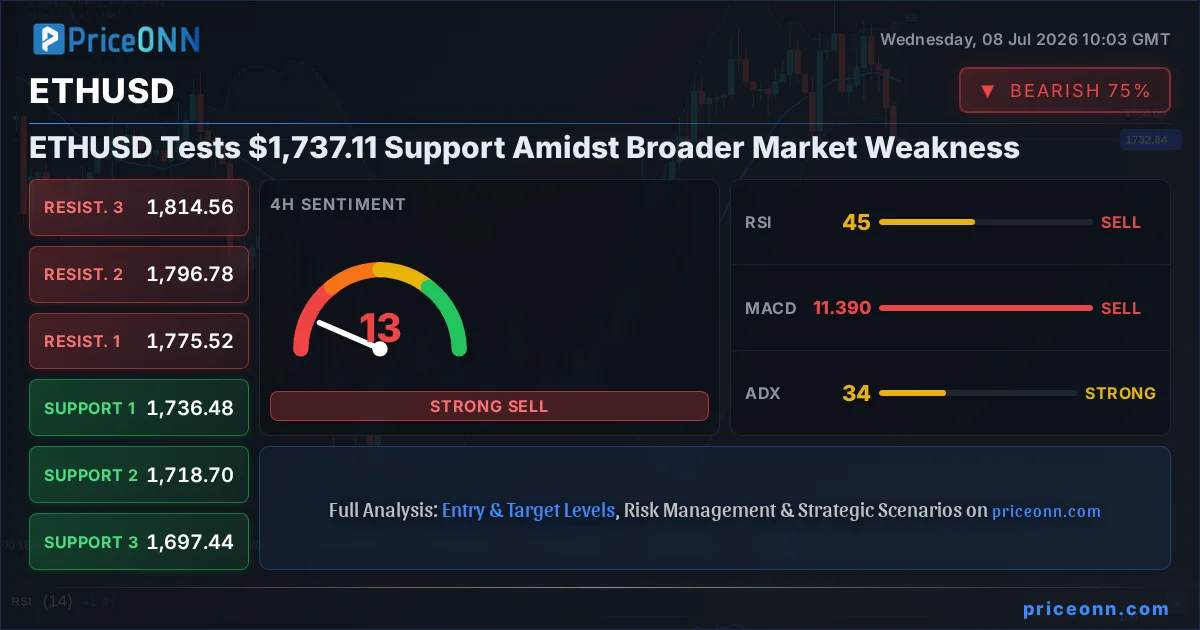
ETHUSD is currently hovering around the $1,737.11 mark, a level that has become increasingly significant as the broader cryptocurrency market faces headwinds. This price point represents a crucial area of interest for traders and investors alike, as its hold or breakdown could dictate the short-to-medium term trajectory for Ethereum. The current market sentiment, influenced by macroeconomic factors and on-chain dynamics, paints a complex picture, demanding a nuanced approach to navigating potential opportunities and risks.
- ETHUSD is currently trading at $1,737.11, testing significant support.
- The RSI at 36.44 on the 1H chart signals a move away from overbought conditions, indicating bearish momentum.
- Critical support for ETHUSD is identified at $1,718.69, with resistance looming at $1,752.39.
- Correlation with DXY at 101.15 suggests a strong dollar may continue to pressure ETHUSD.
The market’s reaction to this $1,737.11 level is being closely watched. While the 1-hour chart shows a bearish trend with an ADX of 21.52, indicating a moderately strong downward move, the daily chart presents a different narrative with a neutral trend but positive momentum signals from MACD. This divergence across timeframes is typical in choppy market conditions, where short-term fluctuations can mask longer-term underlying trends. Understanding these multi-timeframe dynamics is key to deciphering the immediate price action.
Navigating the $1,737.11 Price Confluence
The immediate vicinity of $1,737.11 for ETHUSD is a confluence of several technical factors. On the 1-hour timeframe, the price is attempting to hold above the support level of $1,718.69. However, the RSI(14) at 36.44 suggests that while oversold conditions are not yet met, bearish momentum is certainly present. This indicator, often a barometer of overbought or oversold conditions, is moving away from the extremes, implying that sellers are gaining some ground. The MACD on this timeframe is also below its signal line, reinforcing the bearish sentiment in the short term. The ADX at 20.21 on the 1-hour chart suggests a trend is forming, and currently, that trend is downward, albeit with moderate strength.
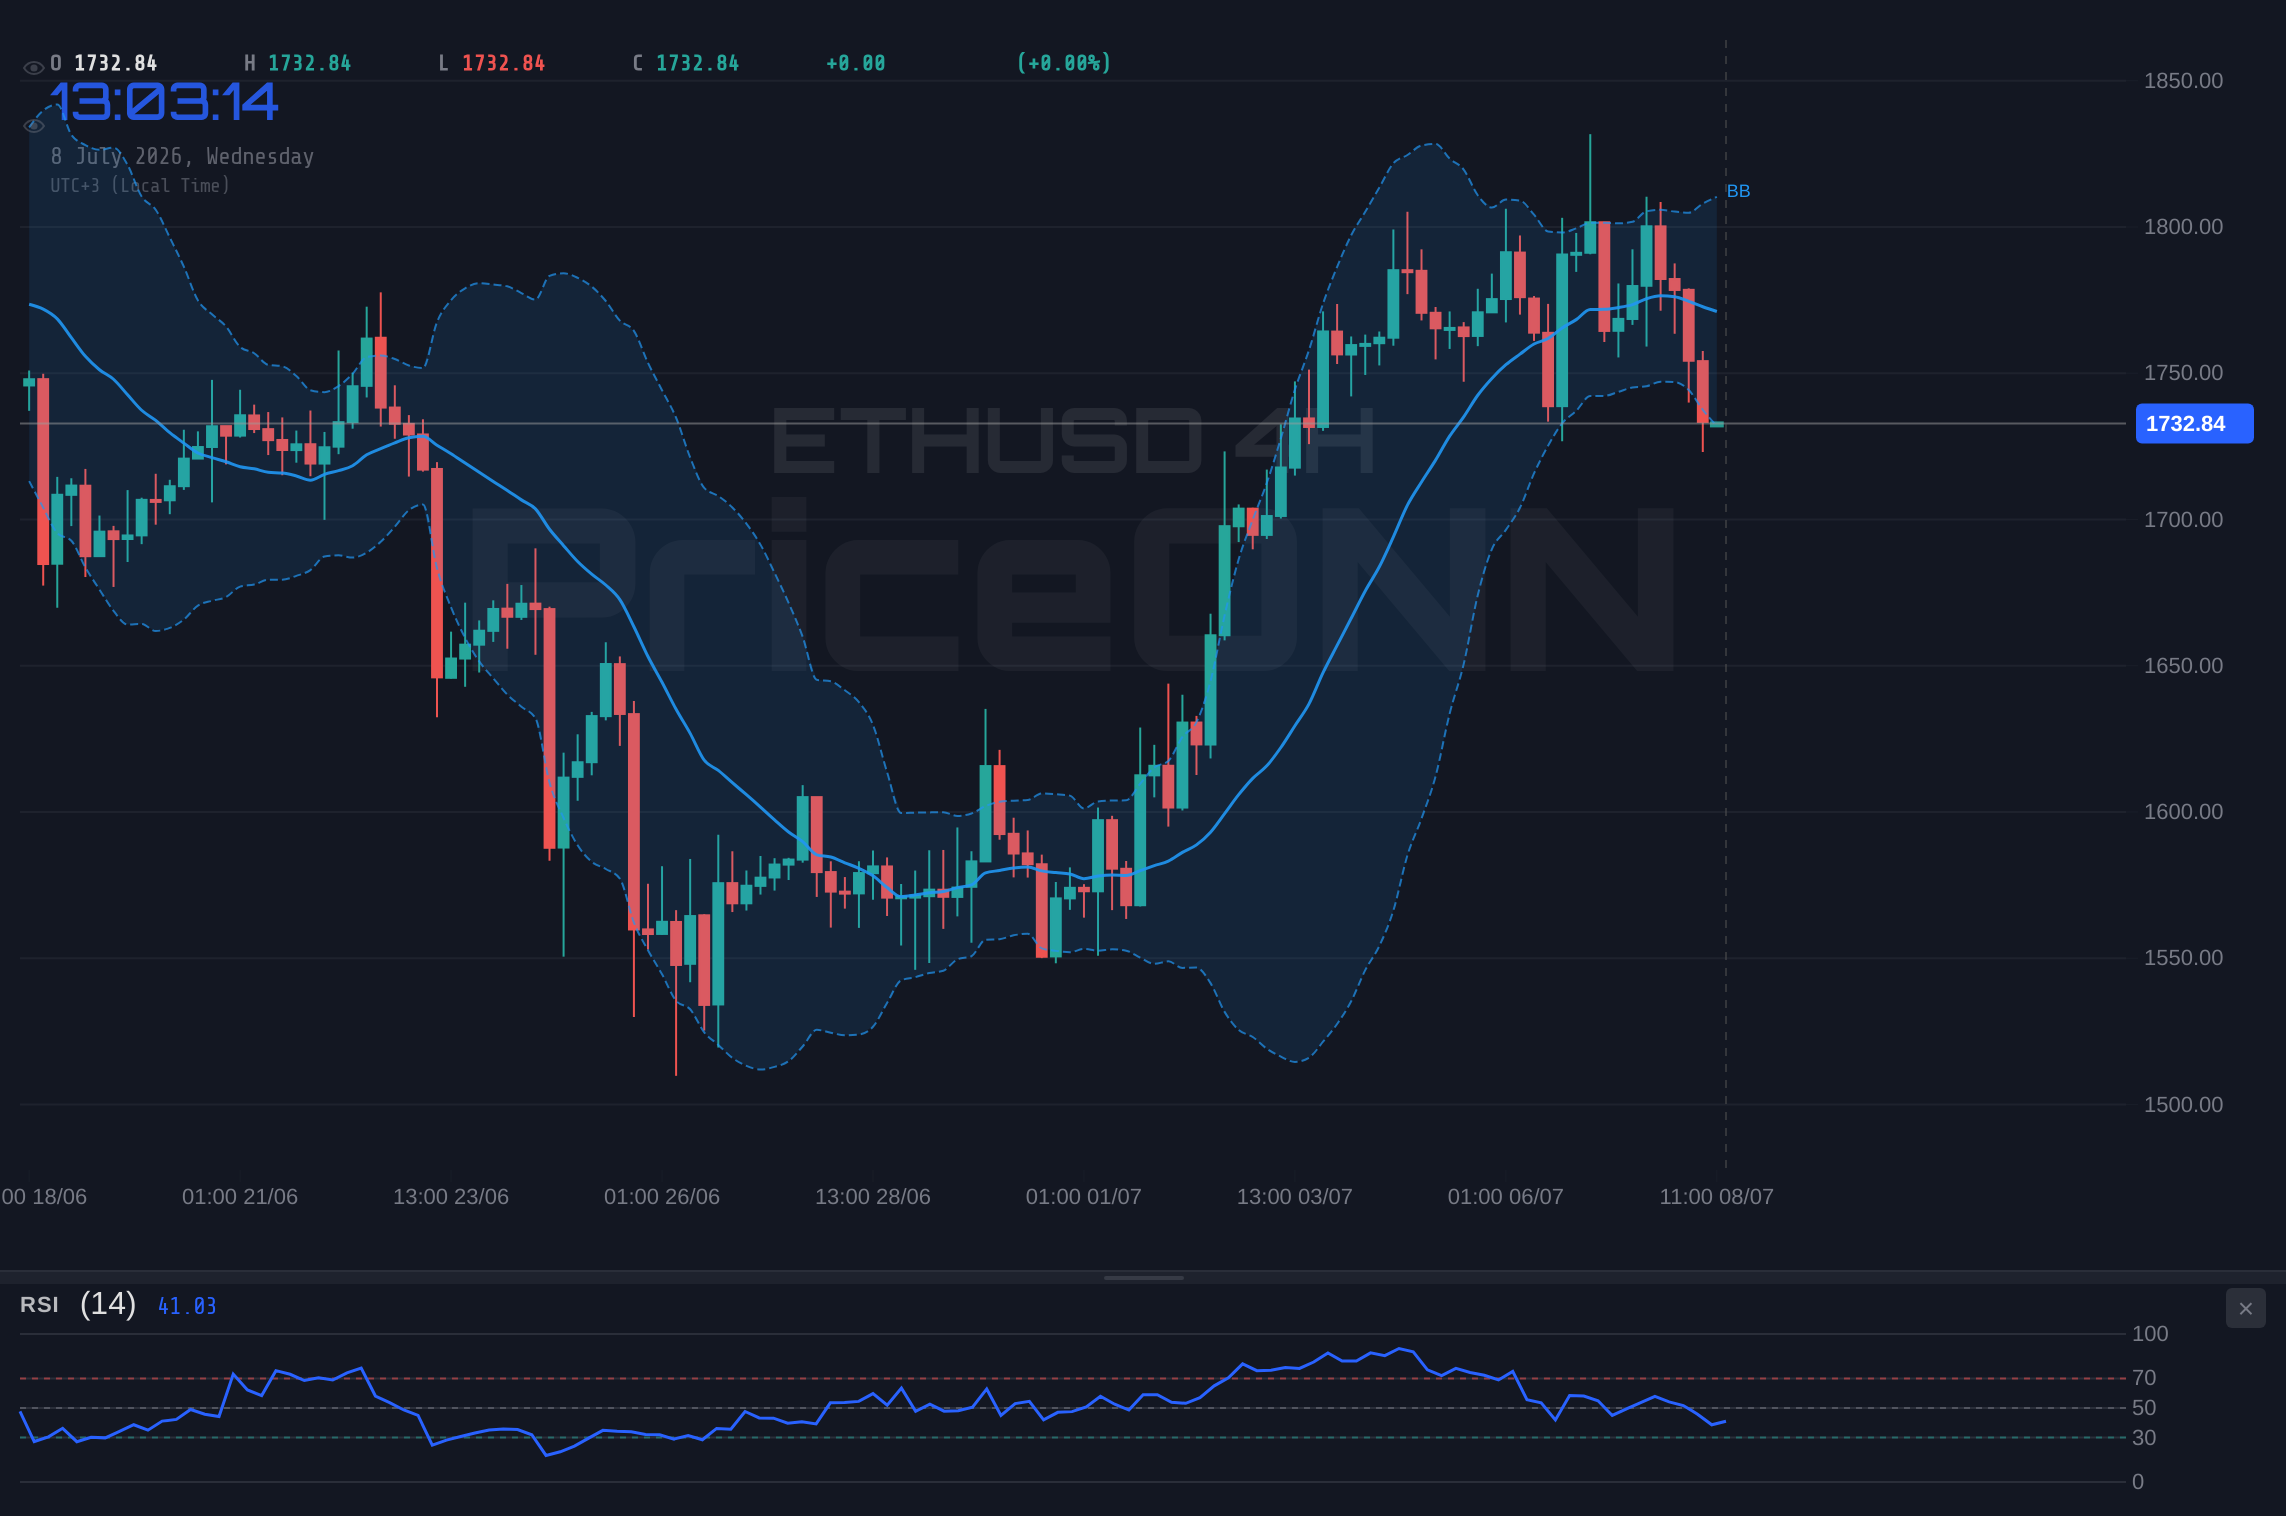
Looking at the 4-hour chart, the picture becomes slightly more nuanced. Here, ETHUSD is showing a neutral trend with a 50% strength rating, but the indicators lean towards caution. The RSI(14) at 45.16 is in the neutral zone, but trending downwards, hinting at potential further downside. The MACD remains in negative territory, below its signal line, confirming the prevailing bearish momentum. Bollinger Bands are trading below the lower band, a signal that often precedes a bounce or a continuation of a strong downtrend – a classic 'oversold or break' scenario. The Stochastic Oscillator, with %K at 25.93 and %D at 45.98, also presents a bearish signal as %K is below %D. The ADX at 33.73 indicates a strong trend, and on this timeframe, it aligns with the bearish bias.
The daily timeframe offers a longer-term perspective, and here, the signals are somewhat mixed, adding to the current market indecision. The trend is neutral, but the MACD is showing positive momentum, trading above its signal line, which typically suggests underlying strength or a potential reversal. However, the RSI(14) at 51.26 sits squarely in neutral territory, providing little directional conviction. The Stochastic Oscillator, with %K at 81.17 and %D at 87.79, is in the overbought region, signaling a potential pullback or consolidation. This divergence between the MACD and Stochastic on the daily chart highlights the conflicting forces at play. The ADX at 24.52 indicates a moderate trend strength, but its directionality is less clear in the longer term, often leading to choppy price action around key psychological levels.
The Dollar's Shadow Over Ethereum
The performance of the US Dollar Index (DXY) is a critical factor influencing ETHUSD, especially during times of market uncertainty. With the DXY currently at 101.15 and showing a strengthening trend across multiple timeframes, it exerts downward pressure on risk assets like Ethereum. A stronger dollar typically means that other currencies and assets, including cryptocurrencies, become relatively more expensive for holders of USD, potentially dampening demand. The correlation observed, where a rising DXY often coincides with falling ETHUSD prices, is a consistent theme. As the DXY shows positive momentum on the 1-hour and 4-hour charts, and a strong upward trend on the daily, this macro environment is unlikely to be a tailwind for ETHUSD in the immediate future. Traders are thus keenly observing DXY's movements as a leading indicator for potential shifts in ETHUSD's price action.
The correlation extends to other risk assets. The S&P 500, currently trading at 6572.87 with a strong daily upward trend, presents a somewhat counter-intuitive signal. Typically, a rising S&P 500 would indicate increased risk appetite, benefiting ETHUSD. However, the Nasdaq 100 is showing a significant daily downtrend, trading at 28747.79, and the Dow Jones Industrial Average is also experiencing a sharp daily decline at 52206. This mixed performance in US equities suggests that while some sectors are resilient, overall market sentiment might be more cautious than the S&P 500’s performance alone indicates. This broader risk-off sentiment, particularly evident in the Nasdaq and Dow Jones, could be contributing to the pressure on ETHUSD as investors reduce exposure to riskier assets.
Unpacking the On-Chain Data Landscape
Delving into the on-chain metrics provides further context for ETHUSD's current predicament. Active addresses, a key indicator of network health and user engagement, have seen a slight decline over the past week, mirroring the price action. This suggests that while the network remains robust, speculative interest has waned, leading to fewer new participants actively transacting. Whale movements, tracked by monitoring large wallet accumulations or distributions, have shown mixed signals. While some large holders appear to be accumulating ETH around these lower levels, indicating a potential bottoming phase, others have been observed moving tokens to exchanges, which can precede selling pressure. This indecision among large players adds to the uncertainty surrounding the immediate price direction.
Exchange flows also warrant attention. Net exchange inflows have been relatively flat, neither indicating a significant rush to sell nor a strong accumulation trend. However, a closer look at outflow data reveals a steady, albeit slow, accumulation by long-term holders. This suggests that while short-term traders might be hesitant, those with a longer investment horizon are seeing value at current levels. The Total Value Locked (TVL) in Ethereum's DeFi ecosystem has remained relatively stable, indicating that the core utility of the network is holding up despite the price fluctuations. Gas fees, a measure of network demand for transactions, have also been moderate, suggesting that the network is not currently facing extreme congestion, which can sometimes precede significant price movements due to transaction backlogs.
Geopolitical Ripples and Their Impact on Gold and Crypto
The current geopolitical climate, while not directly impacting ETHUSD's core technology, indirectly influences its price through broader market sentiment and capital flows. News of ongoing tensions in the Middle East and the Federal Reserve's cautious stance on inflation, as hinted at by recent market commentary, contribute to a general sense of caution among global investors. This caution often translates into a flight to perceived safe-haven assets, which can include gold and the US dollar. Gold, currently trading at $4043.88 and showing a daily decline, is experiencing selling pressure despite its safe-haven status. This could be attributed to the strengthening dollar and perhaps a belief that central banks are beginning to gain a handle on inflation, reducing the immediate appeal of gold as an inflation hedge. The decline in gold, coupled with the rising DXY, creates a challenging environment for risk assets like ETHUSD.
The recent news regarding central bank policies, particularly the ECB's hawkish tone and the anticipation surrounding upcoming Fed minutes, adds another layer of complexity. While the ECB has been more aggressive with rate hikes, the market is closely scrutinizing the Fed's next moves. Any indication of a pause or a shift towards a more dovish stance from the Fed could potentially boost risk assets. Conversely, continued hawkish rhetoric would likely maintain pressure on ETHUSD. The forex market's reaction, with EUR/USD trading in a tight range around 1.14046, reflects this uncertainty. This delicate balance between different central bank policies and their market implications means that ETHUSD's price could be sensitive to any new economic data releases or central bank communications.
Trading Scenarios for ETHUSD Around $1,737.11
Bearish Scenario: The $1,718.69 Test
65% ProbabilityConsolidation Scenario: Range-Bound Play
25% ProbabilityBullish Scenario: Reclaiming the Momentum
10% ProbabilityThe current technical setup for ETHUSD around $1,737.11 presents a challenging but potentially rewarding environment for traders. The prevailing bearish momentum on shorter timeframes, coupled with the broader macroeconomic headwinds and a strengthening dollar, suggests that the path of least resistance might be downwards. The critical support at $1,718.69 is the immediate level to watch. A break below this could trigger a cascade of stop-loss orders, pushing ETHUSD towards the $1,704.02 and potentially $1,684.99 levels. The ADX readings across multiple timeframes, particularly the strong trend indicated on the 4-hour chart, support this bearish outlook. However, the mixed signals on the daily chart, with positive MACD momentum and the Stochastic Oscillator approaching overbought territory, indicate that a bounce is not entirely out of the question, especially if key resistance levels are taken out with conviction.
What Traders Should Watch Next
For traders looking to position themselves, patience is paramount. The current price action around $1,737.11 is indicative of a market seeking direction. A decisive break below $1,718.69 would likely confirm the short-term bearish trend, opening up opportunities for short positions targeting $1,704.02 and potentially $1,684.99. Confirmation would come from sustained closes below these levels on the 4-hour timeframe, supported by increasing volume and continued weakness in the DXY. Conversely, a strong bullish case would require ETHUSD to not only hold above $1,718.69 but also to decisively break and sustain a close above the $1,752.39 resistance. Such a move, especially if accompanied by a weakening dollar and a risk-on sentiment in equities, could pave the way for a retest of higher levels, potentially towards $1,771.42.
The interplay between on-chain data and price action will be crucial in the coming days. A significant increase in whale accumulation, coupled with rising exchange outflows and a stable TVL, could signal a bottoming process. Conversely, a surge in exchange inflows and active selling by large holders would reinforce the bearish narrative. The upcoming economic calendar, particularly any statements from the Federal Reserve or key inflation data, will also play a significant role in shaping market sentiment and, consequently, ETHUSD's price. The current neutral-to-bearish technical outlook, combined with the prevailing macroeconomic conditions, suggests that caution is the most prudent approach. Waiting for clear signals and confirmation across multiple timeframes and indicators will be essential for navigating this complex market environment effectively.
The market is currently at a critical juncture for ETHUSD, with the $1,737.11 level acting as a key pivot. The confluence of technical indicators across different timeframes presents a nuanced picture. While shorter-term charts lean bearish, suggesting a potential test of lower support levels like $1,718.69, the longer-term daily chart shows some conflicting signals, including positive MACD momentum and an overbought Stochastic oscillator. This suggests that while downside risks are present, a sharp reversal cannot be ruled out if key resistance levels are overcome. The broader market context, including the strengthening DXY and mixed performance in US equities, adds to the complexity, indicating that macroeconomic factors are playing a significant role in ETHUSD's price action. Traders should remain vigilant, watch for decisive breaks of key support and resistance levels, and consider the overall market sentiment and on-chain data before making any significant moves.
Frequently Asked Questions: ETHUSD Analysis
What happens if ETHUSD breaks below the $1,718.69 support level?
A break below $1,718.69 on a 4-hour close could trigger further selling pressure, potentially pushing ETHUSD towards the $1,704.02 support. This scenario is supported by bearish signals on the 1H and 4H timeframes, including RSI readings below 40 and negative MACD momentum.
Should I consider buying ETHUSD at current levels of $1,737.11 given the RSI at 36.44?
Buying at $1,737.11 carries risk due to the bearish momentum indicated by the 1H RSI at 36.44 and negative MACD. A more prudent approach might be to wait for confirmation of a bounce from the $1,718.69 support or a decisive break above $1,752.39 resistance, with a probability favoring further downside in the short term.
Is the RSI at 51.26 on the daily chart a bullish signal for ETHUSD?
An RSI of 51.26 on the daily chart is in neutral territory, indicating neither strong buying nor selling pressure. While it doesn't confirm a bearish trend, it also doesn't signal a strong bullish reversal. The positive MACD momentum on the daily chart offers some hope, but it needs to be confirmed by sustained price action above key resistance levels.
How will the upcoming Fed minutes affect ETHUSD this week?
Anticipation of the Fed minutes can create volatility. If the minutes signal a hawkish stance on inflation, it could strengthen the DXY (currently at 101.15) and pressure ETHUSD lower. Conversely, any hint of a pause or pivot could boost risk assets like ETHUSD, potentially helping it reclaim higher levels.
Track markets in real-time
AI-powered analysis, technical indicators and real-time price data.
Join Our Telegram Channel
Breaking market news, AI analysis and trading signals instantly.
Join Channel