파운드달러 분석 오늘, 지정학적 긴장이 완화되고 영국 중앙은행의 금리 인하 기대감이 변화하면서 GBPUSD가 1.33503달러까지 하락하여 압박을 받고 있습니다. 이러한 움직임은 세계적인 사건과 국내 경제 요인 모두에 영향을 받는 광범위한 시장 역학을 반영하므로 트레이더는 근본적인 동인을 이해하는 것이 중요합니다.
- GBPUSD는 현재 1.33503달러에 거래되고 있으며, 이는 일일 변동률 -0.14%를 반영합니다.
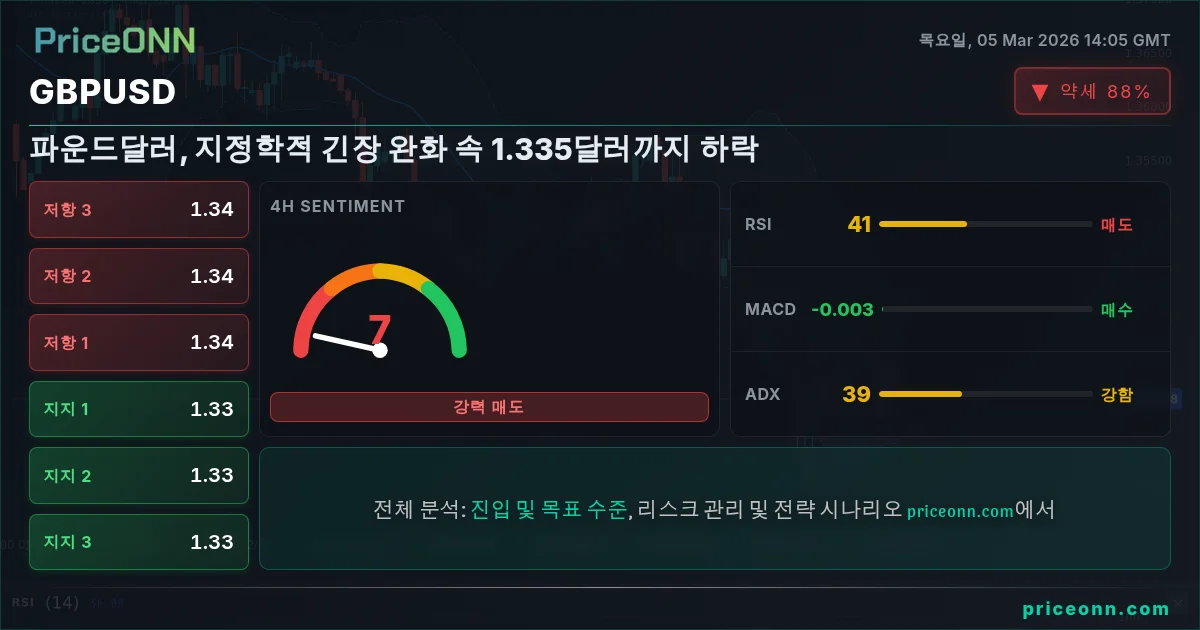
- 주요 지지선은 1.33136에, 저항선은 1.34132에 위치하여 단기 거래 기회를 형성합니다.
- ADX는 27.3으로 1D 시간대에서 강력한 하락 추세를 나타내며 추가 하락 가능성을 시사합니다.
- 지정학적 긴장과 중앙은행 기대감 변화는 GBPUSD의 현재 약세 모멘텀의 주요 동인입니다.
GBPUSD의 최근 하락은 미국과 이란 간의 지정학적 긴장이 완화되면서 안전 자산 통화에 대한 수요가 감소한 데 따른 것입니다. 최근 외환 분석에 따르면 이러한 지정학적 발전과 주요 경제 데이터 발표가 시장 전망을 형성하고 있습니다. 영국 중앙은행의 금리 인하에 대한 기대감 변화 또한 중요한 역할을 하며, 트레이더들은 최신 경제 지표에 따라 포지션을 조정하고 있습니다. GBP/USD 통화쌍은 미국과 이란 간의 긴장 완화와 영국 중앙은행에 대한 기대감 변화 속에 1.335까지 하락했습니다.
기본적인 관점에서 볼 때 영국 경제는 혼합된 신호에 직면해 있습니다. 고용 데이터는 비교적 견조하게 유지되고 있지만, 인플레이션 수치는 예상보다 끈적하게 유지되어 영국 중앙은행의 정책 전망을 복잡하게 만들고 있습니다. 특히 인플레이션 및 고용과 관련된 향후 경제 이벤트는 GBPUSD의 미래 방향을 결정하는 데 매우 중요할 것입니다. 이러한 요소들은 전반적인 파운드달러 거래 전략에 기여하며 진입 및 청산 시점에 대한 결정에 영향을 미칩니다.
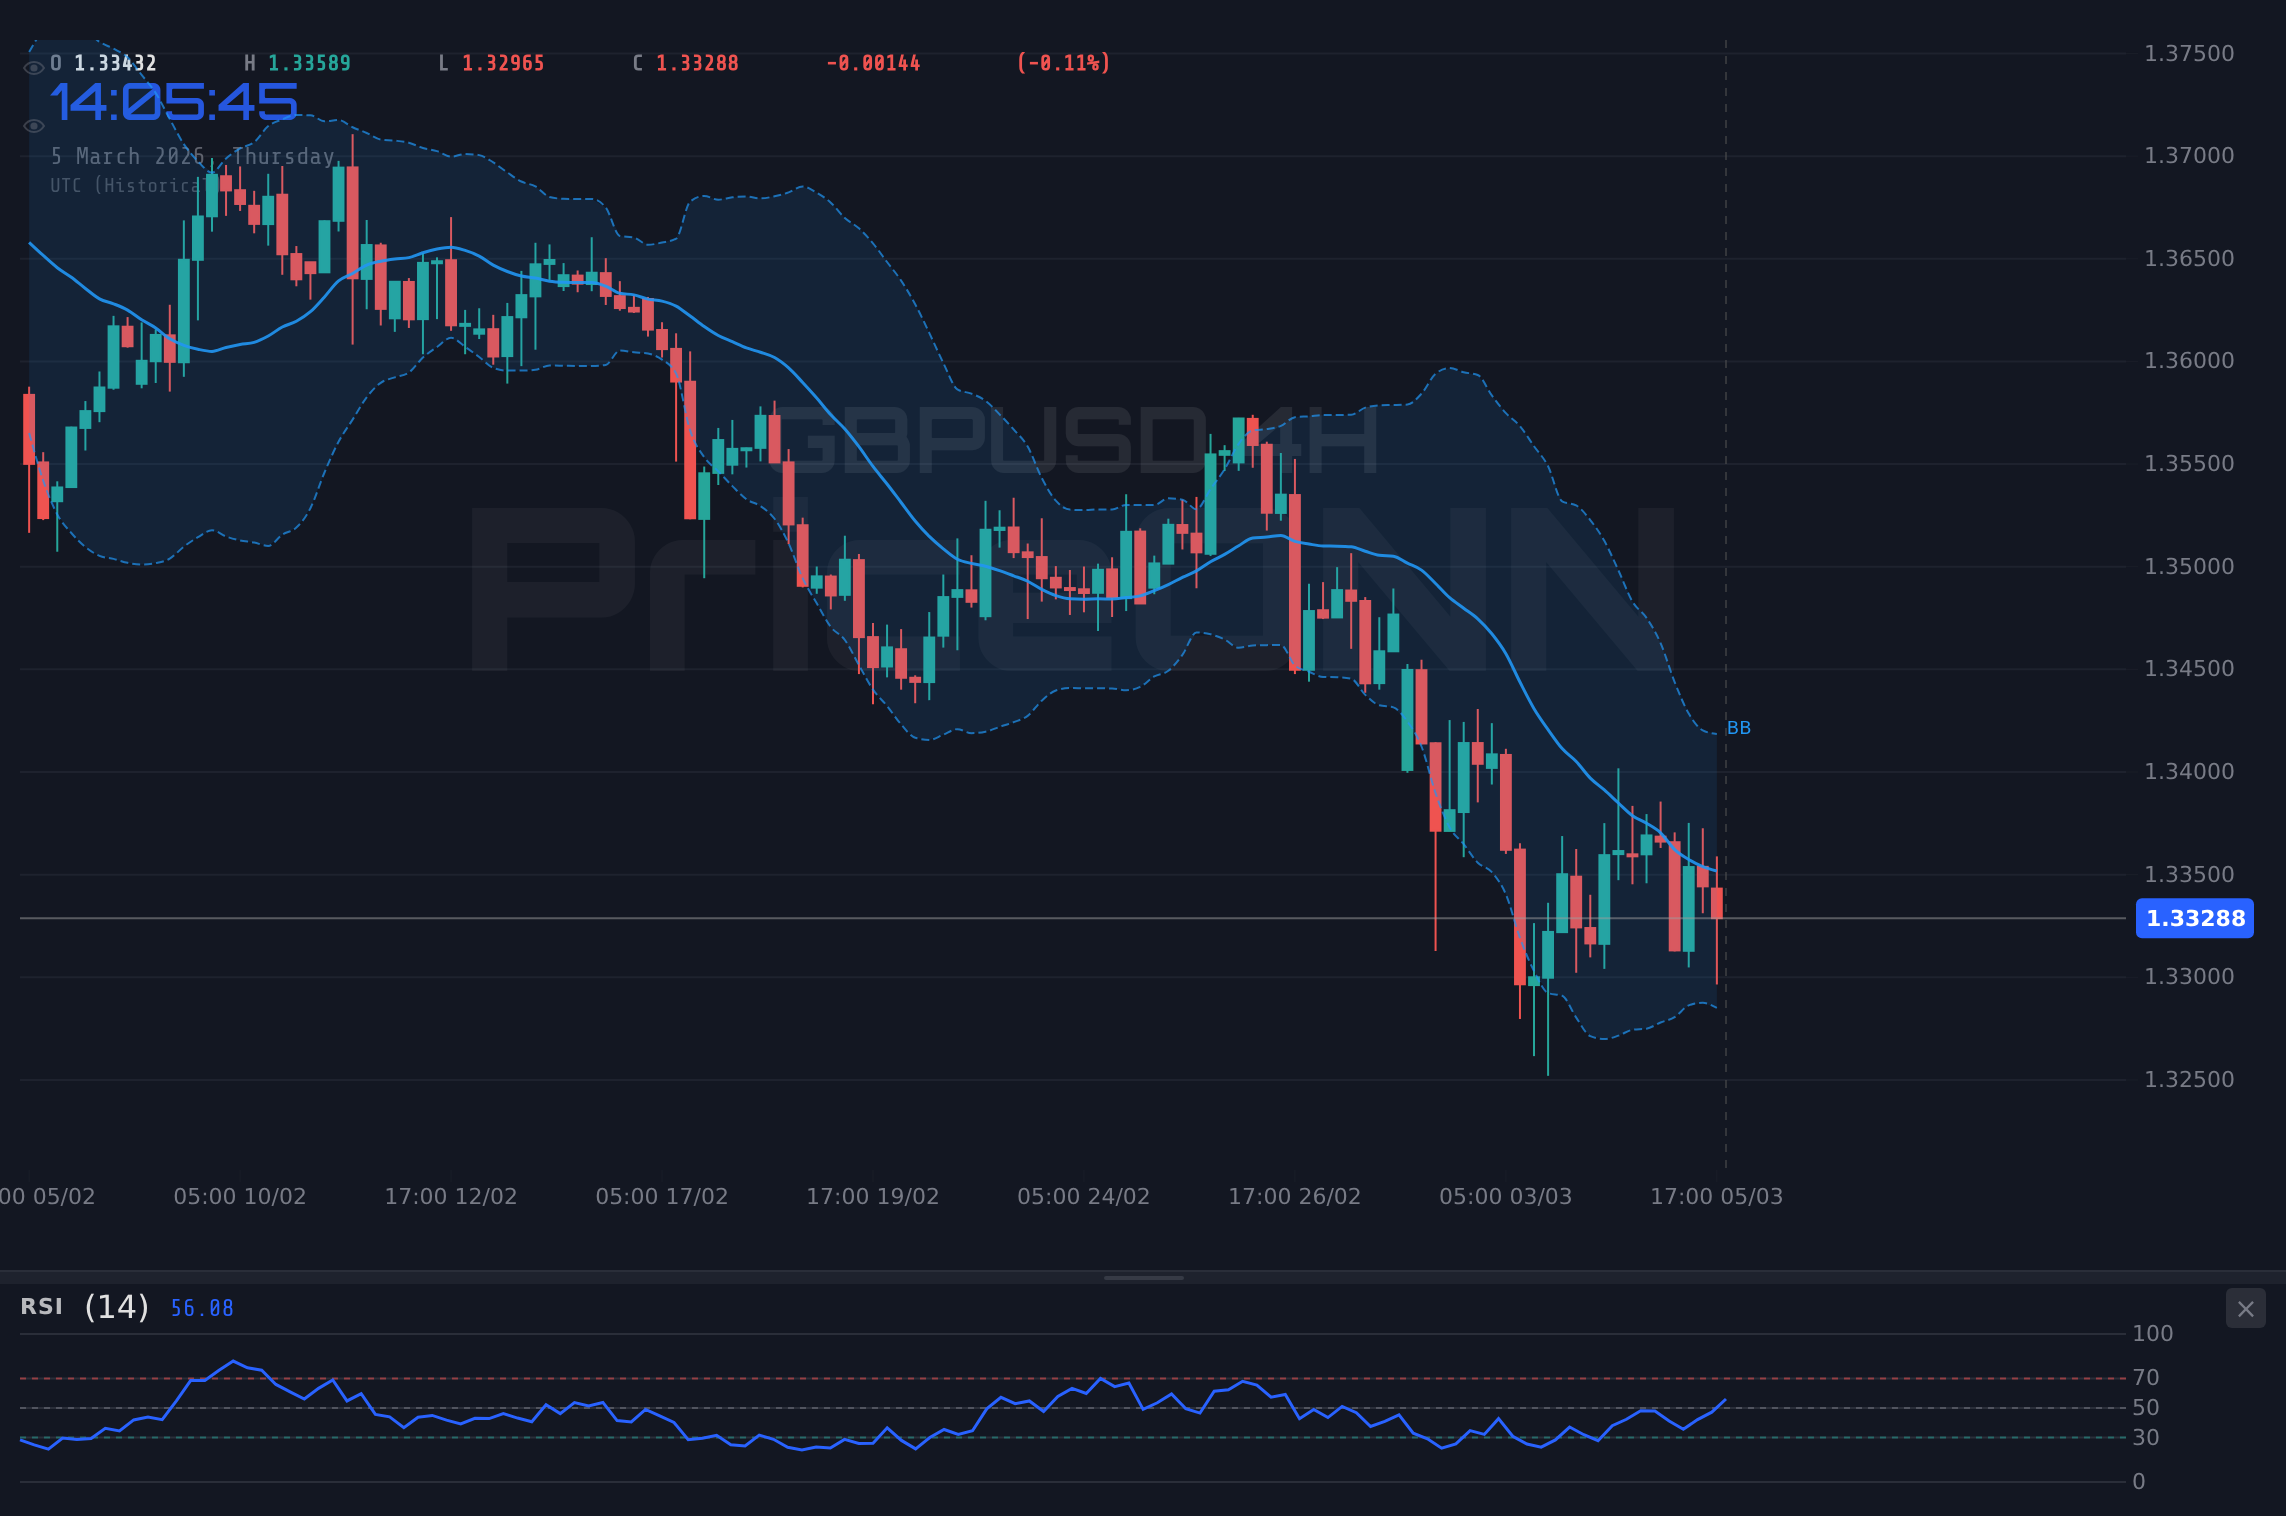
기술적인 그림을 살펴보면 일일 차트는 ADX가 27.3으로 강력한 하락 추세를 나타냅니다. RSI(14)는 36.15로 중립 영역에 있지만 하락 추세를 보이며 추가적인 약세 모멘텀의 가능성을 시사합니다. MACD 히스토그램은 음의 모멘텀을 보여주며 약세 전망을 강화합니다. Stochastic 지표는 잠재적인 강세 신호(%K > %D)를 보여주지만, 이를 신뢰할 수 있는 신호로 간주하려면 다른 지표의 확인이 필요합니다.
4H 시간대에서 ADX는 38.17로 강력한 하락 추세를 나타냅니다. RSI(14)는 43.48로 중립 영역에 있지만 하락 추세를 보입니다. MACD는 양의 모멘텀을 보여주며 통화쌍에 일시적인 유예를 제공할 수 있습니다. 그러나 전반적인 추세는 여전히 약세이며 트레이더는 Long 포지션 시작에 신중해야 합니다. 주시해야 할 주요 저항선은 1.33843, 1.3415, 1.34547입니다. 이러한 수준을 상회하면 잠재적인 추세 반전을 알릴 수 있지만 그때까지는 약세가 통제력을 유지합니다.
1H 시간대로 확대하면 추세는 중립적이며 ADX는 약한 12.62입니다. RSI(14)는 47.97로 과매수 또는 과매도 상태를 나타내지 않습니다. MACD 모멘텀은 균형을 이루고 있으며 잠재적인 통합 단계를 나타냅니다. 모니터링해야 할 지지선은 1.33545, 1.33428, 1.33338입니다. 이러한 수준은 단기 매수 기회를 제공할 수 있지만 전반적인 약세 추세는 모든 랠리가 단기적일 수 있음을 시사합니다.
달러 지수(DXY)는 현재 98.81로 일일 0.3% 증가했습니다. 이 강세 달러는 GBPUSD에 하락 압력을 가하고 있습니다. DXY가 계속 상승함에 따라 GBPUSD는 추가적인 역풍에 직면할 가능성이 높습니다. 트레이더는 GBPUSD에 대한 잠재적 영향을 측정하기 위해 DXY의 움직임을 면밀히 모니터링해야 합니다. SP500으로 표시되는 위험 선호도는 감소하고 있으며 SP500은 현재 6838.25로 0.47% 하락했습니다. 이러한 위험 회피 환경은 미국 달러와 같은 안전 자산 통화를 선호하는 경향이 있어 GBPUSD에 대한 약세 전망에 더욱 기여합니다.
다양한 뉴스 매체에서 보도한 바와 같이 에너지 위기와 중동의 지정학적 긴장이 시장의 불확실성을 더하고 있습니다. 석유 생산 중단 및 수출 중단은 에너지 시장에 상당한 변동성을 야기하고 있으며, 이는 간접적으로 통화 가치 평가에 영향을 미칩니다. 최근 보고서에 따르면 호르무즈 해협 폐쇄와 카타르 LNG 생산 중단으로 유럽 가스 가격이 급등하여 해당 지역의 경제적 압력이 가중되고 있습니다.
경제 캘린더를 고려할 때 향후 영향력이 큰 이벤트는 트레이더들이 면밀히 주시할 것입니다. 이러한 데이터 발표에서 발생하는 모든 놀라운 결과는 GBPUSD에서 상당한 변동성을 유발할 수 있습니다. 트레이더는 잠재적인 가격 변동에 대비하고 그에 따라 전략을 조정해야 합니다. 실제 데이터는 현재 경제 궤적과 통화 가치 평가에 미치는 영향을 이해하는 데 핵심이 될 것입니다.
기술적 및 기본적 전망을 고려할 때 여러 파운드달러 거래 전략 고려 사항이 나타납니다. Scalper는 저항선 주변에서 단기 매도 기회를 찾을 수 있는 반면, 스윙 트레이더는 지지선 아래로 확인된 돌파를 기다려 더 큰 포지션을 시작할 수 있습니다. 장기 투자자는 전반적인 추세가 약세로 유지되고 모든 랠리가 일시적일 수 있으므로 신중해야 합니다.
요약하면 GBPUSD의 현재 약세 추세는 지정학적 긴장 완화, 영국 중앙은행 금리 인하에 대한 기대감 변화, 달러 강세, 위험 회피 환경 등 여러 요인의 조합에 의해 주도됩니다. 트레이더는 정보에 입각한 거래 결정을 내리기 위해 주요 경제 데이터 발표, 중앙은행 정책 및 지정학적 발전을 신중하게 모니터링해야 합니다. Stochastic 지표는 잠재적인 강세 신호를 보여주지만, 이를 신뢰할 수 있는 신호로 간주하려면 다른 지표의 확인이 필요합니다.
자주 묻는 질문: GBPUSD 분석
지금 GBPUSD를 매수하는 것이 좋은가요?
아니요, 현재 약세 추세와 부정적인 모멘텀을 감안할 때 지금 GBPUSD를 매수하는 것은 좋지 않습니다. 가격은 1.33503달러이며 ADX가 27.3으로 강력한 하락 추세를 나타내므로 추가 하락 가능성이 높습니다.
이번 주 GBPUSD 가격 예측은 어떻게 되나요?
이번 주 GBPUSD 가격 예측은 약세로 기울어져 있으며 지지선 1.33136 주변에 잠재적인 목표가 있습니다. 이 수준 아래로 하락하면 추가 하락으로 이어질 수 있지만 위험 심리가 바뀌면 반등이 가능합니다.
GBPUSD의 주요 지지선과 저항선은 무엇인가요?
GBPUSD의 주요 지지선은 1.33136, 1.32581, 1.3214이고 주요 저항선은 1.34132, 1.34573, 1.35128입니다. 이러한 수준은 일일 시간대에서 파생되었으며 잠재적인 진입 및 청산 지점으로 사용될 수 있습니다.
오늘 GBPUSD가 움직이는 이유는 무엇인가요?
GBPUSD는 오늘 지정학적 긴장 완화와 영국 중앙은행 금리 인하에 대한 기대감 변화를 포함한 여러 요인의 조합으로 인해 움직이고 있습니다. 또한 달러 강세와 위험 회피 환경이 약세 모멘텀에 기여하고 있습니다.
기술적 전망 요약
| 지표 | 값 | 신호 |
|---|---|---|
| RSI (14) | 36.15 | 약세 |
| MACD 히스토그램 | 음수 | 약세 |
| Stochastic | 31.97 | 강세 |
| ADX | 27.3 | 강력한 추세 |
| Bollinger | 중간 밴드 | 약세 |