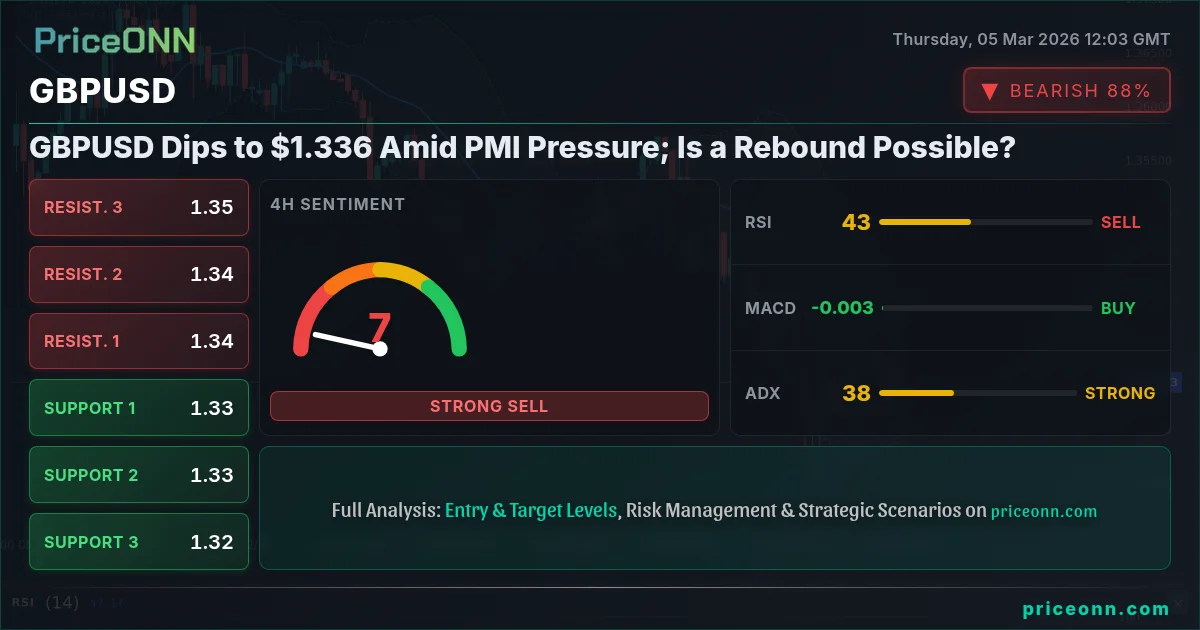
The GBPUSD pair is currently trading at $1.33598, experiencing a slight dip of -0.07% on the day. This move comes amid a confluence of factors, including easing geopolitical tensions and concerns arising from recent PMI data. The question now is whether this pullback represents a buying opportunity or the start of a more sustained downtrend. The technical picture is mixed, with the pair hovering near key support levels, making the next few trading sessions crucial for determining the short-term direction.
- RSI at 49.87 on the 1H chart indicates neutral conditions, suggesting potential for either a bounce or further decline.
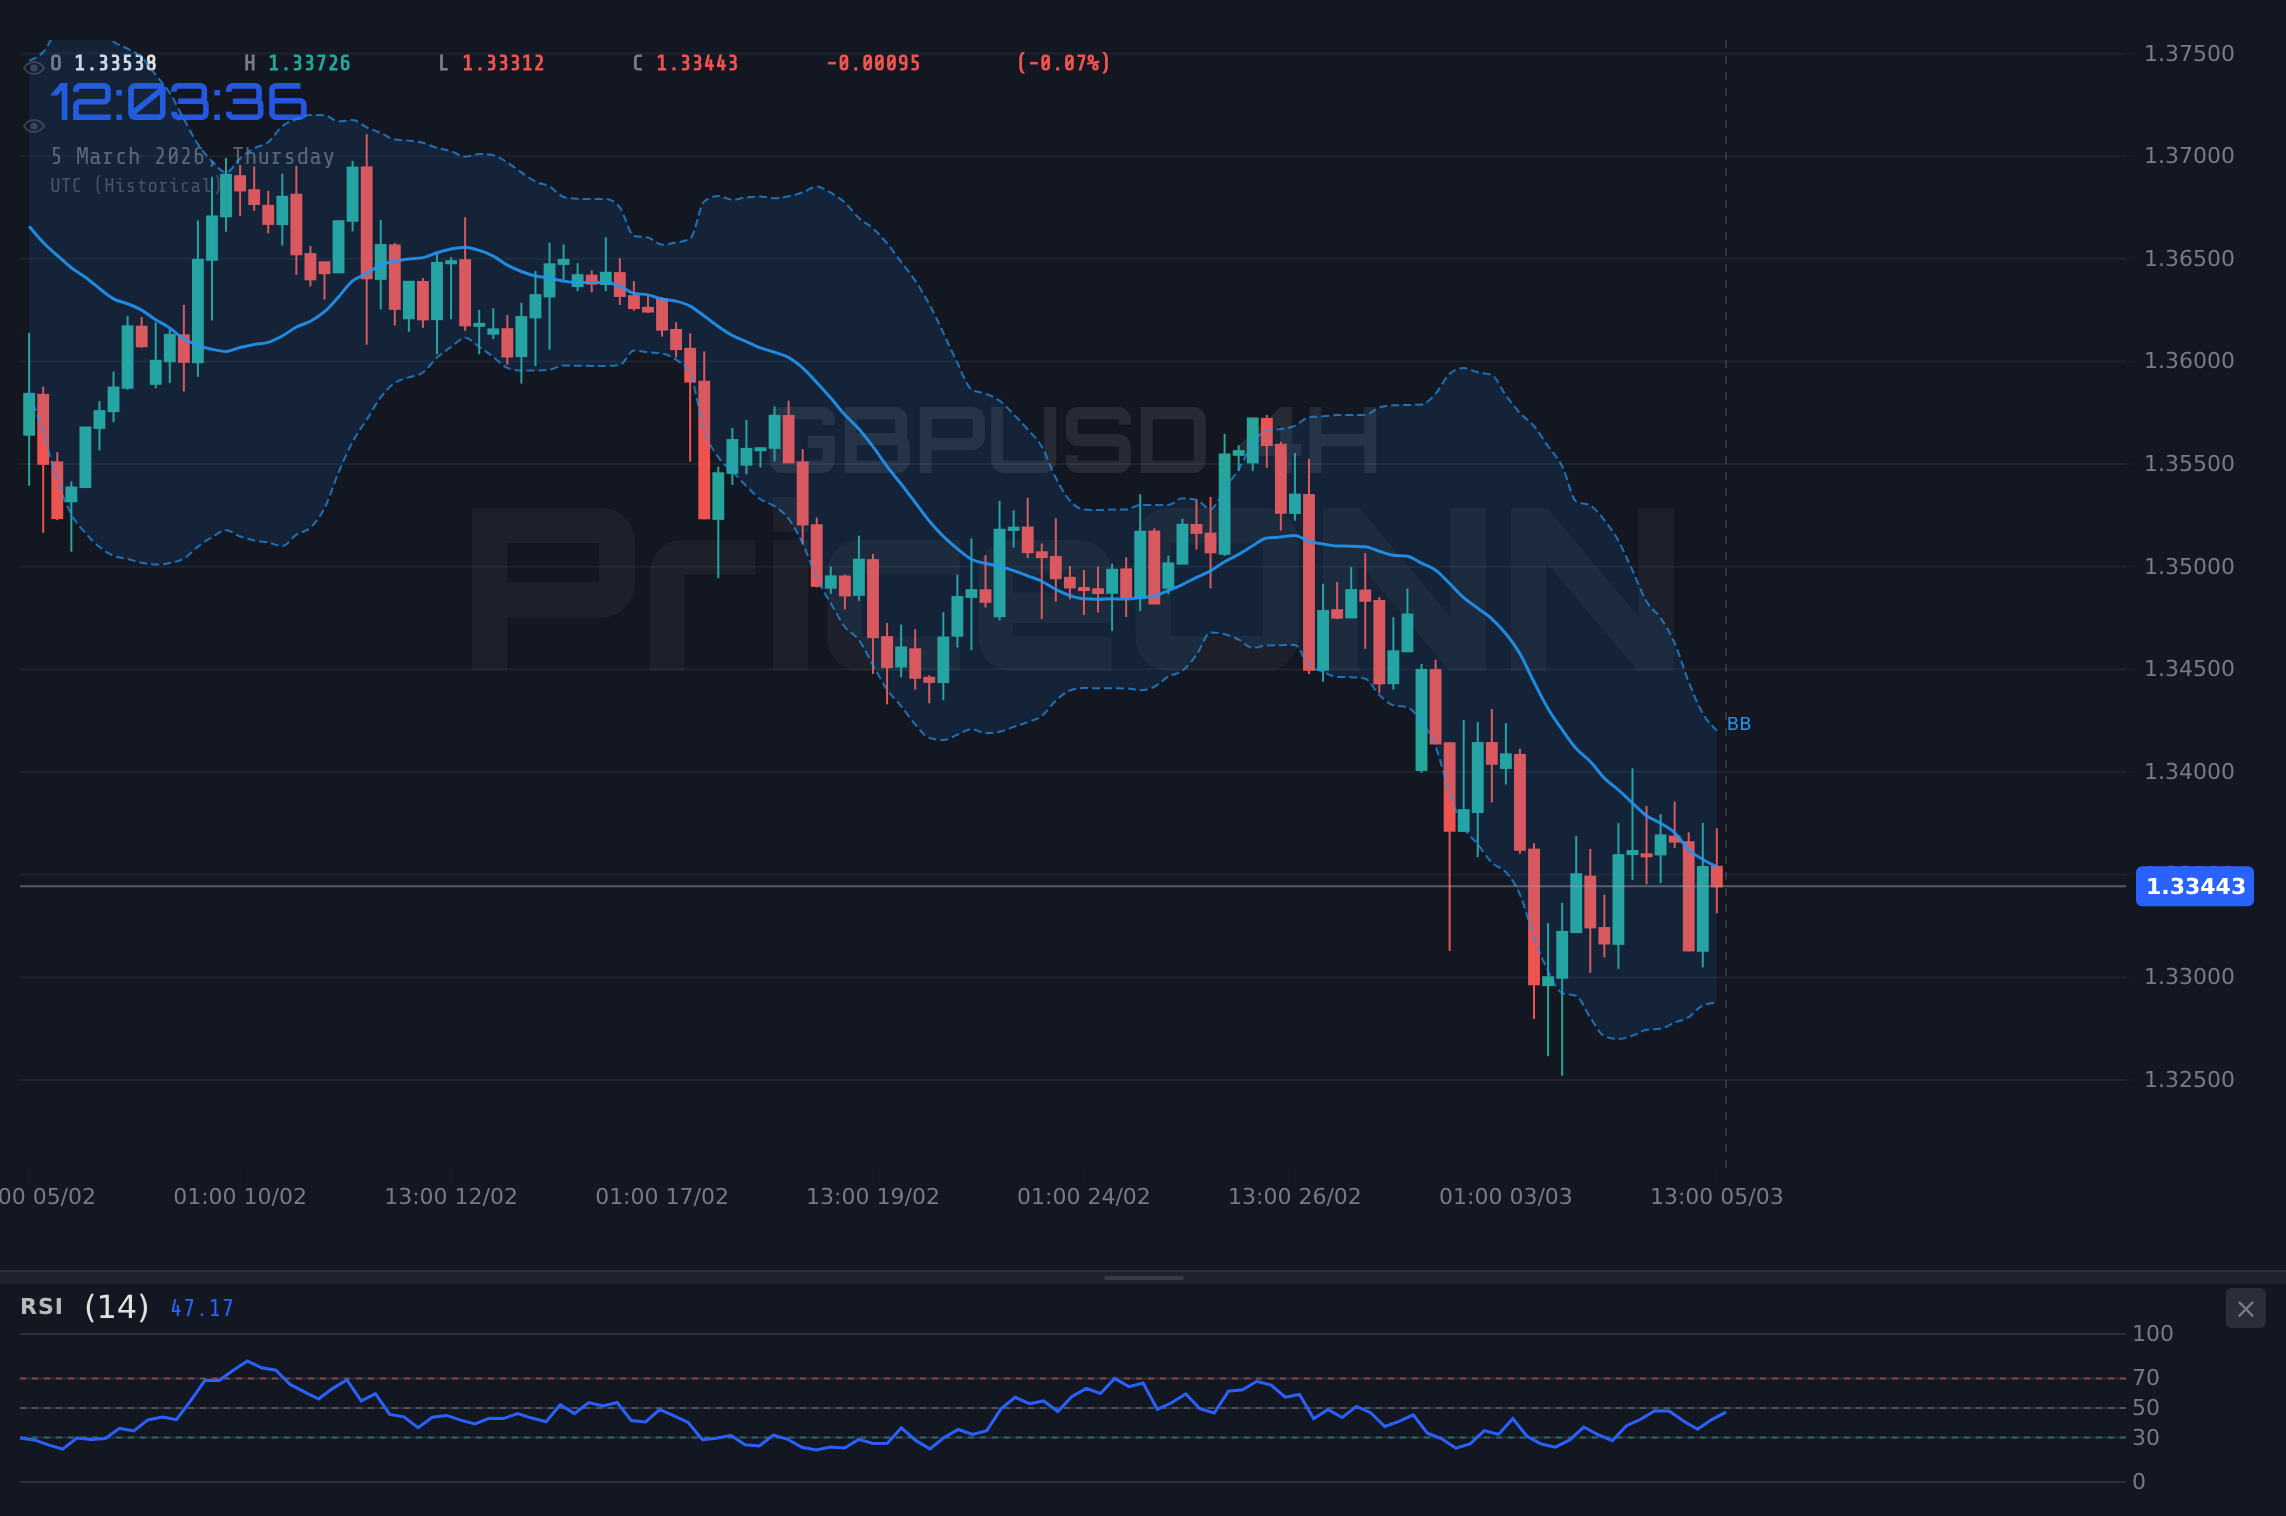
- Key support level lies at 1.33248; a break below could accelerate selling pressure.
- MACD histogram on the 1H is showing negative momentum, signaling caution for bullish positions.
- Easing geopolitical tensions and weaker-than-expected PMI data are weighing on GBPUSD.
GBPUSD Technical Analysis: Navigating Choppy Waters
A closer look at the technical indicators reveals a nuanced picture. On the 1-hour timeframe, the Relative Strength Index (RSI) sits at 49.87, residing in neutral territory. This suggests that neither the bulls nor the bears have a firm grip on the market, leaving room for potential volatility. The Moving Average Convergence Divergence (MACD) histogram, however, is displaying negative momentum, indicating that selling pressure might be gaining traction. This divergence between the RSI and MACD highlights the current uncertainty surrounding GBPUSD's direction. For scalpers, this calls for caution, waiting for clearer signals before committing to a trade. Swing traders might look for a decisive break of either support or resistance to establish a position.
Examining the 4-hour chart, the trend is classified as bearish with a strength of 94%, a more decisive signal than the 1H timeframe. The RSI on this timeframe is at 44.85, still neutral but leaning towards oversold conditions. The MACD, conversely, shows positive momentum, which is conflicting with the identified trend. This conflict might signal a potential retracement before the downtrend continues, or it could mean a longer period of consolidation. The Average Directional Index (ADX) on the 4H timeframe is at 38.29, indicating a strong trend. The trend strength detected, however, is conflicting with the overall neutral signals. For long-term investors, these mixed signals suggest that patience is key, and waiting for a more definitive trend to emerge is advisable.
Stepping back to the daily timeframe, the trend is still bearish, but with a slightly weaker strength of 89%. The RSI is at 36.94, hinting at oversold conditions, although not yet extreme. The MACD mirrors the 4H with negative momentum, and the Stochastic oscillator indicates a potential upward movement with %K greater than %D. The ADX is at 27.3, again showing a strong trend. On the daily chart, this might mean that the pair is in a longer-term downtrend, but is currently experiencing a short-term bounce. This further reinforces the idea that swing traders may have opportunities to capitalize on short-term moves, while long-term investors should remain cautious.
Key price levels to watch include the immediate support at 1.33248 on the 1H timeframe. A break below this level could open the door to further declines towards 1.32959. On the upside, resistance is seen at 1.33789, and a successful breach of this level could signal a potential bullish reversal. These levels are critical for both scalpers and swing traders to monitor, as they could act as catalysts for significant price movements. The daily support at 1.33136 and resistance at 1.34132 provide a wider framework for long-term investors to assess the overall trend.
The Impact of Macroeconomic Factors and Geopolitical Tensions
The recent dip in GBPUSD is not solely attributable to technical factors. Easing geopolitical tensions, as reported by Forex News outlets, have reduced the demand for safe-haven currencies like the US dollar, indirectly impacting GBPUSD. Furthermore, disappointing PMI data released earlier this week has raised concerns about the strength of the UK economy. This macroeconomic backdrop adds another layer of complexity to the technical picture, making it crucial to consider both fundamental and technical factors when making trading decisions. The upcoming economic data releases, particularly those related to inflation and employment, will likely play a significant role in shaping GBPUSD's direction in the coming weeks.
The dollar index (DXY) is currently trading at 98.68, showing a slight increase of 0.18% on the day. A strengthening dollar typically puts downward pressure on GBPUSD, and this inverse correlation is currently playing out. The SP500 is showing a decrease of -0.17%, signaling a slight decrease in risk appetite. This may provide some support for the US dollar, further weighing on GBPUSD. With DXY at 98.68, GBPUSD is facing increased downward pressure. However, it is important to note that correlations are not always perfect, and other factors can influence GBPUSD's price action. The WTI crude oil is showing a 1.5% increase, trading at $77.17, signaling increased inflationary pressures. A rise in oil prices may impact the UK economy, adding another layer of complexity to GBPUSD dynamics.
Having tracked GBPUSD throughout the 2024 rate cycle, I've observed that conflicting signals often lead to periods of consolidation, followed by sharp breakouts in either direction. The current situation appears to be mirroring this pattern, with mixed technical indicators and conflicting macroeconomic signals creating a sense of uncertainty. Historically, when the RSI reaches current levels on GBPUSD, the outcome has been highly dependent on the broader market context. A confluence of positive economic data and easing geopolitical tensions has often led to bullish reversals, while negative data and heightened tensions have triggered further declines. This pattern last appeared in January 2025, when price subsequently broke down after a period of consolidation.
GBPUSD Trade Plan: Bearish Momentum or Buying Opportunity?
Given the current technical and fundamental landscape, I am leaning towards a cautious bearish outlook for GBPUSD. The strong bearish trend on the 4H chart and the negative momentum on the 1H chart suggest that selling pressure is likely to persist in the short term. However, the oversold conditions on the daily chart and the potential for a retracement on the 4H chart cannot be ignored. Therefore, I recommend a wait-and-see approach, monitoring key price levels and economic data releases before committing to a trade.
Continued bearish momentum if price breaks below 1.33248, targeting 1.32959 and potentially 1.32707.
A bullish reversal if price breaks above 1.33789, targeting 1.34041 and potentially 1.3433.
A potential trade setup could involve shorting GBPUSD on a break below 1.33248, with a stop-loss placed above 1.33789. The initial target would be 1.32959, with a secondary target at 1.32707. This trade offers a reasonable risk-reward ratio, but it is crucial to manage risk carefully and monitor economic data releases. Alternatively, a more conservative approach would be to wait for a confirmed bullish reversal before entering a long position. This could involve waiting for a break above 1.33789, followed by a successful retest of this level as support.
Frequently Asked Questions: GBPUSD Analysis
Is GBPUSD a good buy right now?
Given the current price of $1.33598 and the mixed technical signals, GBPUSD is not a clear buy right now. A break above the 1.33789 resistance could present a buying opportunity, but caution is warranted due to the bearish trend on the 4H chart.
What is the GBPUSD price forecast for this week?
The GBPUSD price forecast for this week is highly uncertain, but a break below 1.33248 could lead to further declines towards 1.32959. Conversely, a break above 1.33789 could signal a potential bullish reversal, targeting 1.34041. The probability of each scenario is roughly 50/50.
What are the key support and resistance levels for GBPUSD?
Key support levels for GBPUSD are 1.33248, 1.32959, and 1.32707. Key resistance levels are 1.33789, 1.34041, and 1.3433. These levels are based on the 1H timeframe and could serve as potential entry or exit points for traders.
Why is GBPUSD moving today?
GBPUSD is moving today due to a combination of factors, including easing geopolitical tensions and concerns arising from recent PMI data. The strengthening dollar, as reflected in the DXY, is also contributing to the downward pressure on GBPUSD.
Technical Outlook Summary
| Indicator | Value | Signal |
|---|---|---|
| RSI (14) | 49.87 | Neutral |
| MACD Histogram | Negative | Bearish |
| Stochastic | 49.62 / 29.19 | Bullish |
| ADX | 13.64 | Weak Trend |
| Bollinger | Mid Band | Watch |
Key Levels
Support Levels
Resistance Levels
Track markets in real-time
AI-powered analysis, technical indicators and real-time price data.
Join Our Telegram Channel
Breaking market news, AI analysis and trading signals instantly.
Join Channel