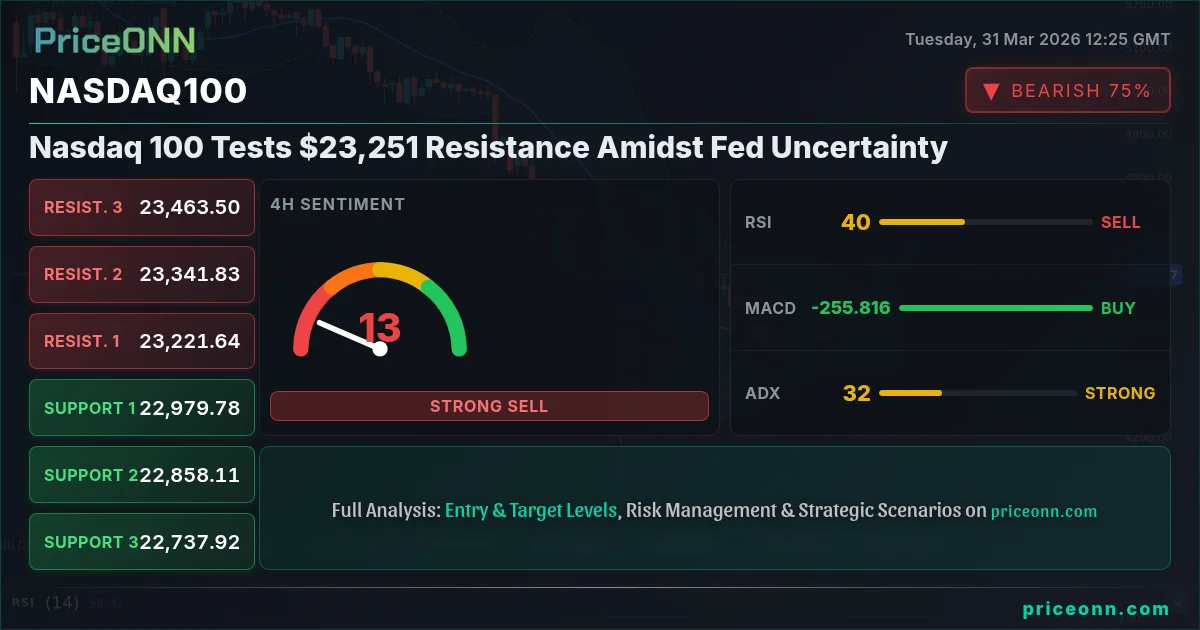
Nasdaq 100 Tests $23,251 Resistance Amidst Fed Uncertainty
Nasdaq 100 hovers near $23,168.76, testing resistance as traders weigh inflation data and Fed policy signals. Technicals show mixed signals.
Amidst a complex tapestry of global economic crosscurrents, the Nasdaq 100 index is currently navigating a crucial technical juncture, hovering near the $23,168.76 mark and challenging key resistance levels. This pivotal moment arrives as traders and analysts scrutinize the latest inflation data and decipher the nuanced signals from the Federal Reserve, attempting to gauge the future trajectory of monetary policy and its ripple effects across the tech-heavy index. The interplay between macroeconomic pressures, geopolitical undercurrents, and the intrinsic dynamics of the tech sector creates a challenging environment for investors, demanding a keen eye for detail and a robust understanding of the forces at play.
- Nasdaq 100 is trading near $23,168.76, approaching significant resistance at $23,251.
- RSI at 52.9 signals neutral momentum with a slight upward tendency, indicating room for further gains but caution is advised.
- ADX at 14.22 suggests a weak trend, implying that any breakout might lack strong conviction without further confirmation.
- The correlation with the DXY, currently at 100.05, is a key factor; a weaker dollar could support the index, while strength adds headwinds.
The Nasdaq 100's current position, inching towards the $23,251 resistance zone, highlights a market grappling with conflicting narratives. On one hand, the resilience shown by major tech stocks and a generally positive risk sentiment have pushed the index higher. On the other hand, persistent inflationary pressures and the Federal Reserve's hawkish undertones create a persistent overhang, suggesting that the path forward may be fraught with volatility. Understanding this duality is paramount for navigating the current market landscape. This analysis delves into the technical indicators, macroeconomic drivers, and potential scenarios that will shape the Nasdaq 100's performance in the coming days and weeks, offering a comprehensive outlook for investors.
Navigating the Macroeconomic Crosscurrents
Inflationary Pressures and the Fed's Dilemma
The global economic narrative remains heavily influenced by the persistent specter of inflation. Recent data, while showing some moderation, continues to signal that price pressures are not entirely abating, posing a significant challenge for central banks, particularly the U.S. Federal Reserve. The Fed finds itself in a delicate balancing act: taming inflation without triggering a sharp economic downturn. The current market data shows the DXY (Dollar Index) trading at 100.05, indicating a relatively stable dollar, which can exert pressure on risk assets like the Nasdaq 100. A stronger dollar typically makes U.S. exports more expensive and can reduce the attractiveness of U.S. assets for foreign investors. However, the Nasdaq 100's upward trajectory suggests that other factors, such as strong corporate earnings or a general risk-on sentiment, are currently outweighing the dollar's influence. The question remains whether this resilience can be sustained if inflation proves more stubborn than anticipated, forcing the Fed into a more aggressive policy stance.
The market is keenly watching for any signals that might indicate a shift in the Fed's monetary policy. While the current data doesn't provide explicit forward guidance on rate hikes or cuts, the underlying economic conditions are crucial. Persistent inflation could necessitate higher-for-longer interest rates, which would typically act as a headwind for growth stocks that dominate the Nasdaq 100. These companies often rely on borrowing to fund expansion, and higher rates increase their cost of capital. Conversely, if inflation shows signs of cooling significantly, it could open the door for the Fed to consider rate cuts sooner rather than later, providing a potential tailwind for the index. The market's interpretation of incoming economic data, from employment figures to consumer price indices, will be critical in shaping these expectations.
Geopolitical Tensions and Their Impact on Risk Appetite
Adding another layer of complexity to the market's outlook are the ongoing geopolitical tensions, particularly the conflict in the Middle East and its impact on energy prices. Reports indicate that Brent crude oil prices are surging towards $120, a level that historically correlates with increased inflationary fears and a potential dampening of risk appetite. WTI crude is also trading significantly, currently at $103.44, reflecting these supply-side concerns. Higher energy costs can directly impact corporate profitability across various sectors, including technology, by increasing operating expenses. Furthermore, elevated energy prices can contribute to broader inflation, forcing central banks to maintain tighter monetary policies for longer periods. This creates a challenging environment for growth-oriented indices like the Nasdaq 100, which tend to perform best in periods of economic stability and low inflation.
The ripple effect of these geopolitical events extends beyond just energy prices. They can create broader uncertainty and volatility across financial markets, leading investors to seek safer assets. While the Nasdaq 100 has shown resilience, a significant escalation of geopolitical risks could trigger a flight to quality, potentially benefiting assets like gold (currently at $4579.08) or U.S. Treasury yields, while weighing on equities. The correlation between oil prices and inflation is a well-established phenomenon, and as Brent crude pushes higher, the market will be increasingly sensitive to any signs of demand destruction or a de-escalation in the conflict. The resilience of the Nasdaq 100 in the face of these headwinds is notable, but the sustainability of this trend will largely depend on how these geopolitical factors evolve and their subsequent impact on inflation and central bank policy.
Technical View: Nasdaq 100 at a Crossroads
Short-Term Momentum and Key Levels
On the 1-hour timeframe, the Nasdaq 100 shows a neutral trend with a power of 50%. The RSI(14) is at 52.9, indicating neutral momentum with a slight upward tendency, suggesting there might be room for further gains before hitting overbought territory. However, the ADX, a measure of trend strength, is at a mere 14.22. This low reading suggests that the current trend lacks conviction. A weak trend reading like this means that any breakout above current levels might not be sustained without significant follow-through, and the market could be prone to reversals or range-bound trading. The MACD is showing positive momentum, with the MACD line above the signal line, which is generally a bullish sign, but the overall picture is one of caution rather than outright bullishness.
The immediate resistance for the Nasdaq 100 on the 1-hour chart is identified at $23,251, with further levels at $23,341.83 and $23,463.5. On the downside, support is seen at $23,149.85, followed by $23,056.6 and $22,979.78. The Stochastic Oscillator, with K=54.16 and D=41.35, indicates a potential downward signal as %K is above %D, but the divergence is not yet pronounced. The Bollinger Bands are trading above the middle band, suggesting an upward bias in the short term, but the lack of strong trend indicated by the ADX means that these short-term moves could be prone to sharp reversals. Traders will be watching the $23,251 level closely; a convincing break above this could signal further upside, while a rejection might lead to a retest of near-term supports.
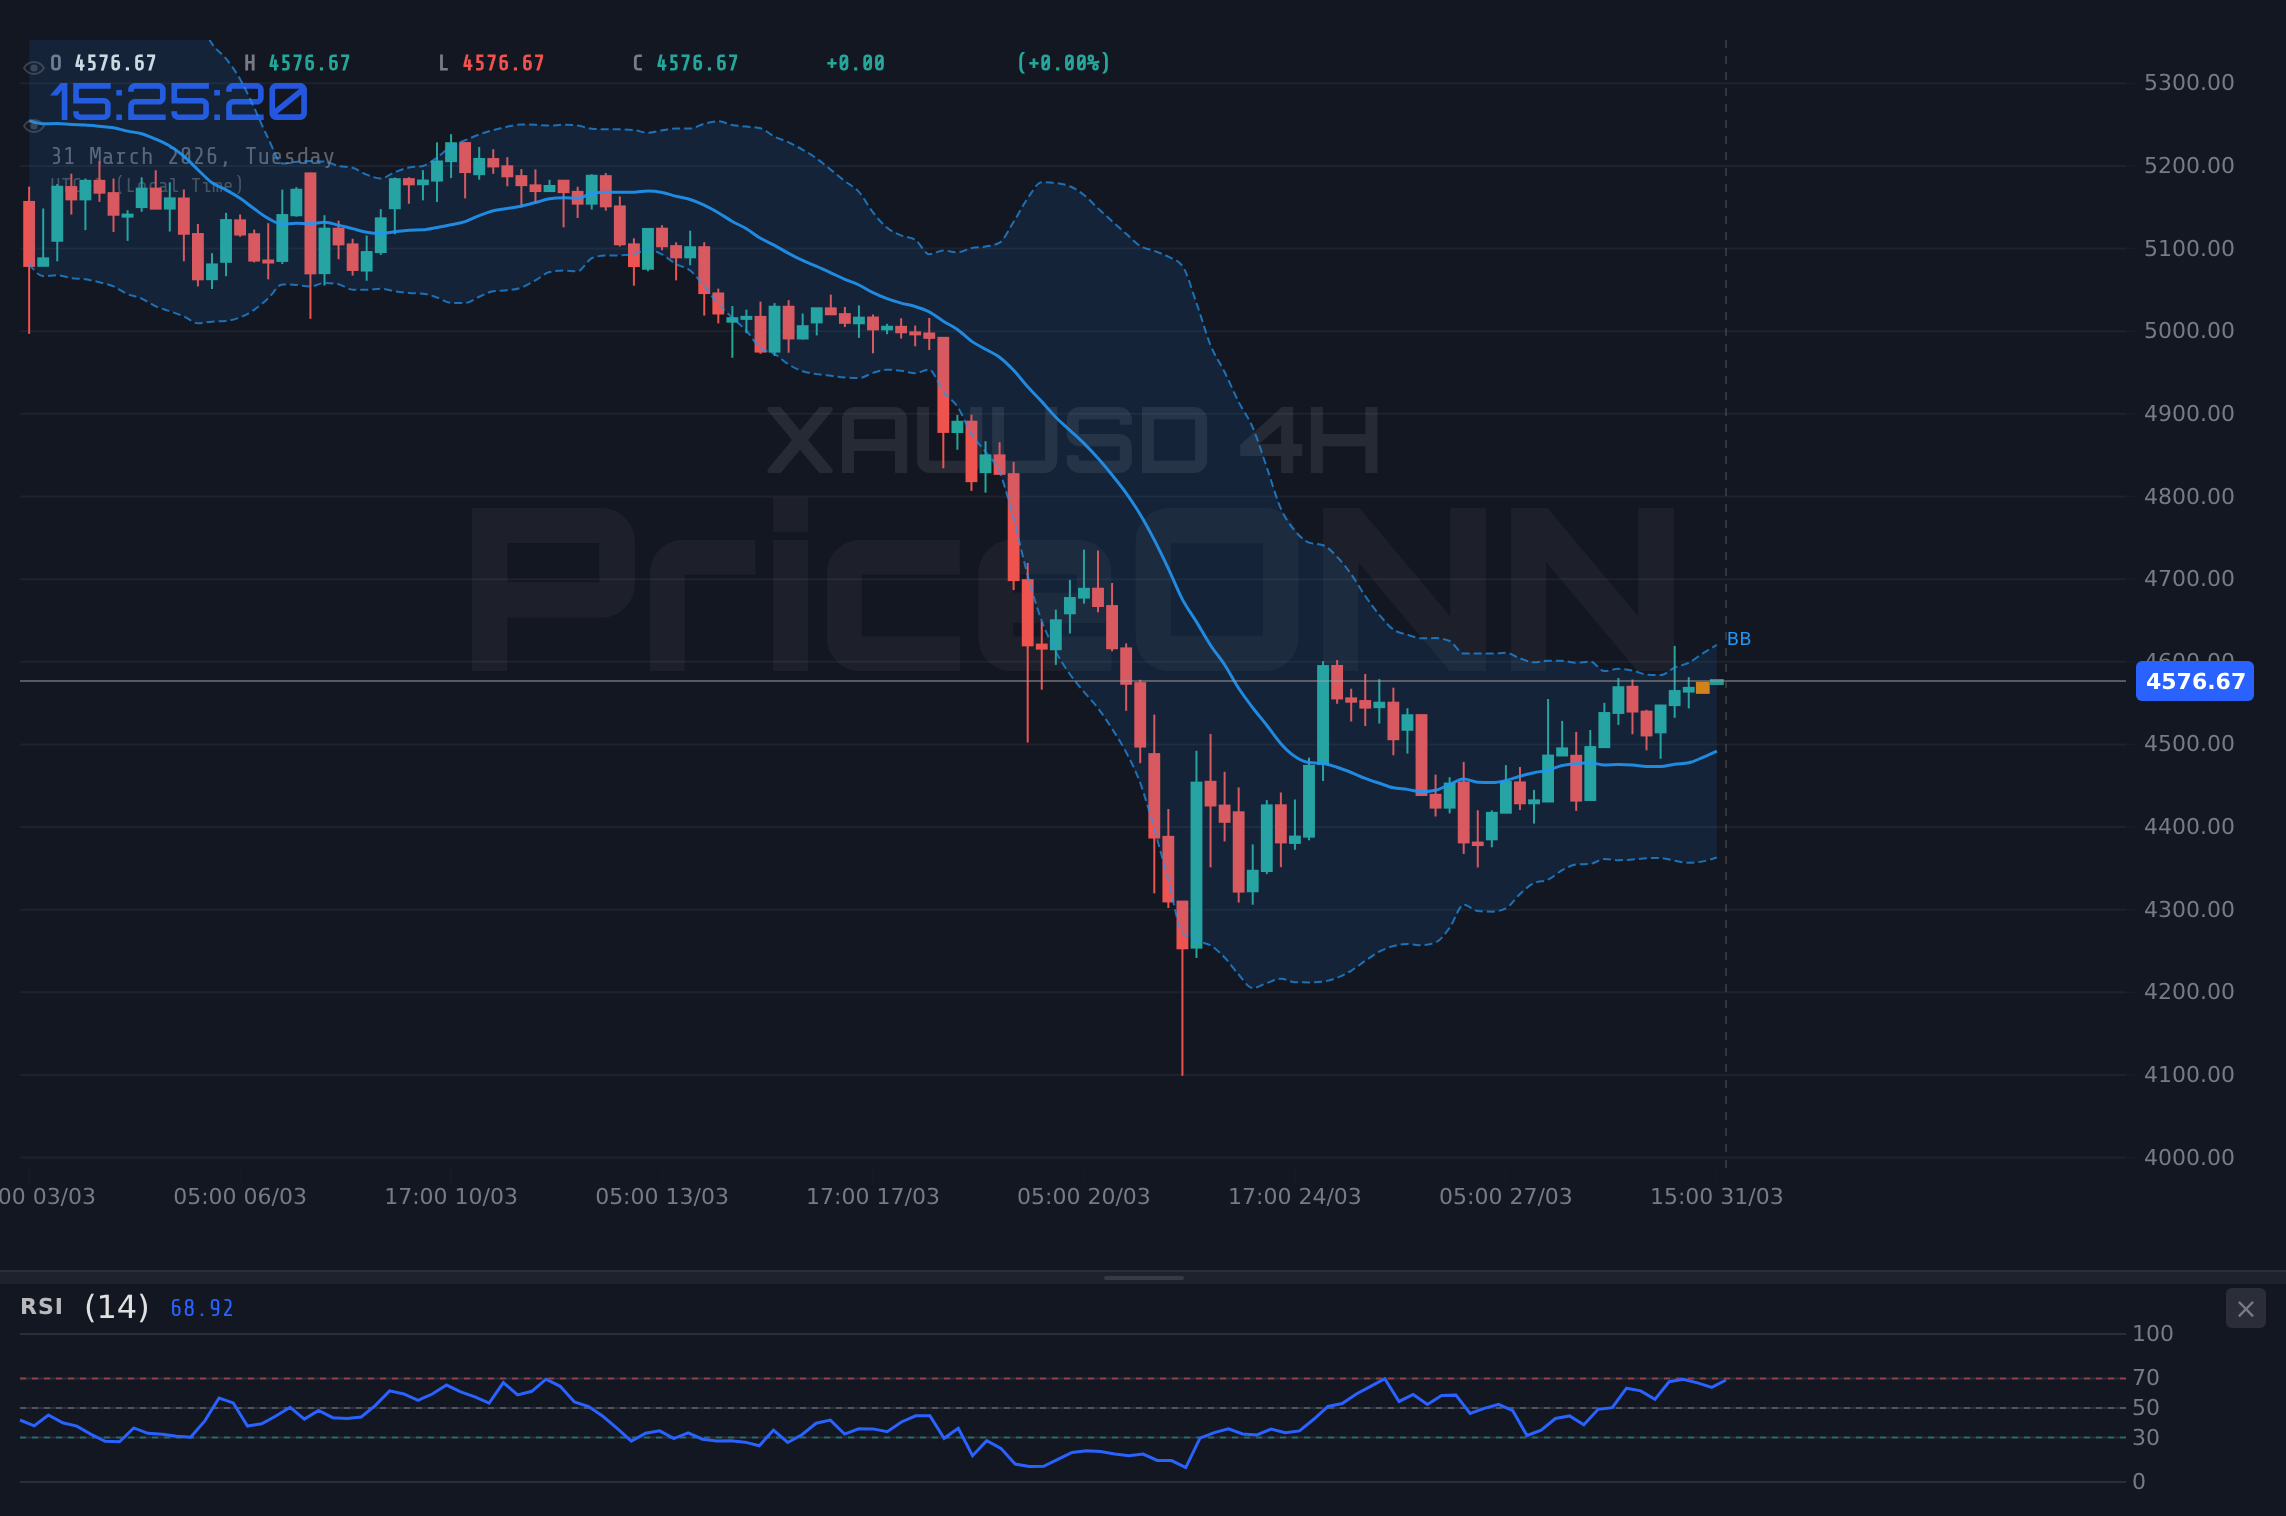
Medium-Term Outlook: 4-Hour Chart Insights
Shifting to the 4-hour timeframe, the Nasdaq 100 exhibits a neutral trend with a power of 50%, mirroring the short-term outlook but with subtle differences. The RSI(14) stands at 39.67, which is firmly in the neutral zone but leaning towards oversold conditions, suggesting potential for a bounce. However, the MACD is displaying positive momentum, with the MACD line above the signal line, contradicting the RSI's bearish lean. This divergence is a critical point for traders to note. The ADX at 31.91 indicates a strong downward trend, which seems counterintuitive given the current price action and other indicators. This could suggest that the market is in a strong downtrend, but currently experiencing a temporary upward correction or consolidation. The Stochastic Oscillator shows K=51.92 and D=35.07, with %K above %D, signaling a potential bullish move, though the values are not in extreme territory.
The key support levels on the 4-hour chart are $23,056.6, $22,979.78, and $22,858.11. Resistance is marked at $23,243.1, $23,341.83, and $23,463.5. The Bollinger Bands are trading below the middle band, which, combined with the ADX reading, reinforces the idea of a potential downtrend. However, the Stochastic's bullish crossover and the MACD's positive momentum suggest that a short-term upward move is possible. This conflicting signal environment underscores the importance of confirmation. A sustained move above the $23,251 resistance level would be needed to challenge the prevailing downward bias indicated by the ADX and Bollinger Bands on this timeframe. Failure to do so could see the index retreat towards the identified support levels.
Daily Chart Perspective: The Underlying Trend
On the daily chart, the Nasdaq 100 presents a more bearish picture, with a trend strength of 100% indicating a firmly established downward trend. The RSI(14) at 32.47 is deep in oversold territory, typically signaling that a potential reversal or significant bounce could be on the horizon. However, RSI alone is not a buy signal; it merely indicates that the asset has experienced considerable selling pressure. The MACD is showing negative momentum, with the MACD line below the signal line, reinforcing the bearish sentiment. The ADX at 49.33 is exceptionally high, indicating a very strong downward trend. This suggests that any upward price action is likely to be a counter-trend move within a larger bearish structure.
The critical support levels on the daily chart are $22,716.56, $22,511.48, and $22,181.87. Resistance is situated at $23,251.25, $23,580.86, and $23,785.94. The Bollinger Bands are trading below the middle band, aligning with the strong bearish trend indicated by the ADX. The Stochastic Oscillator, with K=9.26 and D=22.29, is in extreme oversold territory and shows a bullish crossover (%K > %D), suggesting that a bounce from these levels is statistically probable. However, the overwhelming strength of the daily downtrend, as evidenced by the ADX, means that any such bounce may be short-lived and could present an opportunity for sellers to re-enter the market at higher prices. The market is essentially caught between the potential for a short-covering rally from oversold conditions and the powerful underlying bearish trend.
Scenario Analysis: Where Does the Nasdaq 100 Go Next?
Bearish Scenario: Testing the Trend's Strength
65% ProbabilityNeutral Scenario: Consolidation and Waiting Game
25% ProbabilityBullish Scenario: A Counter-Trend Rally
10% ProbabilityThe Road Ahead: What to Watch
Economic Data and Fed Speak
Looking ahead, the economic calendar will be crucial in shaping the Nasdaq 100's trajectory. Investors will be closely monitoring upcoming U.S. economic releases, particularly any data that could influence the Federal Reserve's monetary policy decisions. While specific dates for these releases are not provided in the current market data, general trends indicate that inflation reports (like CPI or PCE) and employment figures (such as Non-Farm Payrolls) are always high-impact events. Any deviation from forecasts, whether positive or negative, could trigger significant market reactions. For instance, stronger-than-expected inflation data might reinforce expectations of a hawkish Fed, potentially pressuring the Nasdaq 100, while weaker inflation could fuel hopes of rate cuts, providing a bullish catalyst.
Furthermore, any commentary from Federal Reserve officials will be under intense scrutiny. Subtle shifts in language, the use of specific phrases, or even the omission of previously used terms can provide clues about the Fed's future intentions. The market's sensitivity to Fed speak has been amplified in recent times, as investors attempt to price in the path of interest rates. Traders will be dissecting every word for indications of whether the Fed is leaning towards maintaining higher rates for longer, considering a pause, or even contemplating rate cuts. This careful observation of Fed communication is essential for understanding the broader macroeconomic backdrop against which the Nasdaq 100 is trading.
Technical Confirmation and Risk Management
From a technical standpoint, the Nasdaq 100's ability to decisively break above the $23,251 resistance level will be the immediate focus. A failure to do so, especially with the weak trend strength indicated by the ADX on the 1-hour and 4-hour charts, could lead to a retest of the $23,056.6 support. The conflicting signals between different timeframes and indicators (e.g., RSI vs. ADX on the daily chart) highlight the complexity of the current situation. Traders should prioritize confirmation – waiting for price action to align with their thesis before committing capital. The strong bearish trend on the daily chart, despite oversold conditions, suggests that any rallies might be opportunities for sellers to re-enter, rather than the start of a sustained uptrend.
Effective risk management remains paramount. Given the mixed signals and the potential for volatility stemming from both macroeconomic factors and technical uncertainties, defining clear stop-loss levels is crucial. For those considering a bearish stance, invalidation at a close above $23,580.86 would be a key level to watch. Conversely, for any bullish conviction, a close below $23,056.6 on the daily chart would likely negate the upward potential. The current environment demands a disciplined approach, focusing on well-defined risk parameters and waiting for high-probability setups rather than chasing speculative moves. Patience and a clear strategy are the best allies for navigating these choppy market conditions.
Frequently Asked Questions: Nasdaq100 Analysis
What happens if the Nasdaq 100 breaks above the $23,251 resistance level?
A sustained close above $23,251.25 on the daily chart could trigger a bullish scenario, invalidating the current downtrend. This might lead to a retest of higher resistance levels, with a primary target at $23,580.86, reflecting potential short-covering momentum.
Should I buy the Nasdaq 100 at current levels around $23,168.76 given the RSI at 52.9?
Buying at current levels requires caution due to the weak trend strength (ADX 14.22) and the strong daily downtrend. While the RSI at 52.9 suggests some upward momentum, confirmation of a breakout above $23,251 is advised. A more prudent approach would be to wait for a confirmed bullish signal or a pullback to a key support level.
Is the ADX at 14.22 a sell signal for the Nasdaq 100 on the 1-hour chart?
An ADX reading of 14.22 indicates a weak trend, not necessarily a sell signal. It suggests that the current price movement lacks strong directional conviction. While the daily chart shows a strong downtrend, the weak ADX on shorter timeframes implies potential for consolidation or a short-lived counter-trend rally before the main trend resumes.
How will upcoming U.S. inflation data affect the Nasdaq 100's trend analysis this week?
Higher-than-expected inflation data could reinforce hawkish Fed expectations, potentially pressuring the Nasdaq 100 and confirming the daily downtrend. Conversely, lower inflation might fuel hopes for rate cuts, potentially triggering a bounce from oversold levels, but this would need to overcome the strong ADX reading on the daily chart.
Track markets in real-time
AI-powered analysis, technical indicators and real-time price data.
Join Our Telegram Channel
Breaking market news, AI analysis and trading signals instantly.
Join Channel