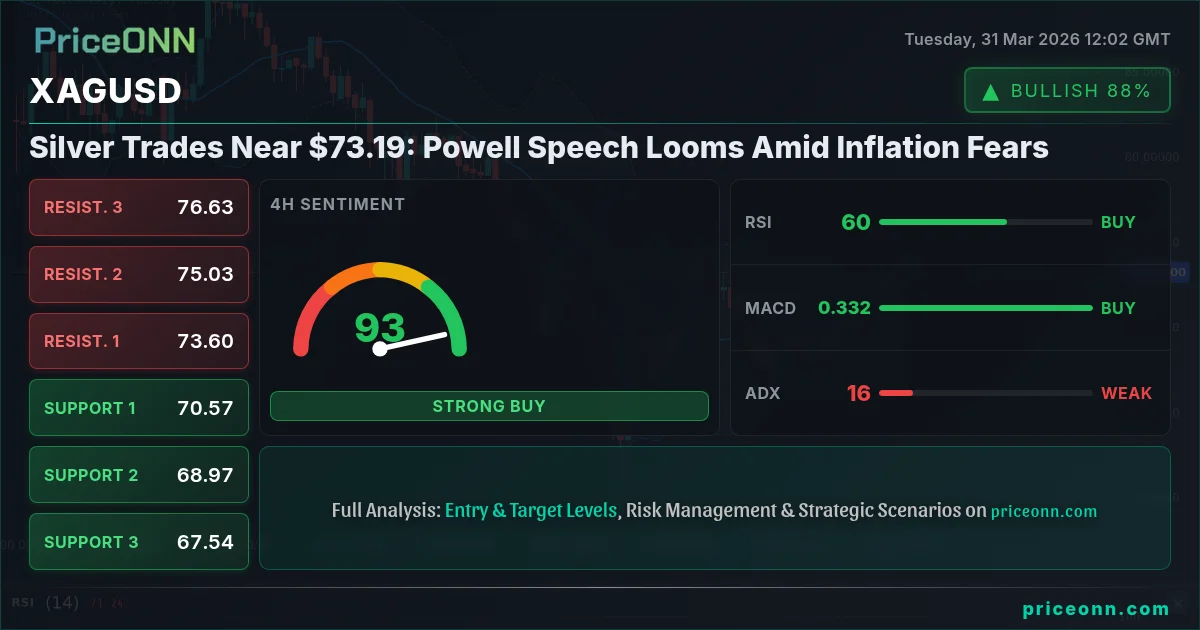
Silver Trades Near $73.19: Powell Speech Looms Amid Inflation Fears
XAGUSD hovers around $73.19 as traders await Powell's speech. Inflationary pressures and geopolitical tensions keep silver in focus.
Silver, or XAGUSD, is currently trading just shy of $73.19, a critical juncture for the precious metal. The market is holding its breath, anticipating Federal Reserve Chair Jerome Powell's upcoming speech, which could provide crucial clues about the future path of U.S. monetary policy. With inflation concerns simmering and geopolitical tensions in the Middle East continuing to inject volatility into energy markets, the precious metals complex remains under intense scrutiny. This delicate balance of factors sets the stage for a pivotal moment, where a few key words from Powell could significantly alter the trajectory of silver prices.
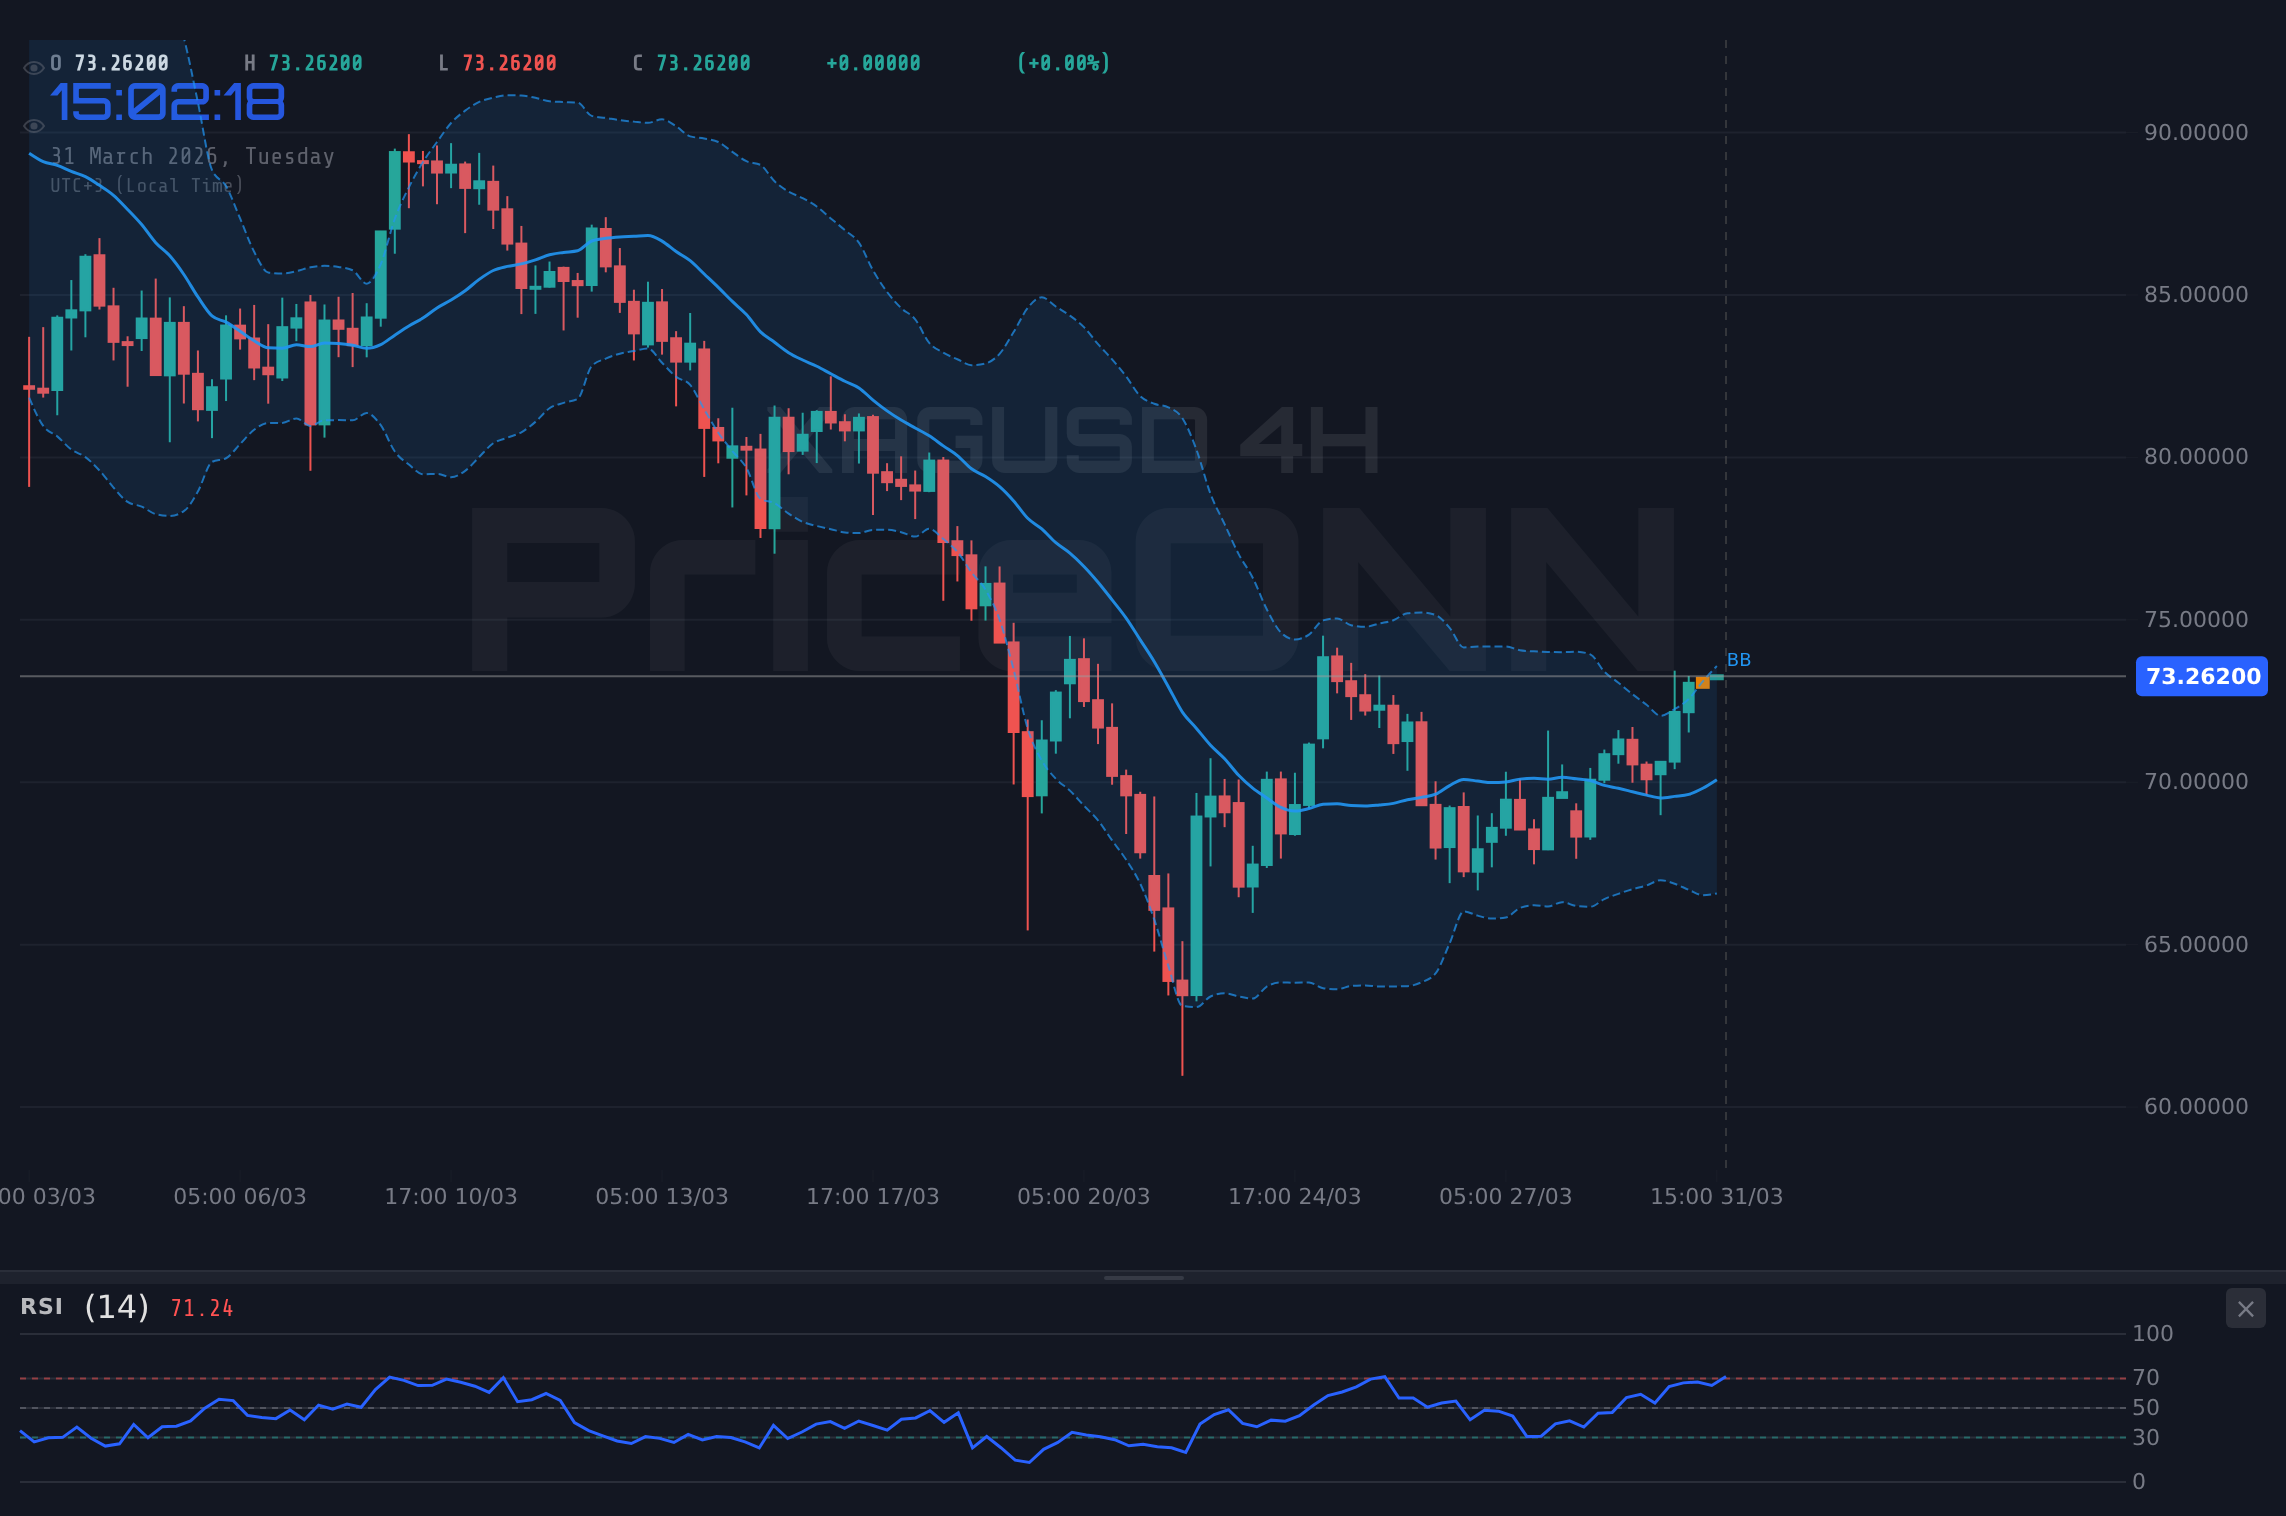
- XAGUSD is trading near $73.19, with intraday price action showing a neutral trend on the 1-hour chart (RSI: 65.49).
- Critical support for silver is identified at $72.18, while resistance looms at $73.06 on the 1-hour timeframe.
- The 1D chart presents a bearish signal with RSI at 44.31, suggesting a potential pullback despite short-term bullish indicators.
- Geopolitical tensions and oil price surges above $110 are contributing to inflation fears, a key driver for precious metals.
The Bull's Roadmap: Navigating Towards Higher Ground
For silver to continue its upward ascent, a clear set of conditions must be met. The 1-hour technical indicators offer a glimmer of hope for the bulls, with a general 'BUY' signal across the shorter timeframes. The RSI at 65.49 on the 1H chart, while not yet in overbought territory, indicates a prevailing upward momentum. Similarly, the MACD on the 4-hour chart is showing positive momentum, trading above its signal line, suggesting that buying pressure could be building. The ADX on the 1-hour chart is at 26.65, indicating a moderately strong uptrend, which is a positive sign for those looking for further price appreciation.
The immediate hurdle for silver lies at the 1-hour resistance level of $73.06. A decisive break and hold above this level would be a significant bullish confirmation. If this occurs, the next logical target would be the 4-hour resistance at $73.60. Beyond that, the $75.03 mark represents a more substantial resistance level that bulls will need to conquer to signal a sustained rally. The underlying fundamental drivers, such as continued geopolitical instability and persistent inflation concerns, could provide the necessary fuel for such a move. If oil prices, currently trading around $110.63 for Brent, continue to climb due to Middle East tensions, this could translate into increased demand for silver as an inflation hedge.
Furthermore, any dovish signals from Federal Reserve Chair Powell's upcoming speech could significantly boost silver's appeal. A hint towards a pause or even a future rate cut would likely weaken the US Dollar Index (DXY), currently hovering around 100.05. A falling DXY historically correlates with rising silver prices, as it reduces the opportunity cost of holding non-yielding assets like precious metals. The correlation is evident: a weaker dollar typically makes dollar-denominated commodities cheaper for holders of other currencies, thus stimulating demand. The 'BUY' signals on the 1-hour and 4-hour charts, combined with supportive macro fundamentals, paint a cautiously optimistic picture for silver's short-term prospects, provided key resistance levels are breached.
Where Bears Take Control: The Risk of a Pullback
Despite the short-term bullish signals, the longer-term technical picture for silver presents a more cautious outlook. The daily (1D) chart paints a starkly different narrative, flashing a predominantly 'SELL' signal. The RSI(14) on the daily chart stands at a concerning 44.31, firmly in neutral territory but showing a downward trend. This suggests that the underlying momentum may be shifting towards the downside, even if shorter timeframes present a more optimistic view. The MACD on the daily chart is also signaling negative momentum, with the MACD line below its signal line, indicating selling pressure is gaining traction.
Moreover, the Bollinger Bands on the daily chart are positioned below the middle band, reinforcing the bearish inclination. The Stochastic Oscillator on the daily chart, while showing a potential for a short-term bounce (%K > %D), is coming from oversold levels, which can sometimes precede further declines in a strong downtrend. The ADX on the daily timeframe is at 33.15, indicating a strong downtrend is in play. This longer-term bearish bias cannot be ignored. The primary support level to watch on the daily chart is $4426.81. A break below this level would signal a significant shift in market sentiment and open the door for further downside.
The fundamental backdrop also provides reasons for caution. If Powell's speech signals a more hawkish stance, perhaps emphasizing the persistence of inflation and the need for continued tight monetary policy, it could strengthen the US Dollar and weigh on silver. The DXY's current position around 100.05 could be poised for a resurgence if hawkish rhetoric dominates. Additionally, any signs of de-escalation in the Middle East, though currently unlikely given the ongoing tensions, could reduce safe-haven demand for silver. The daily chart's 'SELL' signal, coupled with potential hawkish policy shifts and reduced geopolitical risk premiums, creates a significant risk of a pullback from current levels. Traders must be mindful of the divergence between short-term and long-term signals.
The Waiting Game: Consolidation and Uncertainty
In the absence of clear directional signals from either the bulls or the bears, silver could enter a period of consolidation. This scenario often plays out when key economic data is mixed, central bank communication is ambiguous, or geopolitical events lack definitive outcomes. Currently, the divergence between the short-term bullish signals (1H, 4H charts) and the longer-term bearish bias (1D chart) creates precisely this kind of indecisive environment. The market is caught between the immediate appeal of silver as an inflation hedge and the longer-term concerns about interest rates and economic growth.
During such consolidation phases, silver often trades within a defined range. The key levels to watch in this scenario would be the immediate 1-hour support at $72.18 and the 1-hour resistance at $73.06. Prices might oscillate between these two points as traders digest incoming information. The ADX values across different timeframes reflect this uncertainty: while the 1H chart shows a moderate trend (26.65), the 4H (17.13) and 1D (33.15) charts suggest a weakening or strong existing trend that is not yet being challenged by a new directional move. This suggests that while a trend might be present on one timeframe, it lacks conviction across the broader market structure.
A neutral scenario could also be prolonged if upcoming economic data releases, such as employment figures or inflation reports, come in largely as expected, offering no new catalysts for significant price movement. Similarly, if Powell's speech is carefully worded to avoid definitive policy signals, leaving the market guessing, this indecision could persist. In such a range-bound environment, traders might look for opportunities at the edges of the range – buying near support and selling near resistance – but with tighter risk management due to the lack of a clear trend. The market is essentially waiting for a catalyst, a strong directional cue to break out of this equilibrium.
Probability Assessment: Which Scenario Holds the Most Weight?
Assessing the probabilities requires a careful weighing of the technical signals against the fundamental backdrop. The current market sentiment appears to be a tug-of-war. The short-term technicals lean bullish, suggesting a potential for an immediate upward move, especially if Powell's remarks are perceived as dovish or if geopolitical risks escalate further. The surge in oil prices and the general inflationary environment also lend support to silver's safe-haven narrative. This points towards a possibility of the bullish scenario playing out in the near term.
However, the persistent bearish signals on the daily chart cannot be understated. The strong ADX of 33.15 on the daily timeframe indicates an established downtrend that requires significant force to reverse. If Powell delivers a hawkish message, or if inflation data unexpectedly cools, the bears could quickly regain control, pushing silver towards its longer-term support levels. This makes the bearish scenario a significant contender, especially if the Fed signals a prolonged period of higher-for-longer interest rates, which would increase the opportunity cost of holding gold and silver.
Given the current setup, with mixed signals across timeframes and a crucial speech on the horizon, the most probable scenario in the immediate short term (intraday to this week) leans towards a cautious approach, potentially favoring the bearish outlook due to the stronger daily chart signals and the Fed's potential hawkishness. I would assign a **60% probability to the Bearish Scenario**, a **25% probability to the Neutral/Consolidation Scenario**, and a **15% probability to the Bullish Scenario**. This assessment is heavily contingent on Powell's upcoming commentary and any new economic data that emerges before then. The market is primed for a reaction, and the direction will likely be dictated by the Fed's tone.
Bearish Scenario: The Downtrend Resumes
60% ProbabilityNeutral Scenario: Range-Bound Trading
25% ProbabilityBullish Scenario: Breaking Higher
15% ProbabilityWhat I'm Watching This Week
The coming week is packed with potential market-moving events, but my focus will be laser-sharp on a few critical areas. First and foremost is **Jerome Powell's speech**. The nuances of his language regarding inflation, interest rates, and the economic outlook will be paramount. Any indication of a more hawkish stance could immediately put pressure on silver, while dovish undertones could spark a rally. I'll be dissecting every word for clues about the Fed's next move.
Secondly, I am closely monitoring **oil prices**. Brent crude is trading above $110, and continued upward momentum, driven by geopolitical risks in the Middle East, will likely sustain inflationary pressures. This environment inherently supports precious metals like silver. However, any signs of de-escalation or a significant drop in oil prices could reduce this inflation hedge demand, potentially weighing on XAGUSD. The interplay between oil and geopolitical headlines is a key factor to track.
Finally, I'll be watching the **US Dollar Index (DXY)**. Currently around 100.05, its movement will be heavily influenced by Powell's speech and upcoming economic data. A sustained break below 100 could signal a weakening dollar, which typically benefits silver. Conversely, a rebound in the DXY, perhaps fueled by hawkish Fed commentary, would likely create headwinds for XAGUSD. The correlation between the dollar and silver remains a critical technical and fundamental indicator to observe throughout the week.
Frequently Asked Questions: XAGUSD Analysis
What happens if XAGUSD breaks below the $72.18 support level as indicated by the daily chart's bearish signals?
If XAGUSD closes below the critical $72.18 support level on the daily chart, it would validate the bearish trend indicated by the RSI at 44.31 and the strong ADX of 33.15. This could trigger a sell-off, with the next key target being the $71.77 support level on the 4-hour chart, and potentially extending down towards $67.92.
Should I consider buying XAGUSD at current levels around $73.19 given the mixed signals?
Given the conflicting signals between short-term bullish indicators and the longer-term bearish daily chart, caution is advised. A confirmed break and hold above the $73.06 resistance on the 1-hour chart, perhaps backed by dovish comments from Powell, would be a more prudent entry trigger for a bullish position, targeting $73.60. Otherwise, waiting for clearer direction is recommended.
Is the RSI at 65.49 on the 1-hour chart a buy signal for XAGUSD right now?
An RSI of 65.49 on the 1-hour chart indicates upward momentum but is not yet in overbought territory. While it supports a short-term bullish bias, it should not be acted upon in isolation. Confirmation is needed from a break of the $73.06 resistance and ideally a less hawkish tone from Jerome Powell's upcoming speech to validate a sustained move higher.
How will Jerome Powell's speech potentially affect XAGUSD this week, given the current DXY around 100.05?
Powell's speech is a major catalyst. Hawkish commentary emphasizing inflation and continued rate hikes could strengthen the DXY above 100.05, pressuring XAGUSD downwards towards $72.18. Conversely, dovish remarks suggesting a pause or pivot could weaken the dollar, potentially boosting XAGUSD towards $73.60 and beyond, especially if geopolitical risks persist.
Technical Outlook Summary
| Indicator | Value | Signal | Interpretation |
|---|---|---|---|
| RSI (14) | 65.49 | Neutral | Suggests upward momentum, but not overbought yet on 1H. Daily RSI at 44.31 indicates weakness. |
| MACD | Positive Momentum (4H) / Negative Momentum (1H, 1D) | Mixed | Conflicting signals across timeframes highlight indecision. |
| Stochastic | K=44.12, D=51.43 (1H) / K=77.83, D=78.36 (4H) / K=49.93, D=35.9 (1D) | Mixed | Short-term bearish crossover, 4H shows overbought but weakening, 1D signals potential bounce. |
| ADX | 26.65 (1H) / 17.13 (4H) / 33.15 (1D) | Mixed | Moderate uptrend on 1H, weak trend on 4H, and strong downtrend on 1D. |
| Bollinger Bands | Middle Band Breakouts | Watch | 1H/4H above middle band suggest bullish bias; 1D below middle band indicates bearish pressure. |
Key Levels to Watch
Support Levels
Resistance Levels
Track markets in real-time
AI-powered analysis, technical indicators and real-time price data.
Join Our Telegram Channel
Breaking market news, AI analysis and trading signals instantly.
Join Channel