
NZDUSD is under significant pressure, currently trading at $0.58639, as a confluence of factors weighs on the currency pair. Escalating geopolitical tensions in the Middle East, coupled with concerning signals from economic indicators, particularly Purchasing Managers Index (PMI) data, are contributing to a risk-off sentiment that favors safe-haven assets over the New Zealand dollar. The kiwi's vulnerability is further amplified by its sensitivity to global trade and commodity prices, making it particularly susceptible to shifts in market sentiment.
The surge in the US dollar, as reflected by the Dollar Index (DXY) at 99.05, is a major headwind for NZDUSD. As investors flock to the safety of the greenback amid escalating Middle East tensions, currencies like the New Zealand dollar, which are perceived as riskier, tend to suffer. According to Reuters, the escalating tensions in the Middle East are driving investors towards safe-haven assets, boosting the US dollar and gold. This flight to safety is not just a knee-jerk reaction; it reflects deeper concerns about potential disruptions to global trade and supply chains, which could have a disproportionate impact on export-dependent economies like New Zealand.
Adding to the bearish sentiment is the concerning data emerging from PMI readings. While specific New Zealand PMI data wasn't provided in the latest update, the broader context of global manufacturing slowdowns and potential recessionary pressures is weighing on the kiwi. Traders are closely watching upcoming U.S. economic data releases, including the U.S. ADP Nonfarm Employment Change on Wednesday, and Retail Sales data due Friday, for further clues about the health of the global economy. Any signs of weakness in these numbers could exacerbate the downward pressure on NZDUSD. The market is bracing for the U.S. Services Purchasing Managers Index (PMI) also due Wednesday, with expectations set at 52.3, slightly below the previous reading of 52.7. A miss on this expectation could trigger a further risk-off move.
From a technical analysis perspective, the NZDUSD chart paints a bearish picture across multiple timeframes. On the 1-hour chart, the trend is firmly down, with a strength of 100%. Key support levels to watch are 0.5848, 0.58357, and 0.58133. The Relative Strength Index (RSI) at 29.81 indicates oversold conditions, which might suggest a potential for a short-term bounce. However, the strong downward trend, as indicated by the Average Directional Index (ADX) at 37.16, suggests that the bearish momentum is likely to persist. The Moving Average Convergence Divergence (MACD) also confirms the negative momentum, with the MACD line trading below the signal line.
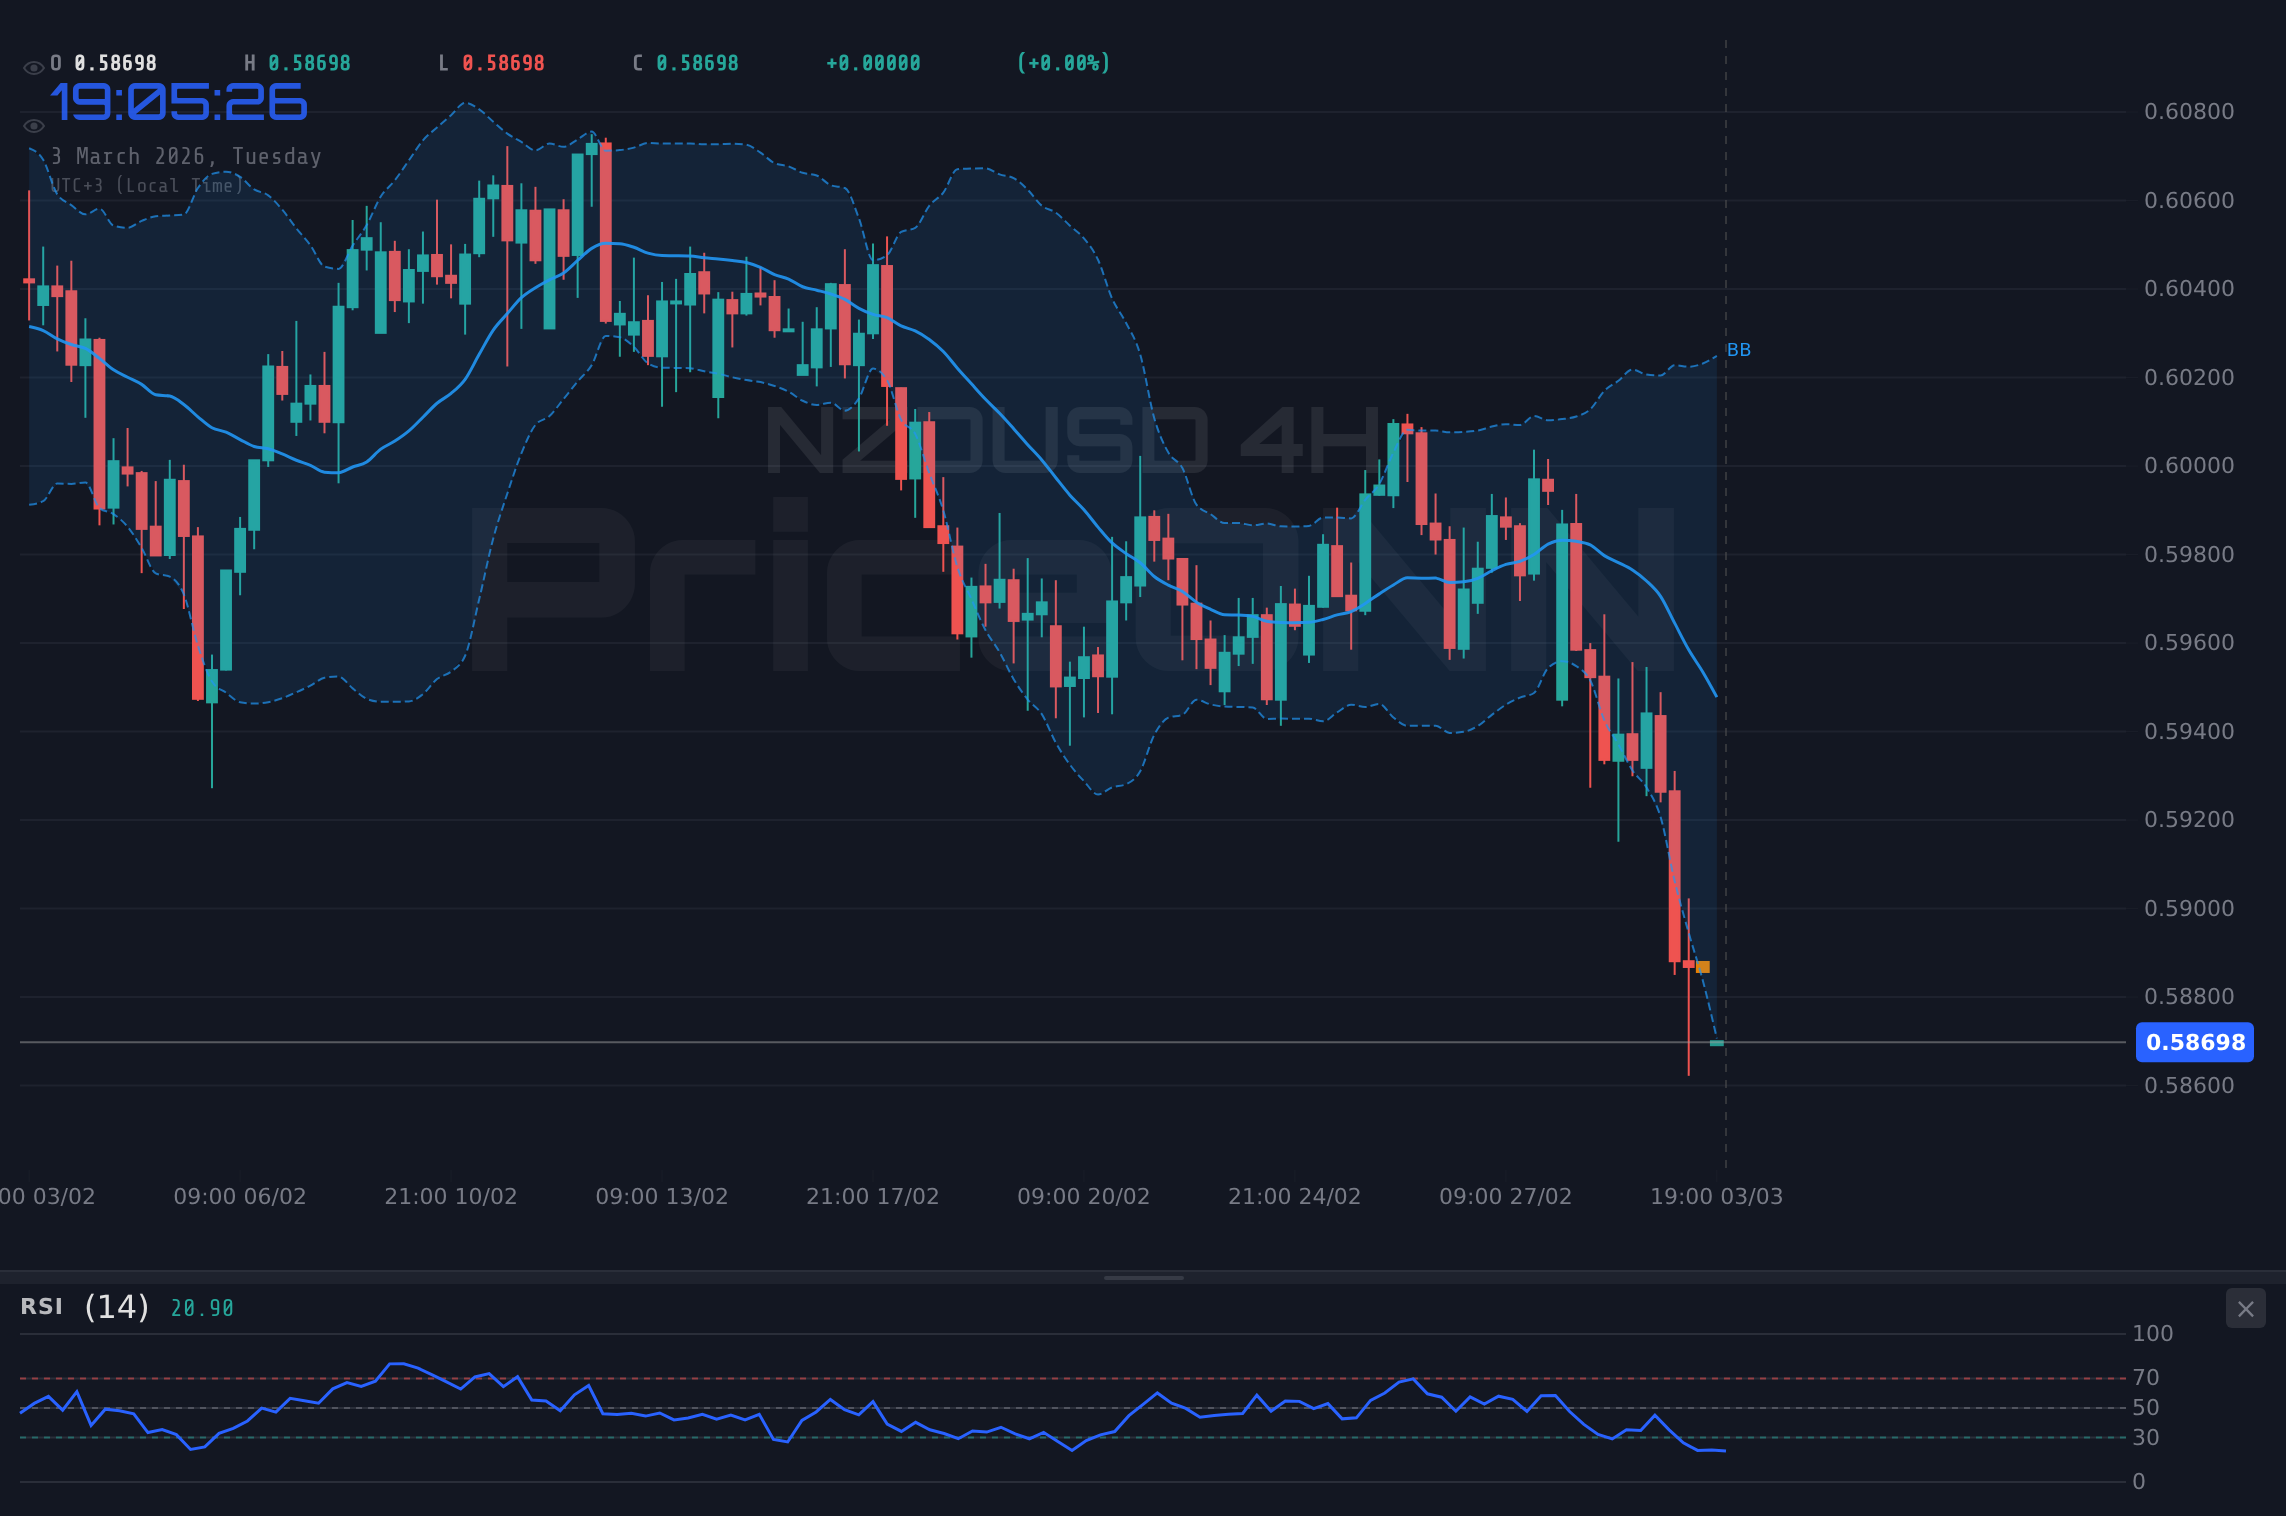
Stepping back to the 4-hour timeframe, the bearish outlook remains intact. While the trend is classified as neutral, with a strength of 50%, the RSI at 28.87 also indicates oversold conditions. The key support levels in this timeframe are 0.58717, 0.58553, and 0.58256. The ADX at 30.29 suggests a moderately strong downtrend, and the MACD continues to signal negative momentum. It's worth noting that the Stochastic oscillator, with %K at 11.54 and %D at 19.76, is deeply oversold, potentially hinting at a minor retracement before the downtrend resumes. However, this is a weak signal considering the overall bearish context.
Looking at the daily chart, the trend is also classified as neutral, with an ADX of 22.97 indicating a medium strength downtrend. The RSI sits at 37.82, still within neutral territory but trending downwards. The key support levels on this timeframe are 0.59012, 0.58689, and 0.58226. The MACD paints a similar picture, with negative momentum persisting. The Stochastic oscillator, with %K at 26.13 and %D at 30.51, also signals a downward trajectory.
For scalpers, the immediate focus should be on the 0.5848 support level. A break below this level could open the door for a quick move towards 0.58357 and potentially 0.58133. However, given the oversold conditions, scalpers should be wary of potential snapback rallies and manage their risk accordingly. Swing traders should monitor the 4-hour chart for a potential break of the 0.58717 support level. A sustained move below this level could confirm the continuation of the downtrend and provide an opportunity to enter short positions with targets at 0.58553 and 0.58256. Long-term investors should exercise caution and avoid bottom-fishing in the current environment. While the oversold conditions might seem tempting, the strong downtrend and the prevailing risk-off sentiment suggest that further declines are possible.
The correlation analysis further supports the bearish view on NZDUSD. The strengthening DXY, currently at 99.05, is exerting significant downward pressure on the currency pair. The weakness in the SP500 (currently at 6734.2, down -2.02%) and Nasdaq100 (currently at 24414.03, down -2.16%) reflects the broader risk aversion in the market, which is benefiting the US dollar at the expense of riskier assets like the New Zealand dollar. Even the recent surge in WTI crude oil (currently at $77.14, up 8.75%) is failing to provide any meaningful support for NZDUSD, highlighting the severity of the current risk-off environment. This decoupling from commodity prices underscores the dominant influence of geopolitical tensions and dollar strength.
Historically, periods of heightened geopolitical uncertainty and dollar strength have often led to significant declines in commodity currencies like the New Zealand dollar. The current situation bears similarities to the market conditions seen during the early stages of the Russia-Ukraine conflict, when safe-haven flows and energy price shocks triggered sharp declines in riskier assets. While the specific circumstances are different, the underlying dynamics of risk aversion and dollar dominance remain the same. The key difference this time is the strong rise in WTI crude oil, currently trading at $77.14 after a daily change of 8.75%, which may provide a short term boost to the currency. This indicator should be closely monitored in the coming weeks to see if it has the potential to reverse the downtrend.
The upcoming U.S. ADP Nonfarm Employment Change data on Wednesday will be a crucial test for NZDUSD. A strong reading could further bolster the dollar and exacerbate the downward pressure on the currency pair. Conversely, a weak reading could provide a temporary reprieve, but the overall bearish trend is likely to persist unless there is a significant shift in market sentiment. FOMC Member Kashkari is also scheduled to speak today, and his comments will be closely scrutinized for clues about the future direction of U.S. monetary policy. Any hawkish signals could further strengthen the dollar and weigh on NZDUSD.
NZDUSD breaks below the 0.5848 support level, triggering further declines towards 0.58357 and potentially 0.58133. The strong downtrend and the prevailing risk-off sentiment favor this scenario. This is also in line with the current 1H trend which is rated as 100% bearish.
NZDUSD finds support at 0.5848 and stages a short-term bounce towards 0.58827 and potentially 0.59051. This scenario is less likely given the strong downtrend and the prevailing risk-off sentiment but could occur due to oversold conditions.
Frequently Asked Questions: NZDUSD Analysis
Is NZDUSD a good buy right now?
Given the current downtrend and risk-off sentiment, NZDUSD is not a good buy right now. The price is currently at $0.58639, and a break below the 0.5848 support could trigger further declines, making short positions more attractive.
What is the NZDUSD price forecast for this week?
The NZDUSD price forecast for this week is bearish, with a potential move towards 0.58357 and 0.58133 if the 0.5848 support breaks. There is a 65% probability of this bearish scenario playing out, given the current market conditions.
What are the key support and resistance levels for NZDUSD?
Key support levels for NZDUSD are 0.5848, 0.58357, and 0.58133. Key resistance levels are 0.58827, 0.59051, and 0.59174. These levels are derived from the 1-hour timeframe analysis and should be closely monitored for potential breakouts or breakdowns.
Why is NZDUSD moving today?
NZDUSD is moving lower today due to a combination of factors, including escalating geopolitical tensions in the Middle East, disappointing PMI data, and a strengthening US dollar. These factors are contributing to a risk-off sentiment that favors safe-haven assets over the New Zealand dollar.
Technical Outlook Summary
| Indicator | Value | Signal |
|---|---|---|
| RSI (14) | 29.81 | Oversold |
| MACD Histogram | Negative | Bearish |
| Stochastic | 20.97 / 22.13 | Potential Reversal |
| ADX | 37.16 | Strong Trend |
| Bollinger | Lower Band | Oversold |
Key Levels
Support Levels
Resistance Levels
Track markets in real-time
AI-powered analysis, technical indicators and real-time price data.
Join Our Telegram Channel
Breaking market news, AI analysis and trading signals instantly.
Join Channel