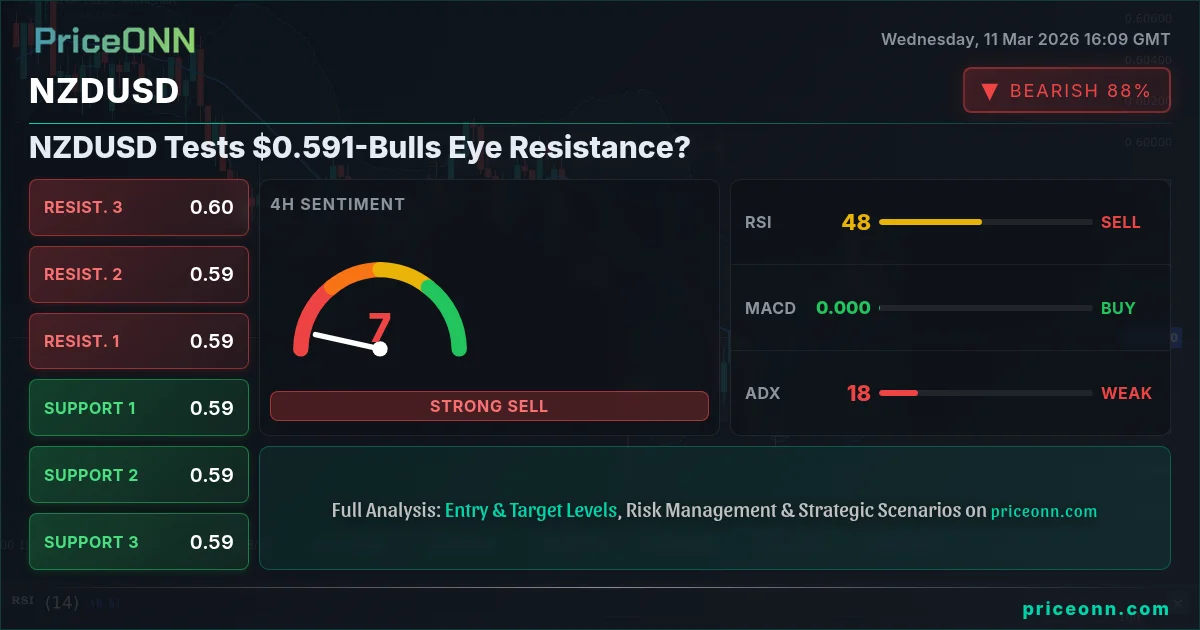
NZDUSD is at a pivotal juncture, hovering near $0.59082. The question is whether the bulls can sustain the upward momentum and overcome the resistance, or if the bears will regain control, leading to a potential reversal. This analysis will dissect the technical factors influencing the currency pair, laying out the bull and bear cases with key levels to monitor.
- RSI at 40.12 on the 1H chart suggests weakening bullish momentum near the $0.591 resistance.
- Immediate support lies at 0.59075 (4H), a break below which could trigger a bearish move.
- Stochastic oscillator on the 1D chart signals a potential bullish crossover, but the ADX at 21.88 indicates a weak trend.
- Upcoming economic data releases could significantly impact NZDUSD's direction, particularly USD-related news.
The Bullish Case for NZDUSD
The bullish scenario hinges on the ability of NZDUSD to overcome the immediate resistance around $0.591. Several factors support this potential upward movement. First, the Stochastic oscillator on the daily chart shows a bullish crossover (K=49.25, D=41.96), suggesting that the downward momentum might be waning, and a potential upward swing could be in the cards. The 4H chart shows RSI at 51.37, showing a slightly bullish inclination. If the price can sustain above this level, it could signal the beginning of a new upward trend.
Furthermore, the overall sentiment in the market plays a crucial role. If risk appetite increases, as indicated by a rise in the SP500 or Nasdaq, NZDUSD could benefit. News that AUDUSD is surging due to expectations of an imminent RBA rate hike could also create a tailwind, potentially pulling NZDUSD along with it. The fact that WTI crude is showing a strong uptrend, with RSI in overbought territory at 76.67, also supports the bullish case. As a commodity currency, NZD is often correlated with crude prices.
The Bearish Case for NZDUSD
Conversely, the bearish scenario gains traction if NZDUSD fails to break above the $0.591 resistance. Several indicators point towards a potential downward move. The 1H chart shows a strong downtrend with RSI at 40.12 and ADX at 17.29. The MACD is negative, further supporting bearish momentum in the short term. If the price fails to sustain the current levels, a retest of lower support levels is likely.
The strength of the US Dollar Index (DXY) is also a significant factor. The DXY is currently showing an uptrend, trading at 99.04, with the 1D chart showing a strong uptrend (ADX: 26.13). A stronger dollar typically puts downward pressure on NZDUSD. News that the dollar is under pressure could provide a temporary reprieve, but if the underlying trend remains strong, NZDUSD will likely face continued headwinds. Upcoming USD economic data releases will be crucial to watch.
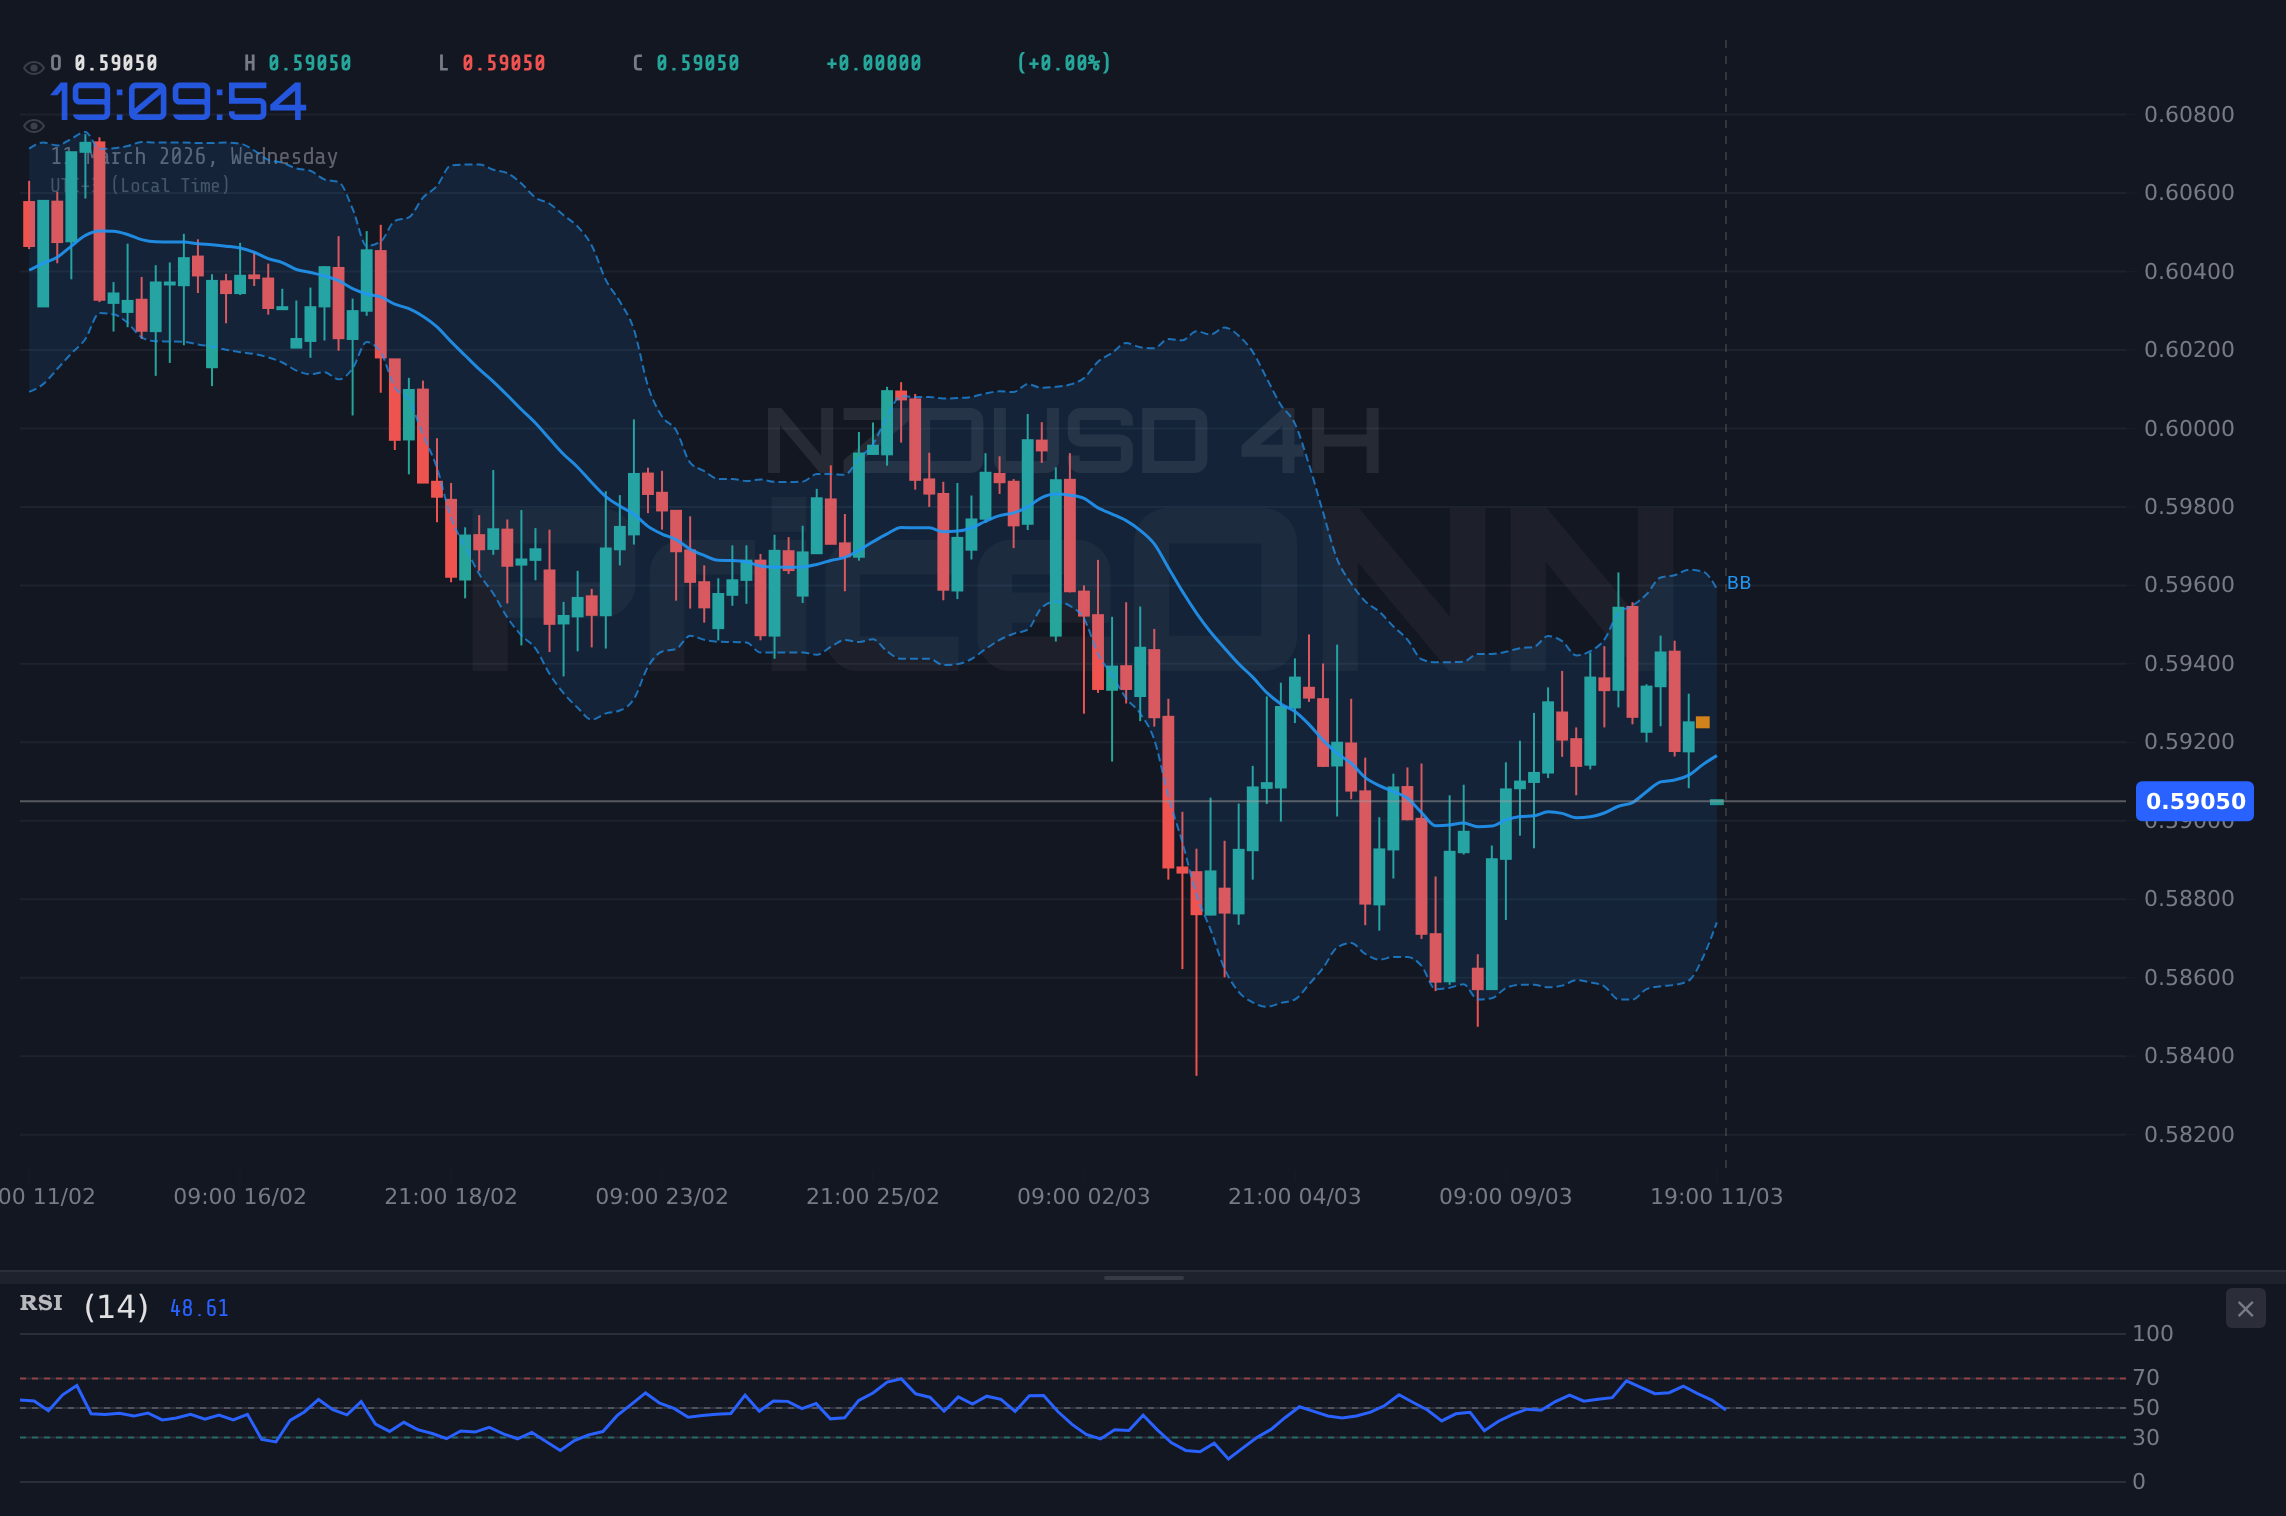
Technicals as Tiebreaker: Multi-Timeframe Analysis
To reconcile the conflicting signals, a multi-timeframe analysis is essential. On the 1H timeframe, the support levels are at 0.59247, 0.59169, and 0.59094, while the resistance levels are at 0.594, 0.59475, and 0.59553. The 4H timeframe shows support at 0.59075, 0.58972, and 0.5878, with resistance at 0.5937, 0.59562, and 0.59665. A break below the 4H support at 0.59075 could confirm the bearish scenario. The 1D timeframe paints a mixed picture, with support at 0.59009, 0.58753, and 0.58441, and resistance at 0.59577, 0.59889, and 0.60145.
The ADX values also provide valuable insights. On the 1H chart, the ADX is weak at 17.29, indicating a lack of a strong trend. However, on the 4H chart, the ADX is slightly higher at 18.66, showing a moderate downtrend. The 1D chart also shows a downtrend with ADX at 21.88. This suggests that while the short-term trend might be weak, the overall bias is still towards the downside.
Looking at the moving averages, the price is hovering near the 200-day moving average on the daily chart. This level often acts as a significant support or resistance. A decisive break below this moving average could signal a stronger bearish trend, while holding above it could indicate a potential bullish reversal.
Trade Recommendation: WATCH_ZONE
Given the conflicting signals and the weak trend strength indicated by the ADX (18.66 on the 4H chart), the recommended trade action is to remain in a WATCH_ZONE. The market is choppy and ranging, making a clear trade plan risky. While the RSI and MACD histogram are aligned, providing a directional signal, the overall picture is still uncertain. A daily close above 0.59577 would open the door for a potential bullish setup, targeting higher resistance levels. However, until then, caution is advised.
Key Levels
Key Levels
Support Levels
Resistance Levels
Technical Outlook Summary
| Indicator | Value | Signal |
|---|---|---|
| RSI (14) | 40.12 (1H) | Neutral |
| MACD Histogram | Negative (1H) | Bearish |
| Stochastic | 49.25 (1D) | Bullish |
| ADX | 17.29 (1H) | Weak Trend |
| Bollinger | Near Middle Band | Watch |
Frequently Asked Questions: NZDUSD Analysis
What happens if NZDUSD breaks above 0.59577 resistance?
If NZDUSD decisively breaks above the 0.59577 resistance level, it could signal a continuation of the bullish trend, potentially targeting higher resistance levels around 0.59889 and 0.60145. However, traders should watch for confirmation signals, such as increased volume and bullish candlestick patterns.
Should I buy NZDUSD at current levels of $0.59082 given the mixed signals?
Given the mixed signals and the weak trend strength (ADX at 17.29), it's prudent to remain cautious and avoid initiating new positions at the current level of $0.59082. Instead, wait for a clearer signal, such as a confirmed break above resistance or a breakdown below support, before making a trading decision.
Is the bullish crossover on the daily Stochastic a reliable buy signal for NZDUSD?
While the bullish crossover on the daily Stochastic suggests a potential upward move, it should not be considered a standalone buy signal. Traders should look for confluence with other indicators, such as a break above key resistance levels and positive momentum confirmation from the MACD, before entering a long position.
How will the upcoming USD data affect NZDUSD this week?
Upcoming USD data releases, particularly high-impact events, could significantly influence NZDUSD. Stronger-than-expected USD data could lead to a stronger dollar index (DXY), putting downward pressure on NZDUSD, while weaker data could weaken the dollar and support a potential upward move in NZDUSD.
Track markets in real-time
AI-powered analysis, technical indicators and real-time price data.
Join Our Telegram Channel
Breaking market news, AI analysis and trading signals instantly.
Join Channel