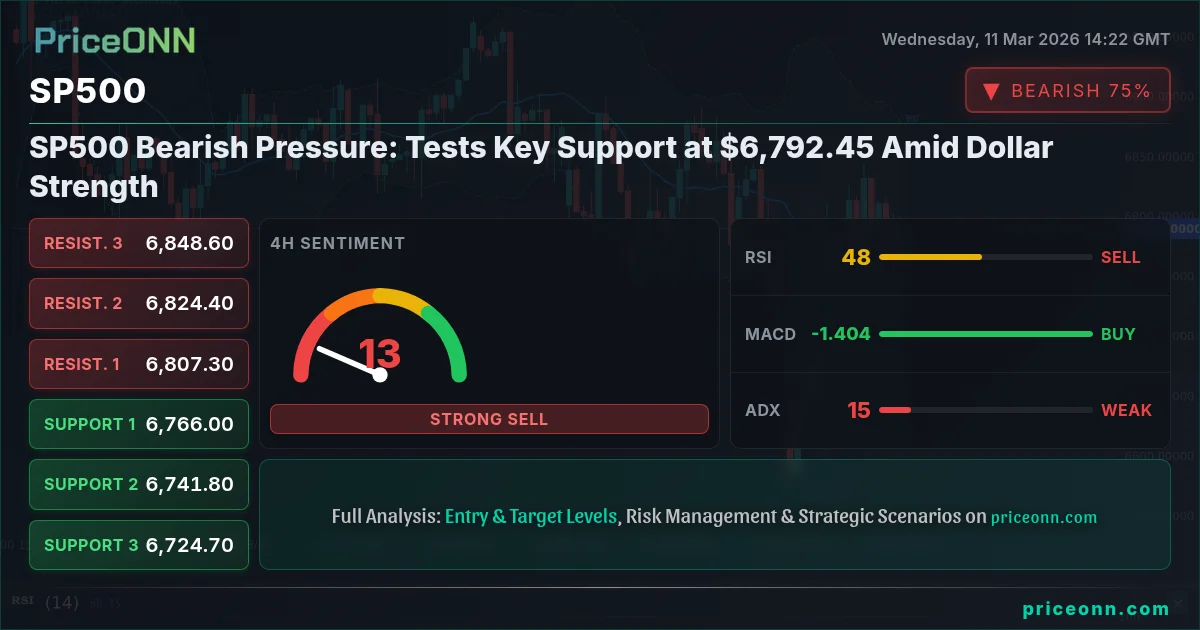
The SP500 is caught in a tug-of-war between bulls and bears, currently trading at $6,792.45. This level is pivotal, as it tests a key support zone around $6,750. The strength of the US Dollar, reflected in the rising DXY at 98.76, is adding bearish pressure, while mixed technical indicators offer conflicting signals. The question now is whether the bulls can muster enough strength to defend this critical support or if the bears will seize control, leading to further declines.
- RSI at 51.59 in the 1H timeframe suggests neutral momentum, but a potential for a shift either way.
- Key support level at $6,750.73 on the daily chart needs to hold to prevent further bearish momentum.
- MACD histogram displays negative momentum, indicating bearish pressure in the short term.
- Rising DXY at 98.76 is negatively correlated with SP500, adding to the downward pressure.
The Bullish Case: SP500 Poised for a Rebound
Despite the current bearish pressure, there's a compelling bullish case for the SP500. The 4H chart reveals the RSI at 51.35, indicating a potential for upward momentum. Historically, the SP500 has shown resilience after testing key support levels, especially when macroeconomic conditions provide a tailwind. The recent pullback could be a healthy correction before resuming its upward trajectory. Furthermore, the overall economic outlook, while uncertain, still points to moderate growth, which could support corporate earnings and, in turn, boost the SP500.
Looking at the Nasdaq100, which often leads the SP500, we see a similar pattern. Although displaying a bearish trend in the 1D timeframe, it currently trades at $25,078.44 and the 1H chart shows that the Stochastic K=46.35, D=29.85 are showing a buy signal. This suggests that the tech sector, a significant component of the SP500, could be poised for a rebound. The SP500 often mirrors the Nasdaq100s performance, so this offers a potentially bullish outlook.
For scalpers, the hourly chart offers insights. If the SP500 can break above the immediate resistance at $6,787.03, it could trigger a short-term rally. Swing traders should watch for a daily close above $6,837.93, which would confirm a bullish reversal. Long-term investors might view the current dip as an opportunity to accumulate positions, especially if the index holds above the critical support at $6,750.73.
The Bearish Case: SP500 Faces Significant Downside Risks
Conversely, the bearish case for the SP500 is equally compelling. The daily chart shows a strong downward trend with an ADX of 34.27, indicating that the bearish momentum is significant. The RSI at 44.33 suggests that there is still room for further declines before the index becomes oversold. The negative momentum on the MACD reinforces this bearish outlook. A break below the key support at $6,750.73 could trigger a sharp sell-off, potentially leading to a test of lower support levels at $6,710.67 and $6,663.53.
The strengthening US Dollar is a major headwind for the SP500. With the DXY at 98.76 and displaying positive momentum, the SP500 faces increased pressure. Historically, a strong dollar has negatively correlated with the SP500, as it makes US exports more expensive and reduces the earnings of multinational corporations. This is further compounded by the energy markets. WTI crude oil, currently trading at $85.19, has a Stochastic K=59.54, D=32.82 showing a buy signal in the 4H timeframe. This increase in oil prices could contribute to inflationary pressures, potentially prompting the Federal Reserve to maintain its hawkish stance, which would further weigh on the SP500.
The recent news of the USD/CAD facing pressure near 1.3500 as oil prices drop offsets dollar weakness reinforces the complex interplay of factors affecting the SP500. The decline in oil prices, while potentially easing inflationary pressures, also reflects concerns about global economic growth, which could negatively impact the SP500.
Technicals as the Tiebreaker: What the Charts are Saying
The technical picture for the SP500 is undeniably mixed. On the hourly chart, the RSI at 51.59 is neutral, offering little directional guidance. The MACD histogram displays negative momentum, suggesting that the bears have the upper hand in the short term. However, the Stochastic oscillator shows a bullish signal, indicating that the index could be poised for a short-term bounce. On the 4-hour chart, the RSI at 51.35 is also neutral, while the MACD displays positive momentum. This divergence in signals across different timeframes highlights the uncertainty in the market.
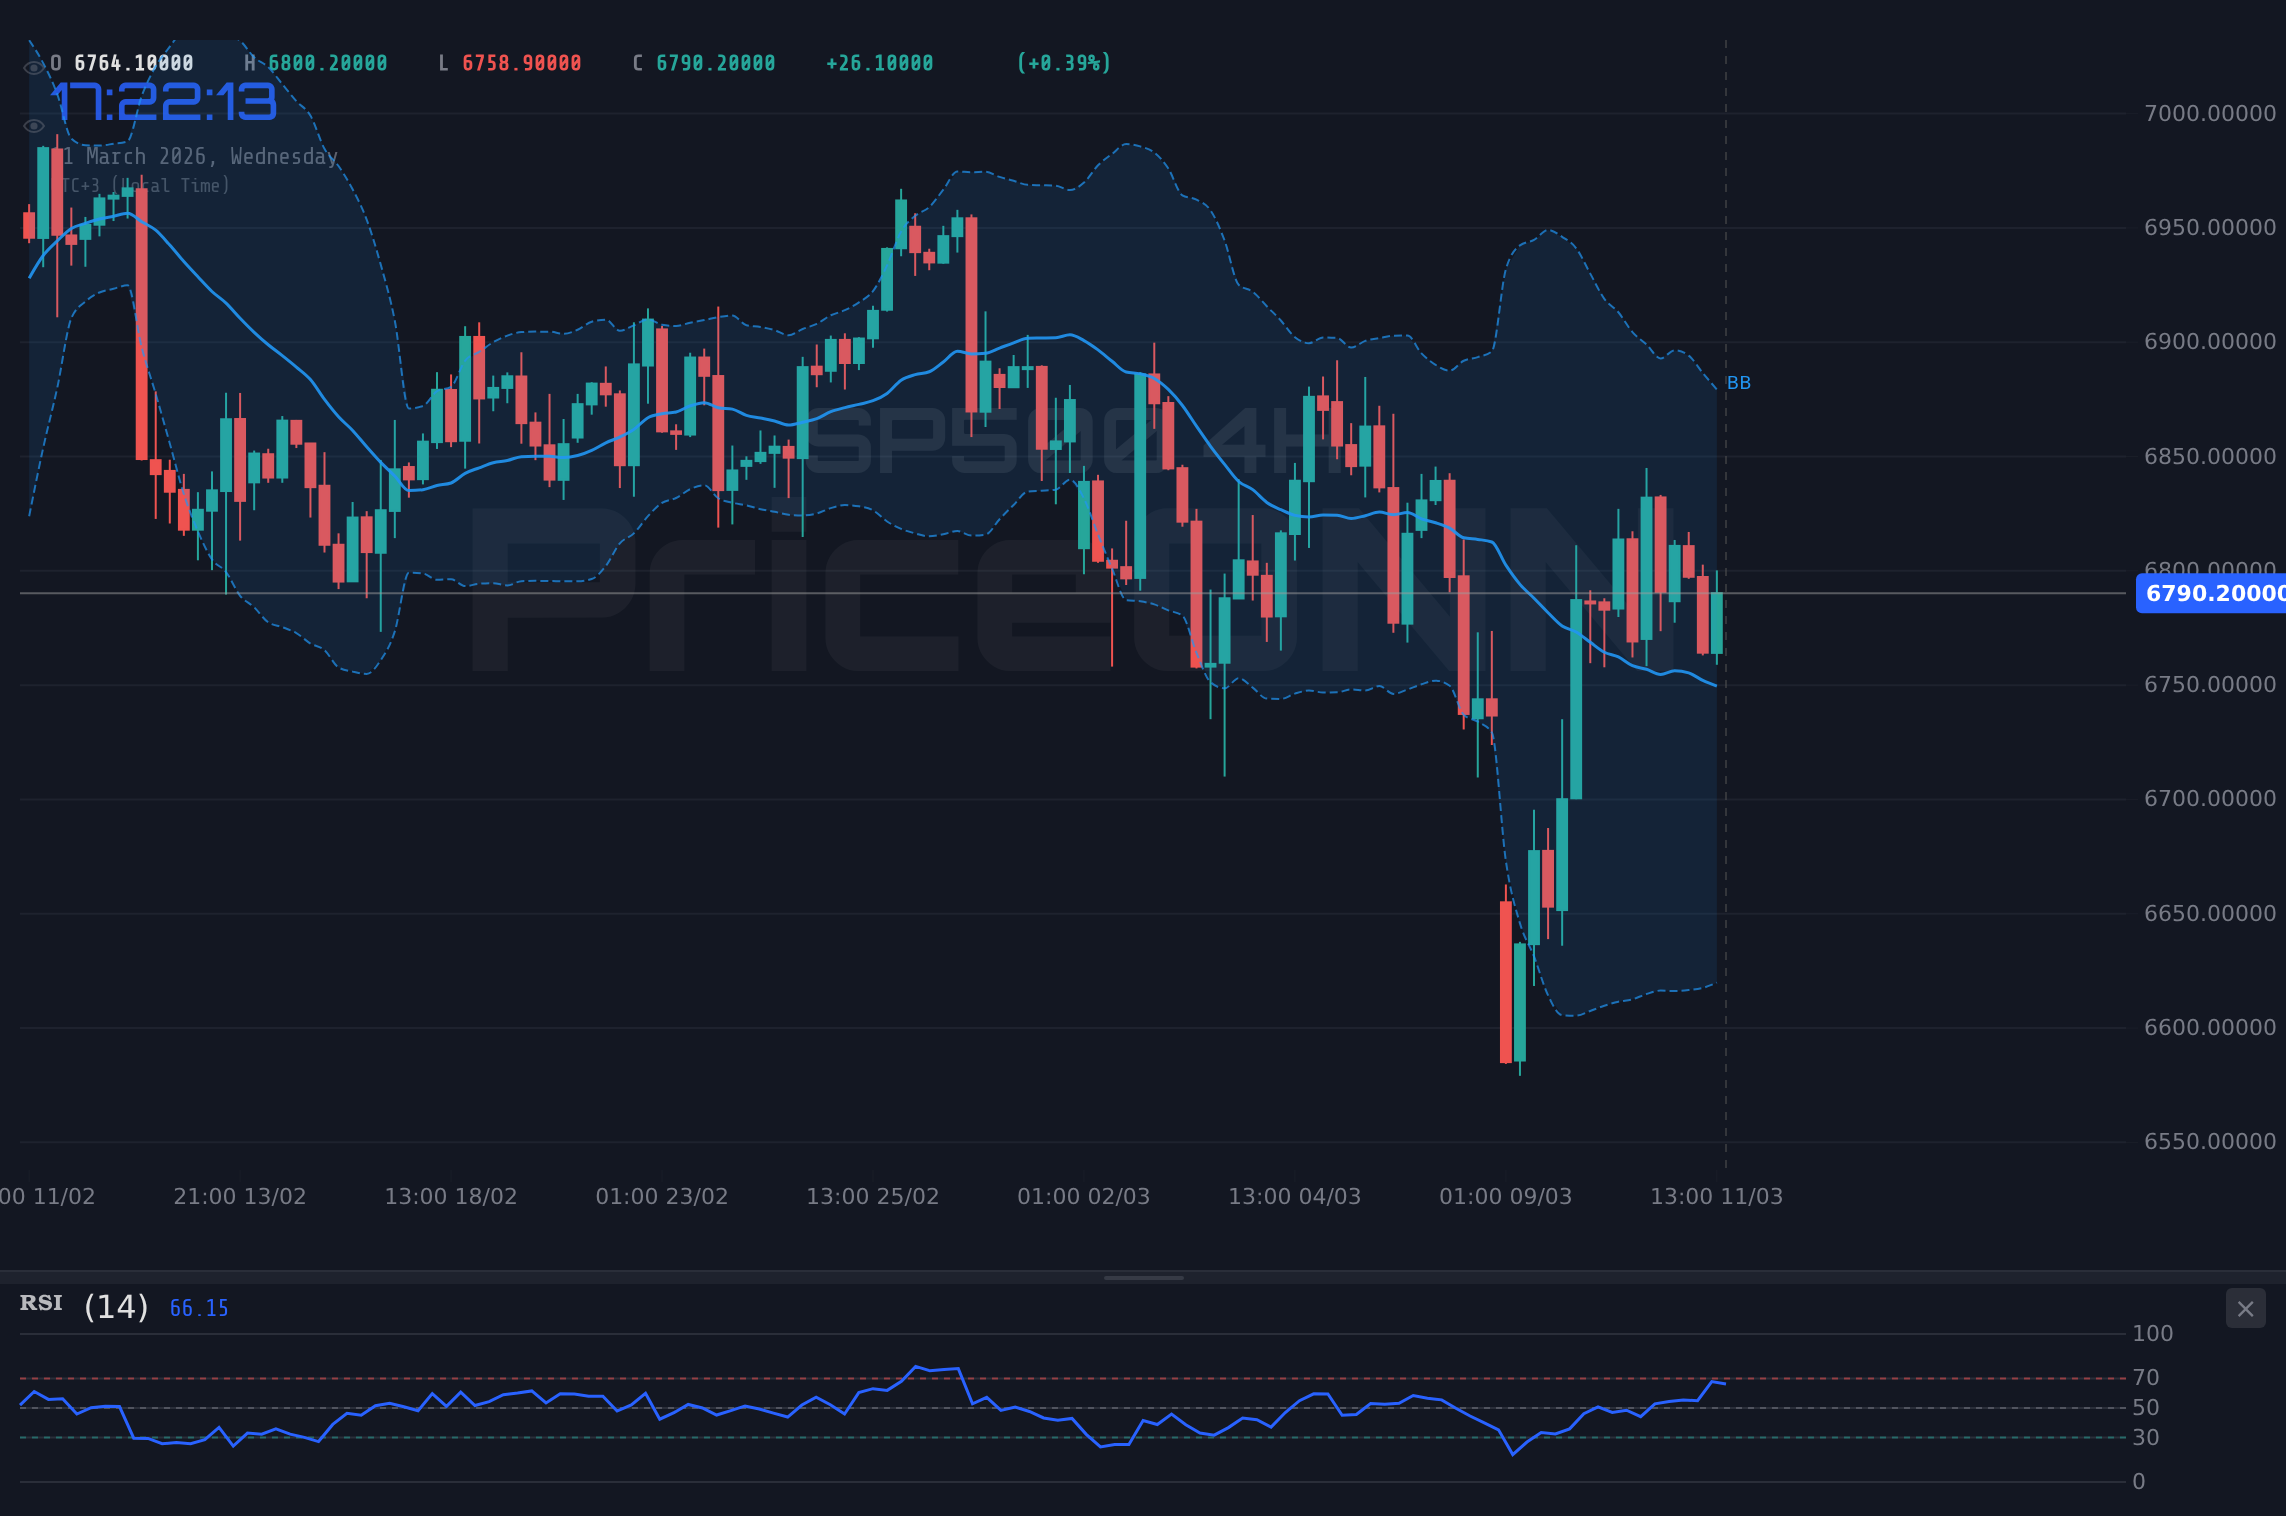
The daily chart provides a clearer bearish picture. The ADX at 34.27 confirms the strength of the downward trend. The RSI at 44.33 suggests that there is still room for further declines before the index becomes oversold. The MACD histogram is negative, reinforcing the bearish outlook. The Bollinger Bands indicate that the SP500 is trading below its middle band, suggesting that the index is in a downtrend. The key level to watch is $6,750.73. A sustained break below this level would confirm the bearish thesis and open the door for further declines.
Having tracked SP500 through the 2024 rate cycle, I have seen similar patterns play out before. Historically, when the RSI reaches this zone on SP500, the outcome has been highly dependent on the prevailing macroeconomic narrative. If the market believes that the Fed will remain hawkish, the bearish scenario is more likely to unfold. Conversely, if the market anticipates a dovish pivot, the SP500 could rebound strongly.
Trade Recommendation: WATCH_ZONE – Patience Looks Like It Will Be Rewarded Here
Given the conflicting signals and the uncertainty in the market, the trade recommendation is to remain in a WATCH_ZONE. The ADX at 15.52 indicates that the market is choppy and ranging, making any trade plan risky. While the RSI and MACD histogram are aligned, providing a seemingly clear directional signal, the Stochastic is in a tradeable zone, suggesting that the market is not yet oversold or overbought. A daily close above $6,837.93 would open the door for a bullish setup, targeting the resistance levels at $6,885.07 and $6,925.13. Conversely, a sustained break below $6,750.73 would confirm the bearish thesis, targeting the support levels at $6,710.67 and $6,663.53. Manage your risk, wait for your setup-the market always gives a second chance.
Volatility Creates Opportunity
As of March 11th, the SP500 is at a critical juncture. The clash between bullish and bearish forces, coupled with the complex interplay of technical and fundamental factors, creates a challenging but potentially rewarding environment for traders. The key is to remain patient, disciplined, and adaptable. By carefully monitoring the key levels, indicators, and macroeconomic developments, investors can position themselves to capitalize on the next move in the SP500. With disciplined risk management, these choppy waters can be navigated safely.
Frequently Asked Questions: SP500 Analysis
What happens if SP500 breaks below $6,750.73 support?
If the SP500 breaks below the $6,750.73 support level, it would likely trigger a sell-off, potentially leading to a test of lower support levels at $6,710.67 and $6,663.53. This breakdown would confirm the bearish thesis and suggest further downside risks for the index.
Should I buy SP500 at current $6,792.45 levels given RSI at 51.59?
Given the neutral RSI of 51.59 on the hourly chart, buying at the current level of $6,792.45 is risky. It's better to wait for confirmation of a bullish reversal, such as a break above the resistance level at $6,837.93, before initiating a long position.
Is ADX at 34.27 a strong sell signal for SP500?
Yes, the ADX at 34.27 on the daily chart indicates a strong downward trend, suggesting that the bearish momentum is significant. This reinforces the sell signal and highlights the potential for further declines in the SP500.
How will the upcoming USD data on March 13th affect SP500 this week?
The upcoming USD data on March 13th, including the Producer Price Index (PPI) and the Preliminary University of Michigan Consumer Sentiment, could significantly impact the SP500. Stronger-than-expected data could lead to a more hawkish stance from the Federal Reserve, putting further downward pressure on the index.
Technical Outlook Summary
| Indicator | Value | Signal |
|---|---|---|
| RSI (14) | 51.59 | Neutral |
| MACD Histogram | Negative | Bearish |
| Stochastic | 32.80 | Bullish |
| ADX | 34.27 | Strong Trend |
| Bollinger | Middle Band | Watch |
Key Levels
Support Levels
Resistance Levels
Track markets in real-time
AI-powered analysis, technical indicators and real-time price data.
Join Our Telegram Channel
Breaking market news, AI analysis and trading signals instantly.
Join Channel