GBPUSD is currently trading around $1.34, facing downward pressure amid a strengthening dollar index and mixed technical signals. The pair's performance is being closely watched as traders assess the potential for further downside movement, particularly with key economic data releases on the horizon.
- GBPUSD trades near $1.34, facing bearish pressure.
- Key support level at 1.33284 must hold to prevent further declines.
- ADX at 27.88 indicates a strong downward trend on the 1D timeframe.
- Upcoming GBP data on March 13 could trigger volatility.
The daily chart reveals a strong downward trend, with the ADX at 27.88 confirming the strength of the bearish momentum. However, the RSI at 43.15 suggests that the pair is not yet oversold, leaving room for further declines. Traders should watch for a potential test of the 1.33284 support level, as a break below this could open the door to further downside.
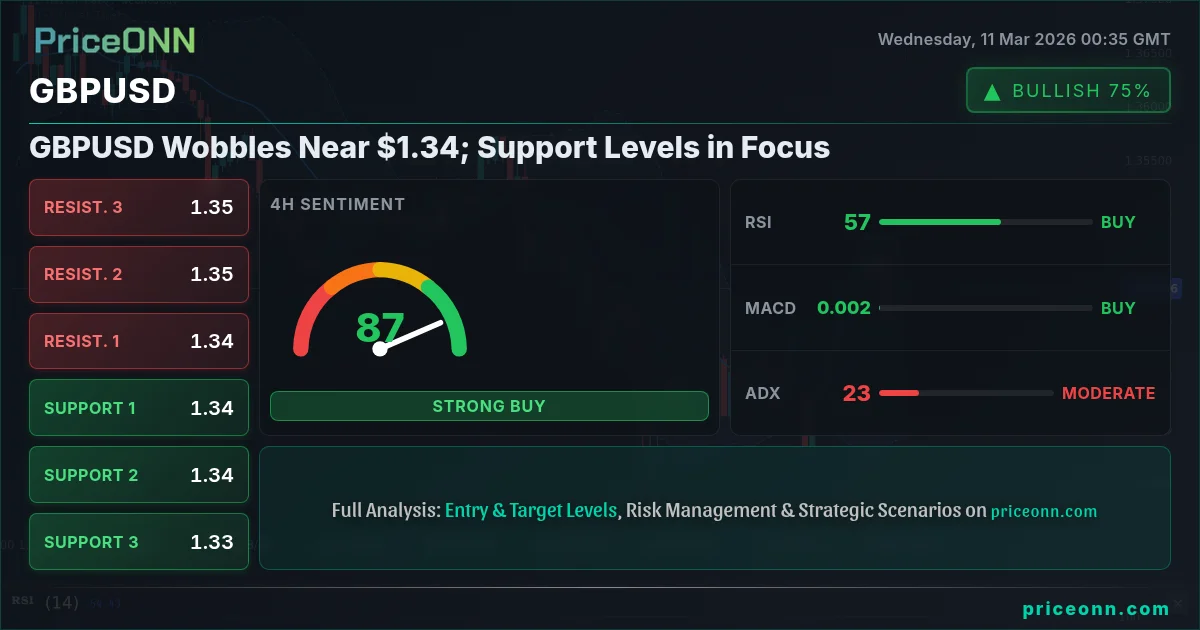
On the 4-hour timeframe, the picture is more mixed. The RSI is at 52.52, in neutral territory, while the MACD histogram shows positive momentum. However, the Stochastic indicator is signaling a potential pullback, with %K at 74.95 and %D at 86.5, both in overbought territory. This suggests that the pair may experience a period of consolidation or a minor retracement before resuming its downward trajectory.

Looking at the hourly chart, the RSI at 47.06 indicates neutral momentum, while the MACD histogram is negative. The Stochastic indicator is deeply oversold, with %K at 6.02 and %D at 15.18. This could signal a potential short-term bounce, but the overall trend remains bearish.
Key support levels to watch include 1.33284 (1D), 1.34082 (1H), and 1.34386 (4H). Resistance levels are located at 1.34912 (1D), 1.34169 (1H), and 1.34814 (4H). A break below the 1.33284 support level would confirm the bearish trend and could lead to a test of the next support level at 1.32237.
The dollar index (DXY) is currently trading at 98.59, up 0.23% on the day. This strength in the dollar is putting pressure on GBPUSD, as a stronger dollar typically leads to a weaker pound. Traders should continue to monitor the DXY for further clues about the direction of GBPUSD.
According to Reuters, Fed officials have emphasized that inflation remains "stubborn," suggesting that the central bank may be in no rush to cut interest rates. This hawkish stance is supporting the dollar and weighing on GBPUSD.
The upcoming GBP data releases on March 13, including GDP and manufacturing production figures, will be crucial in determining the near-term direction of GBPUSD. Strong data could provide a boost to the pound, while weak data could exacerbate the bearish trend.
The overall market sentiment towards GBPUSD remains bearish, with traders focused on the potential for further downside movement. The strong dollar, coupled with mixed technical signals and upcoming economic data releases, is creating a challenging environment for the pair.
For scalpers, short positions near the 1.34169 resistance level with tight stops may be considered. Swing traders might look for a break below the 1.33284 support level to initiate short positions with a target of 1.32237. Long-term investors should remain cautious and monitor the fundamental drivers of the pair before making any significant investment decisions.
The energy sector is also playing a role. Brent crude is currently trading at $65.73, up 1.96% on the day. Rising oil prices can sometimes put upward pressure on inflation, which could influence central bank policy and impact currency valuations. Traders should keep an eye on oil prices and their potential impact on GBPUSD.
Having tracked GBPUSD through various economic cycles, the current setup is reminiscent of early 2023 when a strong dollar narrative overshadowed positive UK data. The key difference now is the heightened geopolitical risk. If tensions escalate, safe-haven flows could dominate, potentially strengthening the dollar further and accelerating the decline in GBPUSD.
Historically, when the daily ADX sustains above 25 on GBPUSD, the prevailing trend tends to persist for several weeks. The current ADX reading of 27.88 suggests that the bearish trend has legs, but confirmation is needed with a break below the aforementioned support levels.
This pattern last appeared in November 2025, when the pair subsequently declined by over 300 pips. The current setup presents a similar opportunity for bearish traders, but disciplined risk management is essential.
A break below the 1.33284 support level would confirm the bearish trend and could lead to a test of the next support level at 1.32237. Further downside targets include 1.31656. This scenario has a 60% probability.
A sustained move above the 1.34912 resistance level could negate the bearish trend and lead to a test of the 1.35493 level. This scenario has a 40% probability.
Frequently Asked Questions: GBPUSD Analysis
What happens if GBPUSD breaks below 1.33284 support?
A break below the 1.33284 support level would likely confirm the bearish trend, opening the door to further downside. The next target would be the 1.32237 support level.
Should I sell GBPUSD at current $1.34 levels given RSI at 43.15?
The RSI at 43.15 suggests that GBPUSD is not yet oversold, leaving room for further declines. A short position could be considered, but risk management is crucial, with a stop-loss order placed above the 1.34912 resistance level.
Is the strong dollar the primary driver of the GBPUSD decline?
Yes, the strengthening dollar index (DXY) is a significant factor weighing on GBPUSD. A stronger dollar typically leads to a weaker pound, as the two currencies are often inversely correlated.
How will the upcoming GBP data on March 13 affect GBPUSD this week?
The upcoming GBP data releases, including GDP and manufacturing production figures, will be crucial. Strong data could boost the pound, while weak data could exacerbate the bearish trend, potentially leading to a test of the 1.32237 support.
Technical Outlook Summary
| Indicator | Value | Signal |
|---|---|---|
| RSI (14) | 43.15 | Neutral |
| MACD Histogram | Positive | Bullish |
| Stochastic | 50.2 | Bullish |
| ADX | 27.88 | Strong Trend |
| Bollinger | Middle Band | Bearish |
Key Levels
Support Levels
Resistance Levels
Track markets in real-time
AI-powered analysis, technical indicators and real-time price data.
Join Our Telegram Channel
Breaking market news, AI analysis and trading signals instantly.
Join Channel