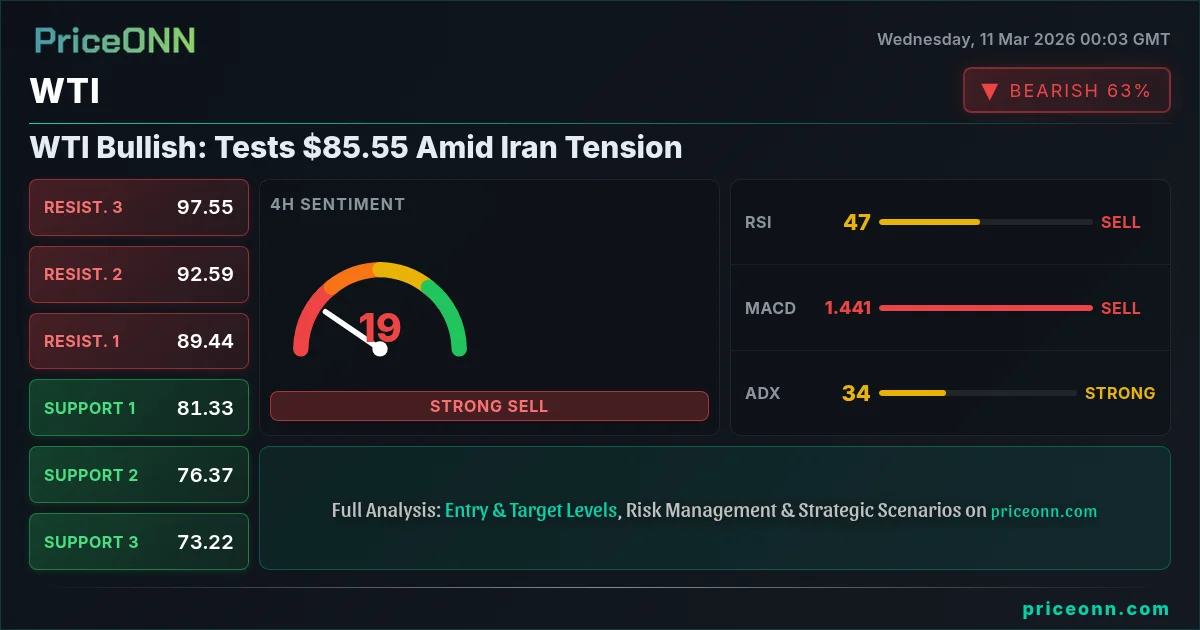
WTI Bullish: Tests $85.55 Amid Iran Tension
WTI crude oil tests $85.55 as geopolitical tensions in the Middle East escalate, fueled by Iran's threats to halt oil exports if attacked. Traders eye key resistance levels amid supply concerns.
WTI crude oil is testing the $85.55 level amid escalating tensions in the Middle East, specifically stemming from Iran's threats to halt oil exports if the U.S. and Israel launch attacks. This geopolitical risk has injected volatility into the market, prompting traders to reassess supply dynamics and potential price impacts. The situation is compounded by existing concerns about global economic growth and fluctuating demand, creating a complex landscape for oil prices.
- WTI is currently trading at $85.55, influenced by geopolitical tensions and supply concerns.
- Key resistance level sits at $86.72, a break above could signal further upside.
- ADX at 30.49 indicates a strong downtrend in the 1H timeframe, but the daily ADX shows a strong uptrend at 43.17.
- The potential for supply disruptions due to Middle East tensions is driving WTI’s correlation with safe-haven assets like gold.
Why Middle East Tensions are Driving WTI
The surge in WTI prices is directly linked to the heightened geopolitical risks in the Middle East, particularly involving Iran. According to recent news, Iran has threatened to halt all Middle East oil exports if attacked by the U.S. and Israel. Such a move would significantly disrupt global oil supply, as the region accounts for a substantial portion of the world's oil production. This threat has triggered immediate concerns about potential supply shortages, leading to increased buying pressure and pushing WTI prices higher. The market is pricing in the risk of a major disruption, which could send prices soaring if the situation escalates further.
Moreover, the market is sensitive to any developments that could affect the Strait of Hormuz, a critical chokepoint for oil shipments. Any closure or disruption to this waterway would have a cascading effect on global oil prices, as it is a key transit route for Middle Eastern oil exports. Traders are closely monitoring the situation, and the possibility of further escalation is keeping upward pressure on WTI prices. This geopolitical premium is likely to persist as long as tensions remain elevated.

Analyzing WTI's Technical Picture
From a technical standpoint, WTI’s recent price action has been characterized by volatility and uncertainty. The 1-hour chart shows a neutral trend with the ADX at 29.11 indicating a strong downtrend, while the 4-hour chart shows a neutral trend. The daily chart, however, shows a strong uptrend with the ADX at 43.17. The Relative Strength Index (RSI) on the daily chart is at 74.45, signaling overbought conditions and suggesting potential for a pullback. However, the overall trend remains bullish, supported by positive momentum on the MACD histogram, which is positive on the 4H and 1D timeframes. The price is currently trading above the middle band of the Bollinger Bands on the 1D timeframe, indicating bullish momentum. This mixed signal suggests that WTI is at a critical juncture, and the next move will likely depend on the resolution of the geopolitical tensions and the upcoming economic data releases.
Looking at key levels, immediate support can be found at $87.26, $86.34 and $85.76. Resistance levels are at $88.76, $89.34 and $90.26. A sustained break above $86.72 could pave the way for a move towards $90, while a failure to hold above $85.76 could trigger a deeper correction towards $75.02. Traders should closely monitor these levels for potential entry and exit points. The Stochastic oscillator on the 1H and 1D timeframes are signaling bearish signals, while the 4H timeframe is signaling an overbought condition and the potential for a pullback.
EUR/USD's Response to the Energy Shock
The energy shock stemming from Middle East tensions is also rippling through the forex market, particularly impacting EUR/USD. News reports suggest that the energy shock is repricing Euro rates more significantly than Dollar rates, keeping EUR/USD supported around 1.1608. The pair maintains support at 1.1500. The DXY is currently at 98.67, exerting downward pressure on the EURUSD. This dynamic underscores the complex interplay between energy prices, currency valuations, and central bank policies. The European Central Bank (ECB) will be closely watching inflation data to gauge the impact of higher oil prices on the Eurozone economy, which could influence future monetary policy decisions.
WTI Trade Plan: Bullish Breakout Scenario
Given the current technical setup and the geopolitical backdrop, a bullish breakout scenario for WTI is plausible. The strong uptrend on the daily chart, coupled with positive momentum on the MACD, suggests that the path of least resistance is to the upside. However, the overbought conditions on the RSI warrant caution, and traders should wait for confirmation before entering long positions.
If WTI breaks above the $86.72 resistance, it could trigger a rally towards the $88.76 and $89.34 targets. This scenario is likely to play out if geopolitical tensions escalate further or if economic data supports strong global demand. A sustained break above $86.72 would confirm the bullish breakout and pave the way for further gains.
If WTI fails to break above $86.72 and instead closes below the $85.76 support, it could signal a deeper correction towards $75.02. This scenario is likely to occur if geopolitical tensions ease or if economic data points to weakening global demand. A sustained break below $85.76 would confirm the bearish reversal.
Economic Calendar Impact and Risk Assessment
The upcoming economic data releases will play a crucial role in shaping WTI's price action. The market is awaiting the release of economic data, which could provide further insights into the global economic outlook and its impact on oil demand. Traders should closely monitor these releases for any surprises that could trigger volatility in the oil market. On March 13th, the market is awaiting GBP data. The economic data could cause volatility in the GBP/USD currency pair.
The current geopolitical tensions and the potential for supply disruptions add a layer of complexity to the market. While the technical setup suggests a bullish bias, the overbought conditions and the upcoming economic data releases warrant caution. Traders should carefully manage their risk and avoid overexposure to the oil market. A potential trade setup could involve waiting for a breakout above $86.72 with a stop-loss order placed below $85.76. The targets would be $88.76 and $89.34. This setup offers a favorable risk-reward ratio, but traders should be prepared to adjust their positions based on the evolving market conditions.
Frequently Asked Questions: WTI Analysis
What happens if WTI breaks above $86.72 resistance?
If WTI breaks above the $86.72 resistance level, it could trigger a rally towards the $88.76 and $89.34 targets. The bullish scenario is likely to play out if geopolitical tensions escalate further or if economic data supports strong global demand.
Should I buy WTI at current levels of $85.55 given RSI at 74.45?
Given the current RSI of 74.45 on the daily chart, WTI is in overbought territory, warranting caution. While the overall trend is bullish, waiting for a pullback or confirmation of a breakout above $86.72 before entering a long position may be prudent to manage risk.
Is the MACD signal a reliable indicator for WTI trend analysis?
The MACD histogram is positive on the 4H and 1D timeframes, which supports the bullish trend. However, traders should consider the MACD in conjunction with other indicators and price action to confirm the trend and avoid false signals.
How will the upcoming economic data affect WTI this week?
The upcoming economic data releases, particularly on March 13th, could provide further insights into the global economic outlook and its impact on oil demand. Strong economic data could support higher oil prices, while weak data could trigger a correction.
Technical Outlook Summary
| Indicator | Value | Signal |
|---|---|---|
| RSI (14) | 74.45 | Overbought |
| MACD Histogram | Positive | Bullish |
| Stochastic | 54.52/58.52 | Bearish |
| ADX | 43.17 | Strong Uptrend |
| Bollinger | Upper Band | Watch |
Key Levels
Support Levels
Resistance Levels
Track markets in real-time
AI-powered analysis, technical indicators and real-time price data.
Join Our Telegram Channel
Breaking market news, AI analysis and trading signals instantly.
Join Channel